Four-Circle Venn Diagram
Overview
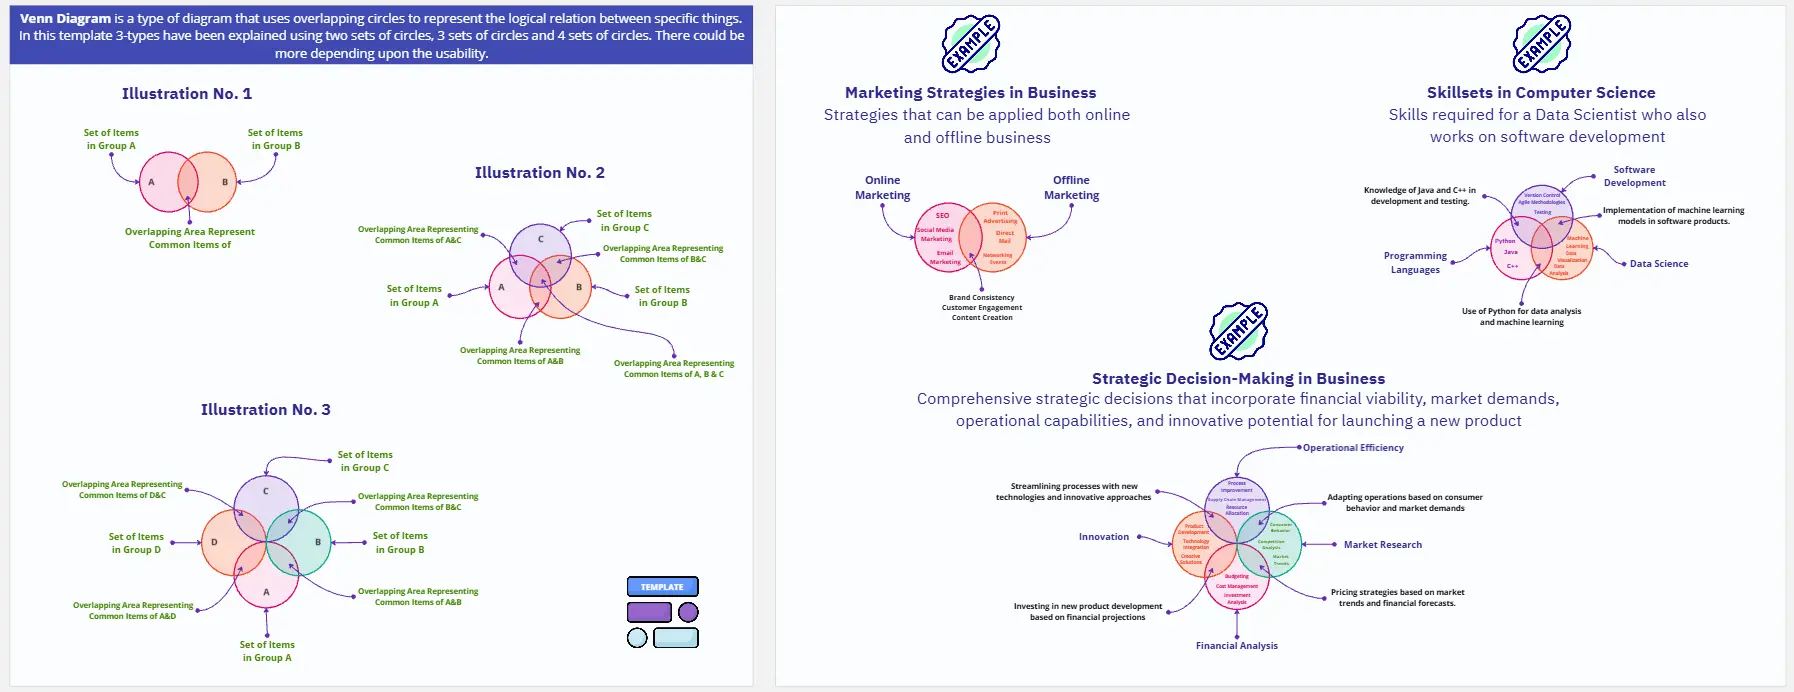
A Venn diagram is a graphical representation that shows similarities and differences between items, concepts or data. They utilize shapes, often circles, to illustrate relationships and compare data.
Venn diagrams are certainly one of the most well-known types of diagrams. This design, featuring a series of simple circles or ellipses or rectangles that overlap is ubiquitous. The overlapping region of a Venn diagram indicates similarities while others showcase differences. Although the Venn diagram was created to describe mathematically logical relationships, it’s now used to show all types of relationships.
Uses:
Four Circle Venn diagrams are used to visualize the relationships and intersections between four different sets or groups. The purpose of using Four Circle Venn diagrams includes:
1. Complex Comparison and Analysis
Understanding Overlaps: When dealing with four different sets or groups, it can be challenging to understand how they overlap and interact. Four Circle Venn diagrams make it possible to visualize all possible intersections among these sets.
Identifying Patterns: By examining the intersections, patterns or commonalities can be identified. For example, in market research, overlapping customer preferences can be studied to tailor marketing strategies.
2. Identifying Commonalities and Differences
Shared Characteristics: Four Circle Venn diagrams help pinpoint characteristics or elements that are common to all four sets. For instance, in genetics, researchers might use them to identify traits shared among different species.
Unique Attributes: They also highlight elements that are unique to each set, which can be crucial for distinguishing between groups. In product development, this could help in identifying unique selling points of different products.
3. Problem Solving and Logical Reasoning
Simplifying Complex Problems: These diagrams break down complex problems involving multiple variables into simpler, visual parts. This simplification aids in logical reasoning and problem-solving.
Set Theory and Mathematics: In mathematics, Four Circle Venn diagrams are used to teach and understand set theory, helping to visualize concepts like unions, intersections, and complements of sets.
4. Data Visualization
Clear Representation: They offer a clear and concise way to represent data, making it easier to communicate complex relationships. This is particularly useful in presentations and reports.
Insightful Analysis: By visualizing data intersections, insights can be drawn more easily compared to raw data tables. For example, in business intelligence, understanding how different departments' data overlap can inform strategic decisions.
5. Decision Making
Comparing Options: Four Circle Venn diagrams can be used to compare different options or criteria, highlighting overlaps and exclusive areas. This can be crucial in strategic planning and decision-making.
Strategic Planning: For instance, in project management, different project requirements or constraints can be visualized to see how they interact, helping to make informed decisions about resource allocation and prioritization. Learn from the examples provided to start your own Venn diagram.
Good Luck
Khawaja Rizwan
Categories


Comments
Read our Community Guidelines and Terms of Use.