3원 벤 다이어그램 템플릿 소개
Miro의 3원 벤 다이어그램 템플릿은 데이터 세트 간의 관계를 명확하고 효과적으로 보여주는 시각적 도구입니다. 두 개 이상의 원이 겹치는 벤 다이어그램은 여러 데이터 세트 간의 차이와 유사성을 시각화하는 데 유용합니다.
따라서, 확률을 평가하는 데 있어 통계, 수학 및 공학 분야에서도 Venn 다이어그램이 유용하다는 것은 놀라운 일이 아닙니다. Venn 다이어그램은 복잡한 아이디어를 시각적으로 매력적이고 이해하기 쉬운 방식으로 분해하는 데 도움을 주기 때문에, 특히 브레인스토밍과 문제 해결에 유용합니다.
3원 Venn 다이어그램 템플릿을 사용하면 처음부터 하나를 만드는 시간을 절약할 수 있습니다. 이 템플릿을 최대한 활용하는 방법을 안내해 드리겠습니다.
3원 Venn 다이어그램 템플릿 사용 방법
시작하려면 Miro에서 3원 Venn 다이어그램 템플릿을 열기 위해 파란색 “템플릿 사용” 버튼을 클릭하세요. 준비가 되면 다음 단계를 따르세요:
1. 각 원에 데이터 추가하기
이름 그대로, 3원 Venn 다이어그램 템플릿에는 세 개의 원이 준비되어 있습니다. Venn 다이어그램에서 비교하려는 그룹을 식별하고, 각 원에 A, B, C를 할당하세요. 각 원에 해당 그룹에 속하는 항목을 나열하세요.
예를 들어, 사과, 배, 오렌지의 특성을 비교한다고 가정해 보겠습니다. 사과의 특성은 원 A에, 배의 특성은 원 B에, 오렌지의 특성은 원 C에 나열할 수 있습니다.
2. 차이점 식별하기
사과, 배, 오렌지를 색상에 따라 비교한다고 가정해 보겠습니다. 원 A에는 "빨간색"을, 원 B에는 "녹색"을, 원 C에는 "주황색"을 쓸 수 있습니다. 각각의 과일이 고유한 색상을 가지고 있기 때문에 겹치는 원이 없다는 것을 알 수 있습니다. 이것들이 바로 차이점입니다. 각 원의 글상자를 더블클릭하여 미리 작성된 텍스트를 자신만의 것으로 바꿀 수 있습니다.
3. 유사점 식별하기
세 과일 모두 공통적으로 가지고 있는 특성을 식별하여 원이 겹치는 부분에 해당 특성을 배치하세요. 예를 들어, "씨가 있는" 이라는 유사점을 쓸 수 있습니다. 겹치는 부분의 글상자를 더블클릭하여 미리 작성된 텍스트를 편집할 수 있습니다.
4. 템플릿 맞춤 설정하기
비교할 세 가지 개체나 개념에 대한 모든 정보를 추가한 후에는, 템플릿의 외관을 맞춤 설정할 차례입니다. 3원 벤 다이어그램 템플릿에서 도형, 크기, 글꼴 유형을 쉽게 변경할 수 있습니다. 이러한 변경을 통해 다이어그램을 브랜드 색상에 맞추거나 정보를 더 명확하게 표시하거나 단순히 시각적으로 더 매력적으로 만들 수 있습니다.
처음부터 직접 벤 다이어그램을 만들고 싶으신가요? 벤 다이어그램 도구를 방문해 자세히 알아보세요.
Miro의 3원 벤 다이어그램 템플릿을 사용하는 이점
Miro는 팀과 함께 온라인으로 벤 다이어그램을 쉽게 만들고, 실시간 또는 비동기식으로 논의할 수 있도록 도와줍니다. 3원 벤 다이어그램 템플릿을 추가하는 데 몇 초밖에 걸리지 않으며, 커스터마이징 작업을 바로 시작할 수 있습니다. 텍스트를 쉽게 편집하고, 자신의 이미지를 드래그 앤 드롭하며, 댓글에 팀원을 태그할 수 있습니다.
무한 캔버스를 통해 스티커 메모, 도형, 이미지를 원하는 만큼 추가하여 벤 다이어그램에 대한 맥락을 제공할 수 있습니다. Miro는 130개 이상의 앱과 통합되며, Jira, Trello 같은 프로젝트 관리 도구와 Microsoft 365, Google Workspace 같은 전체 번들도 포함되어 있습니다. 이는 여러분이 이미 좋아하는 다른 도구와 함께 3원 벤 다이어그램 템플릿을 사용할 수 있음을 의미합니다.
벤 다이어그램 템플릿에 대한 FAQ
Miro의 3원 벤 다이어그램 템플릿은 무료인가요?
네, Miro의 3-원 벤 다이어그램 템플릿은 무료이며 사용자 지정이 가능합니다. "템플릿 사용"을 클릭하여 Miro에서 템플릿을 열고, 항목을 채우거나, 외관과 느낌을 편집하며 준비가 되면 팀원들과 공유해보세요.
Miro의 3-원 벤 다이어그램 템플릿은 언제 사용해야 하나요?
벤 다이어그램의 가장 유명한 사용 사례 중 하나는 확률을 결정하는 것으로, 데이터 분석, 엔지니어링 등 다양한 과학 분야에서 특히 흔히 사용됩니다. 과학을 말하자면, 소프트웨어와 컴퓨터 과학 분야에서 복잡한 알고리즘을 시각적으로 해결하는 데도 유용합니다. 또한, 벤 다이어그램은 서로 다른 언어와 언어 그룹 간의 유사점과 차이점을 연구하는 예술에서도 인기가 있습니다. 즉, 두 개 이상의 그룹을 비교해야 할 때 언제든지 벤 다이어그램을 사용할 수 있습니다.
벤 다이어그램의 주요 구성 요소는 무엇인가요?
여섯 가지 주요 구성 요소는 다음과 같습니다: 집합, 합집합, 교집합, 대칭차, 여집합, 그리고 차집합입니다. 집합은 비교할 숫자, 아이디어, 혹은 사물 같은 데이터를 말합니다. 합집합은 벤 다이어그램에서 고려하는 모든 것으로, 보편집합이라고도 합니다. 교집합은 데이터 세트가 공통적으로 가진 부분, 즉 원이 겹치는 부분을 의미합니다. 대칭차는 교집합을 제외한 모든 것을 포함합니다. 여집합은 특정 집합에 속하지 않는 모든 것을 가리키며, 차집합은 하나의 집합에는 있지만 다른 집합에는 없는 모든 것을 말합니다.

Miro
AI 이노베이션 워크스페이스
Miro는 팀과 AI를 하나로 연결해 더 빠르게 계획하고, 함께 만들고, 다음 혁신을 실현하는 협업 플랫폼입니다. 1억 명이 넘는 프로덕트 매니저, 디자이너, 엔지니어 등 다양한 역할의 실무자와 팀이 Miro를 활용해 초기 탐색 단계부터 최종 전달까지 AI 중심의 단일 캔버스에서 자연스럽게 흐름을 이어갑니다. Miro는 팀워크가 이루어지는 지점에 AI를 통합해 사일로를 허물고 정렬을 강화하며 혁신 속도를 높입니다. 캔버스 자체가 프롬프트가 되는 Miro의 협업형 AI 워크플로를 통해 업무 흐름을 끊김 없이 유지하고, 일하는 방식을 조직 전반으로 확장해 실질적인 변화를 만들어낼 수 있습니다.
카테고리
유사한 템플릿

공감 지도 템플릿
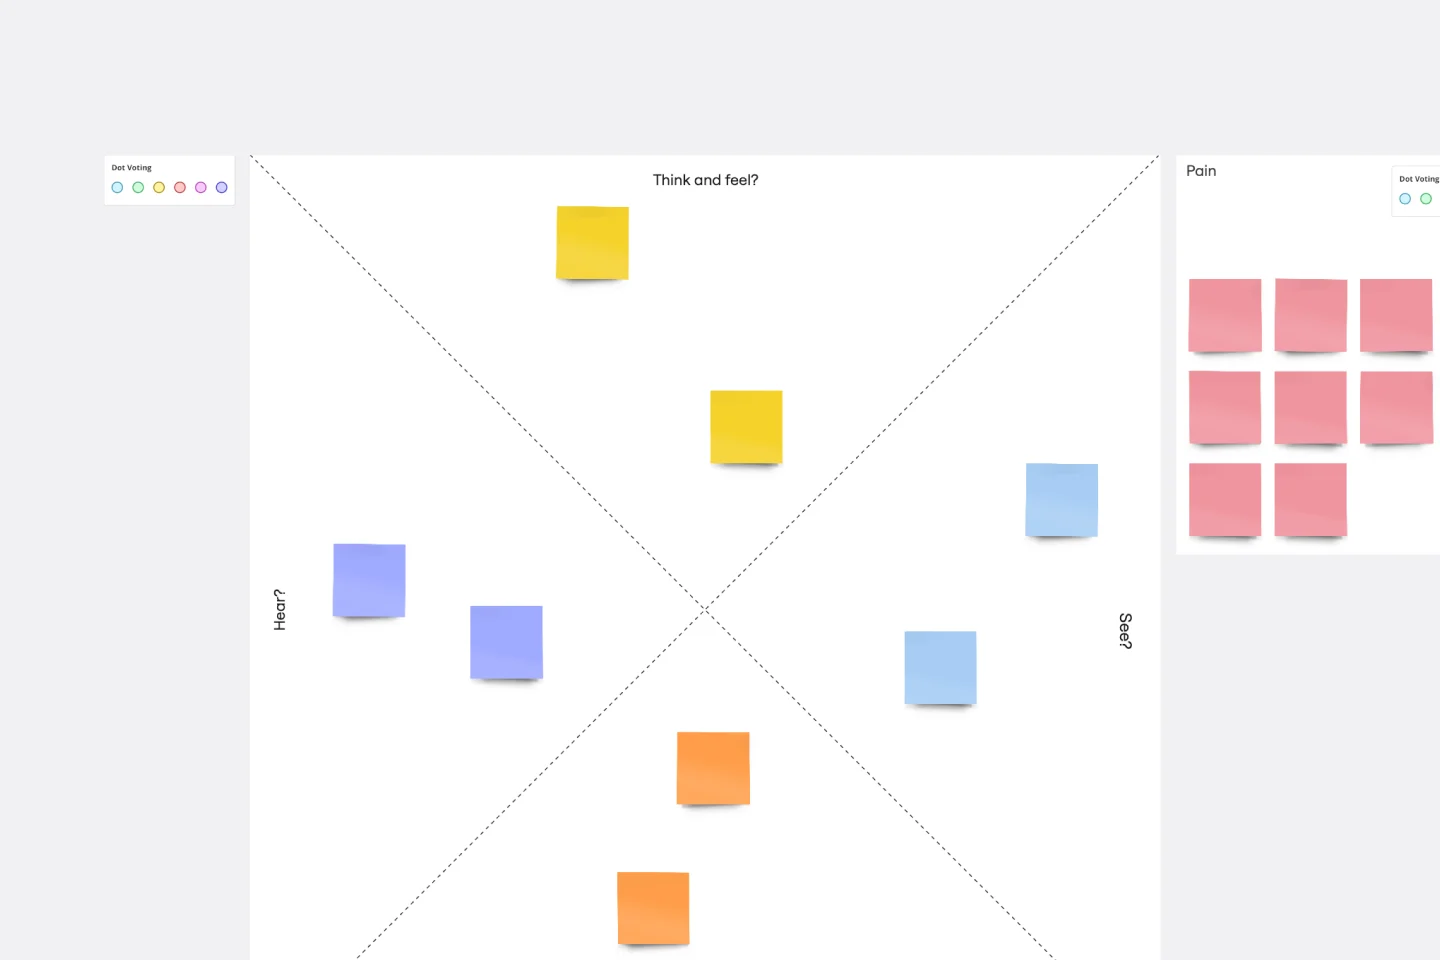
새로운 사용자를 유치하고, 제품을 사용하도록 유도하며 충성도 높은 고객으로 전환시키는 것은 모두 그들을 이해하는 것에서 시작됩니다. 공감 맵은 고객에 대해 알고 있는 모든 것을 정리할 수 있는 공간을 제공하여 이해로 이어지는 도구입니다. 이를 통해 고객의 요구, 기대, 결정 요소 등을 명확히 하고, 가정에 도전하고 지식의 빈틈을 식별할 수 있습니다. 템플릿을 사용하면 고객이 무엇을 말하고(Say), 생각하고(Think), 행동하고(Do), 느끼는지(Feel) 네 개의 주요 섹션으로 나뉜 공감 맵을 쉽게 만들 수 있습니다.

어피니티 다이어그램 템플릿
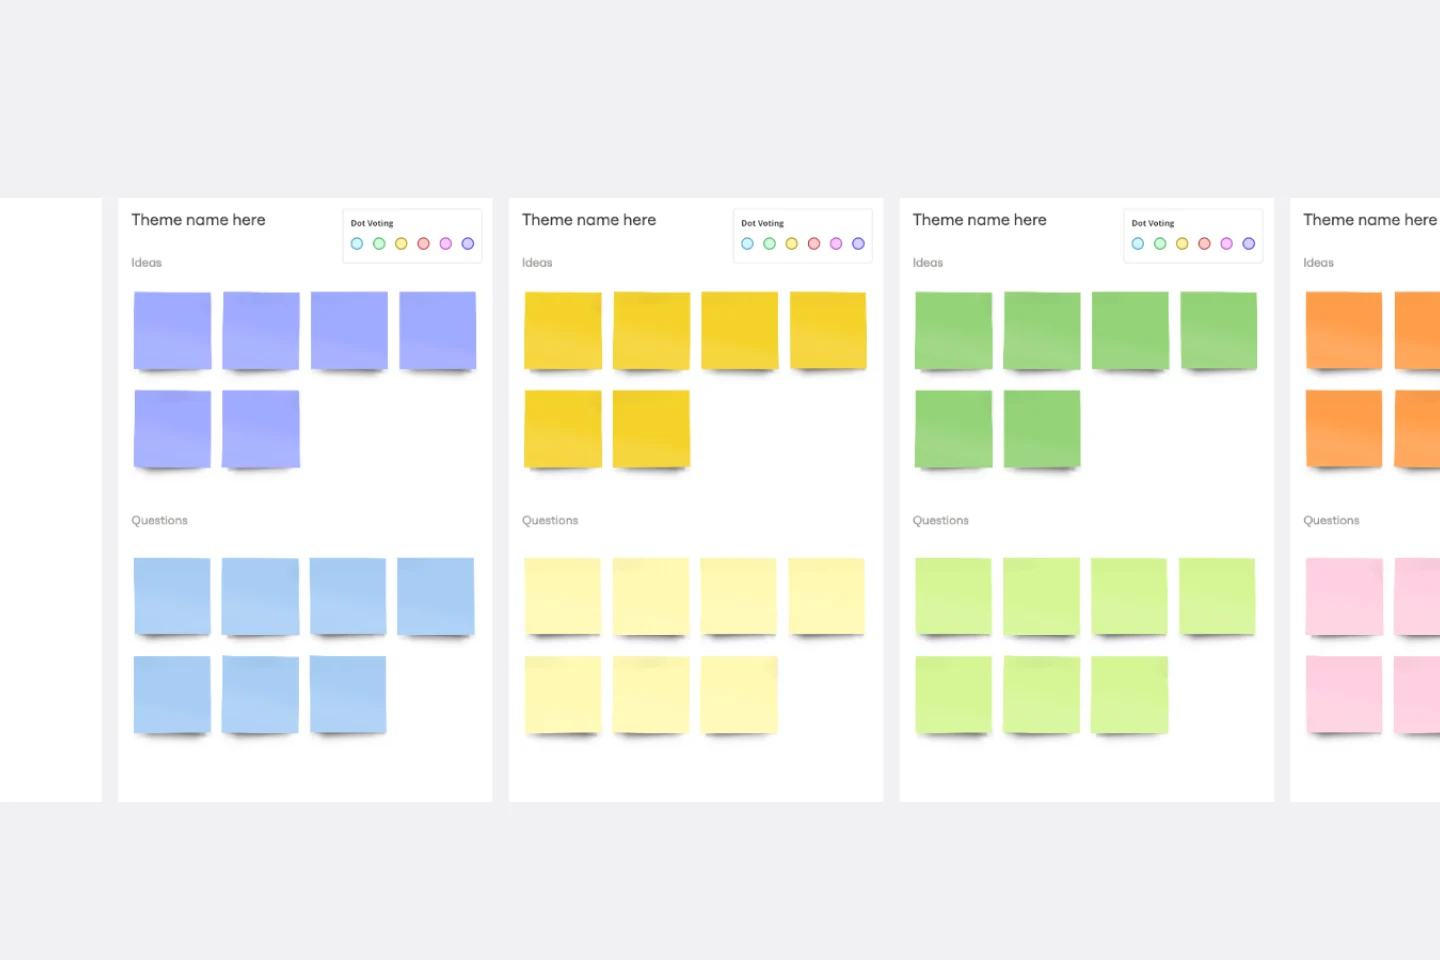
어피니티 다이어그램을 사용하여 브레인스토밍 세션에서 나온 정보를 생성, 조직 및 통합할 수 있습니다. 제품을 개발하거나, 복잡한 문제를 해결하거나, 프로세스를 수립하거나, 이슈를 해결할 때 어피니티 다이어그램은 각 팀원이 참여하고 자신의 생각을 공유할 수 있는 유용하고 간단한 프레임워크를 제공합니다. 이 도구는 브레인스토밍에만 국한되지 않으며, 합의를 도출하거나 설문 조사 결과와 같은 데이터를 분석해야 할 때도 훌륭한 템플릿입니다.

공감 지도 템플릿
새로운 사용자를 유치하고, 제품을 사용하도록 유도하며 충성도 높은 고객으로 전환시키는 것은 모두 그들을 이해하는 것에서 시작됩니다. 공감 맵은 고객에 대해 알고 있는 모든 것을 정리할 수 있는 공간을 제공하여 이해로 이어지는 도구입니다. 이를 통해 고객의 요구, 기대, 결정 요소 등을 명확히 하고, 가정에 도전하고 지식의 빈틈을 식별할 수 있습니다. 템플릿을 사용하면 고객이 무엇을 말하고(Say), 생각하고(Think), 행동하고(Do), 느끼는지(Feel) 네 개의 주요 섹션으로 나뉜 공감 맵을 쉽게 만들 수 있습니다.

어피니티 다이어그램 템플릿
어피니티 다이어그램을 사용하여 브레인스토밍 세션에서 나온 정보를 생성, 조직 및 통합할 수 있습니다. 제품을 개발하거나, 복잡한 문제를 해결하거나, 프로세스를 수립하거나, 이슈를 해결할 때 어피니티 다이어그램은 각 팀원이 참여하고 자신의 생각을 공유할 수 있는 유용하고 간단한 프레임워크를 제공합니다. 이 도구는 브레인스토밍에만 국한되지 않으며, 합의를 도출하거나 설문 조사 결과와 같은 데이터를 분석해야 할 때도 훌륭한 템플릿입니다.