0 mi piace
11 utilizzi
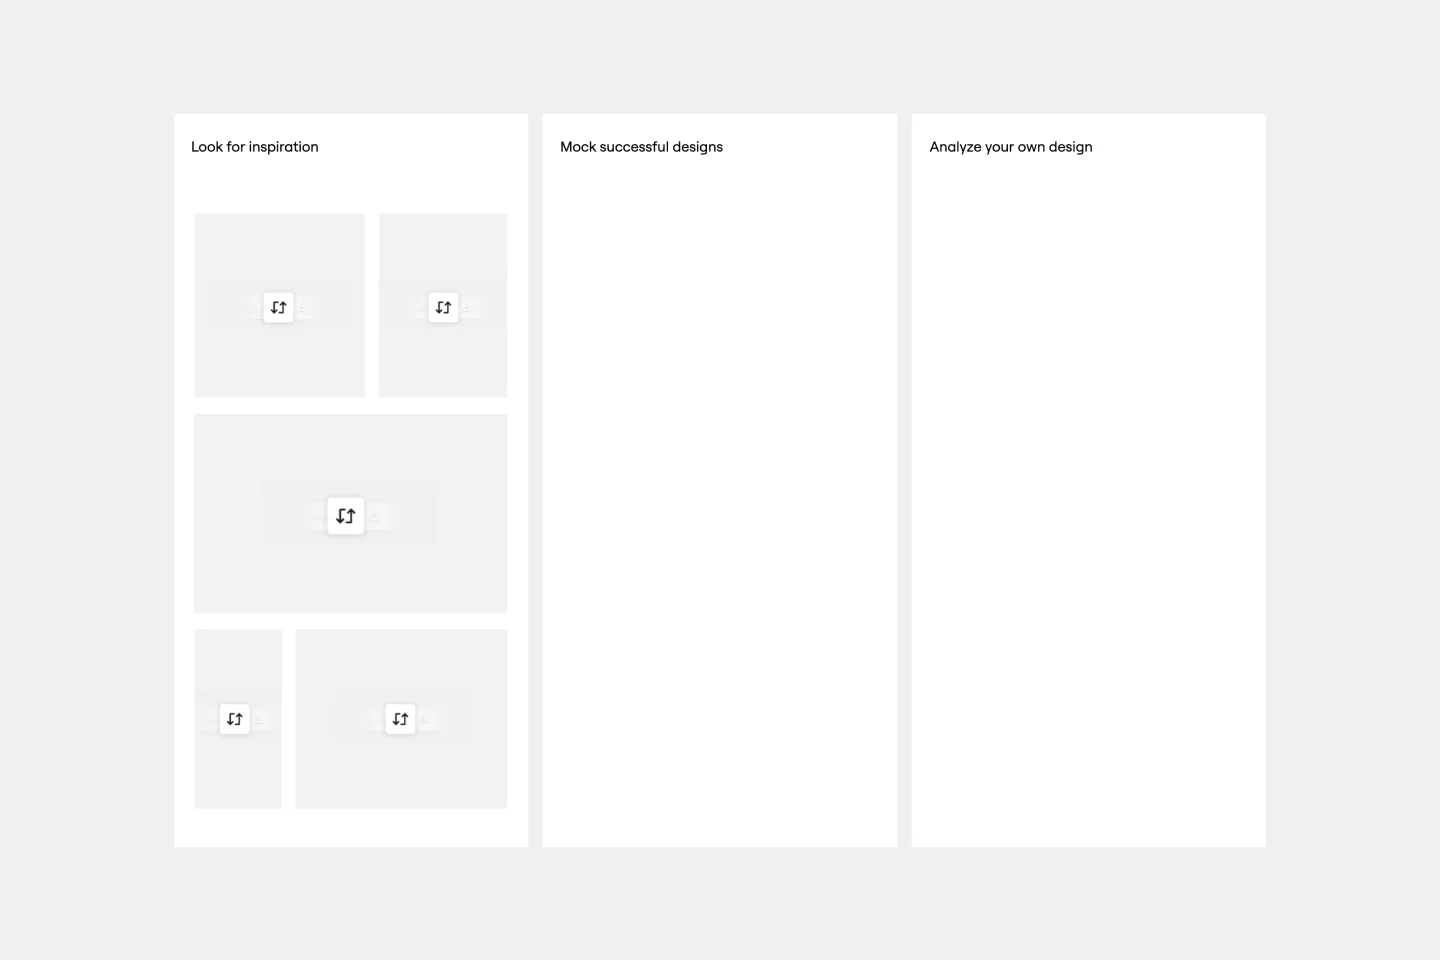
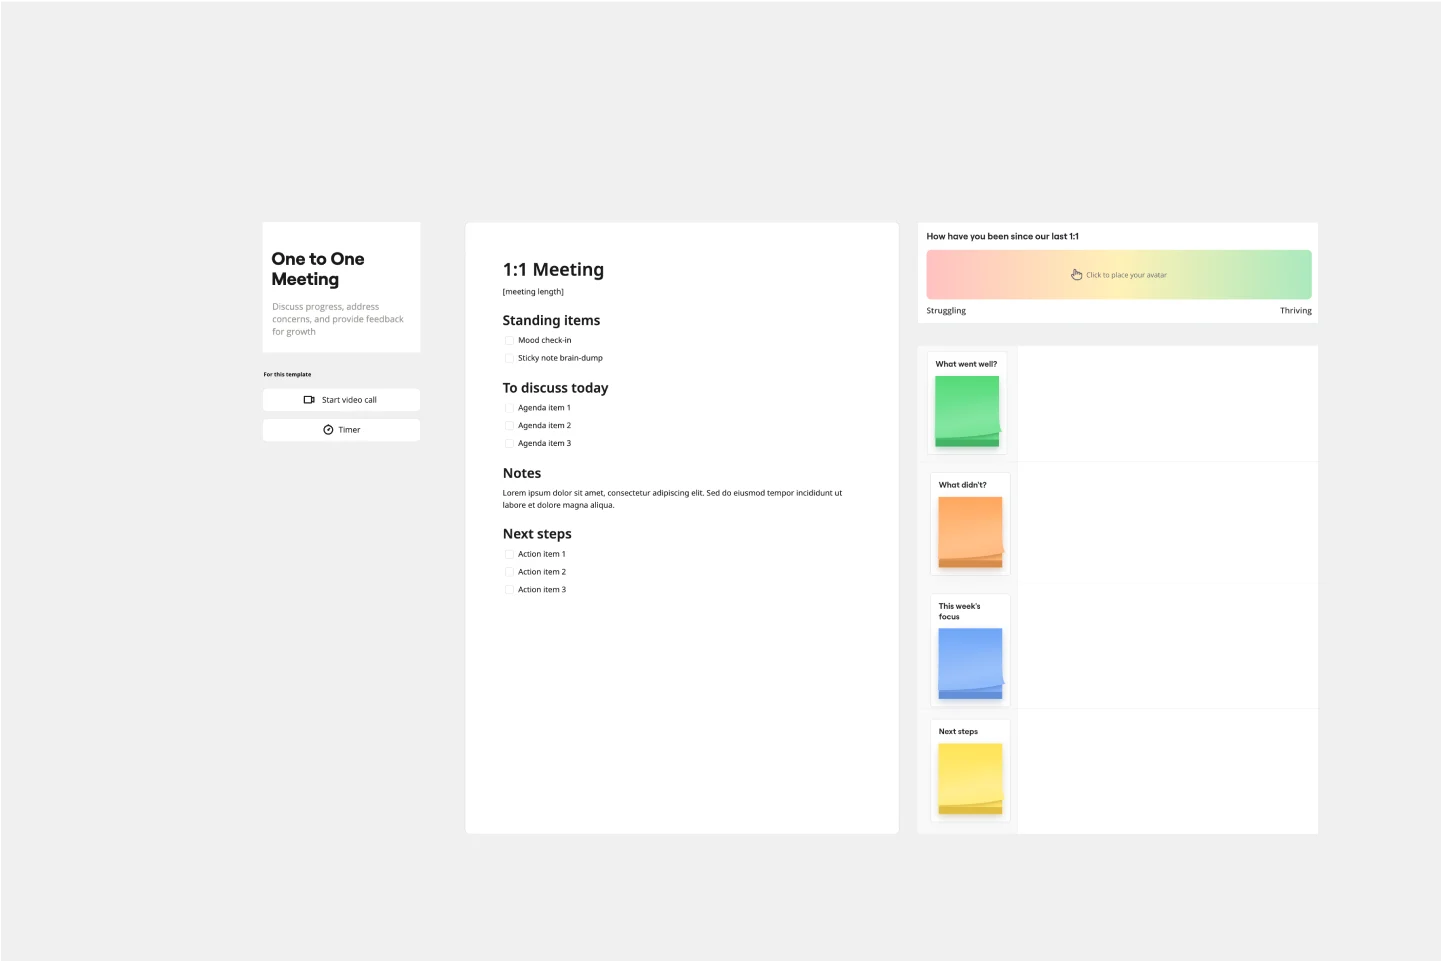
Modello Guarda, Simula, Analizza
Fare le tue ricerche è un passo fondamentale in qualsiasi processo di progettazione e l'approccio guarda, simula, analizza ti aiuta a esaminare, strutturare e semplificare la fase di sviluppo. Con questo strumento potrai identificare i punti di forza e quelli deboli, cosa fai nel modo giusto e nel modo sbagliato, e se utilizzi il tempo in modo efficiente. Il nostro modello guarda, simula, analizza, facilita il flusso di idee, le simulazioni di progetti e l'ottenimento del feedback. Puoi iniziare configurando la lavagna in meno di un minuto.