10 vind-ik-leuks
2,9K gebruik
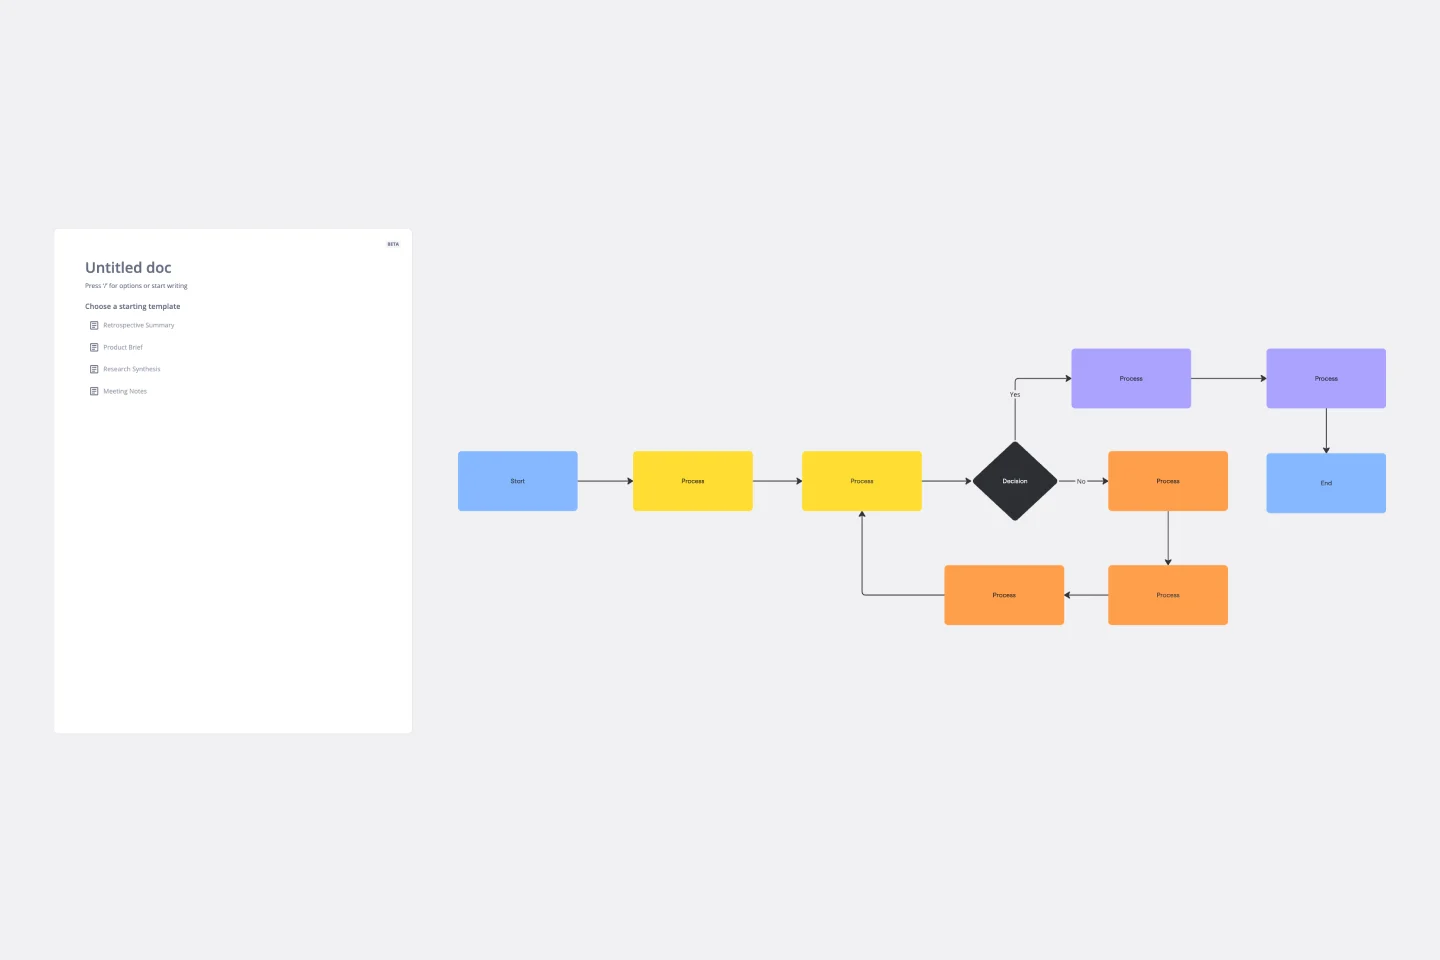
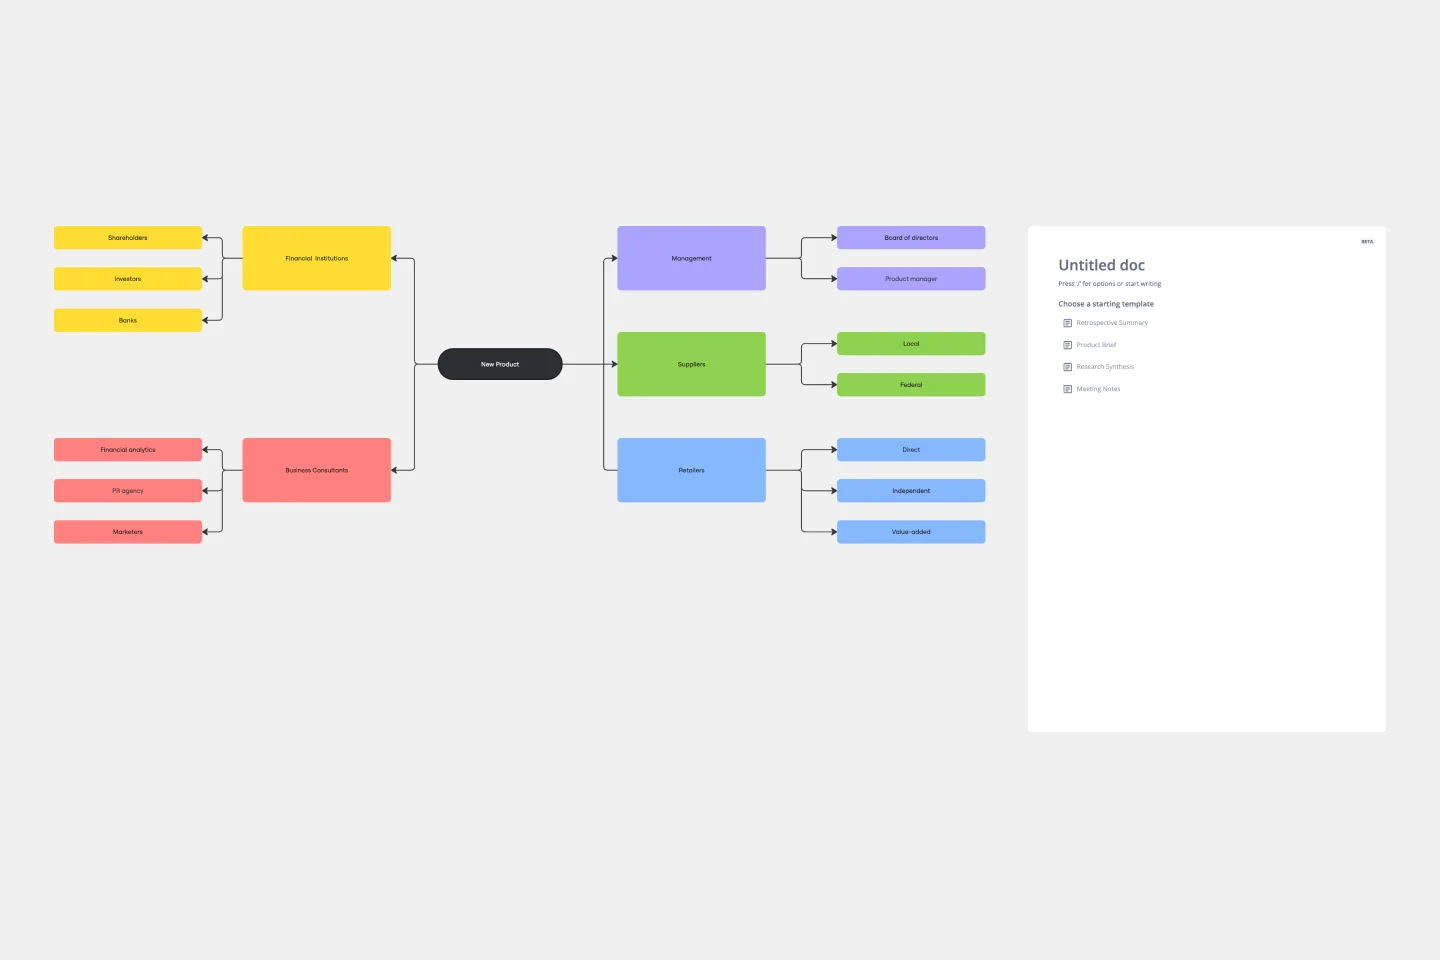
Flowchart Template
Probeer je een proces of workflow uit te leggen aan je team - of gewoon aan jezelf? Soms is de beste manier om het te zien, en dat is wanneer je een flowchart maakt. Aan de hand van veelgebruikte vormen (meestal ovalen, rechthoeken, ruiten en pijlen) laat een flowchart zien in welke richting een proces of workflow verloopt en in welke volgorde de stappen zich bevinden. Je krijgt niet alleen een duidelijk inzicht, maar je kunt ook potentiële tekortkomingen en knelpunten zien, waardoor je je proces kunt verfijnen en verbeteren en efficiënter een beter product kunt maken.