Organize ideas with Miro's T-chart
Visualize information with Miro’s T-chart maker. Easily identify patterns and improve decision-making.

Over 70M+ users love Miro
Create a T-chart fast
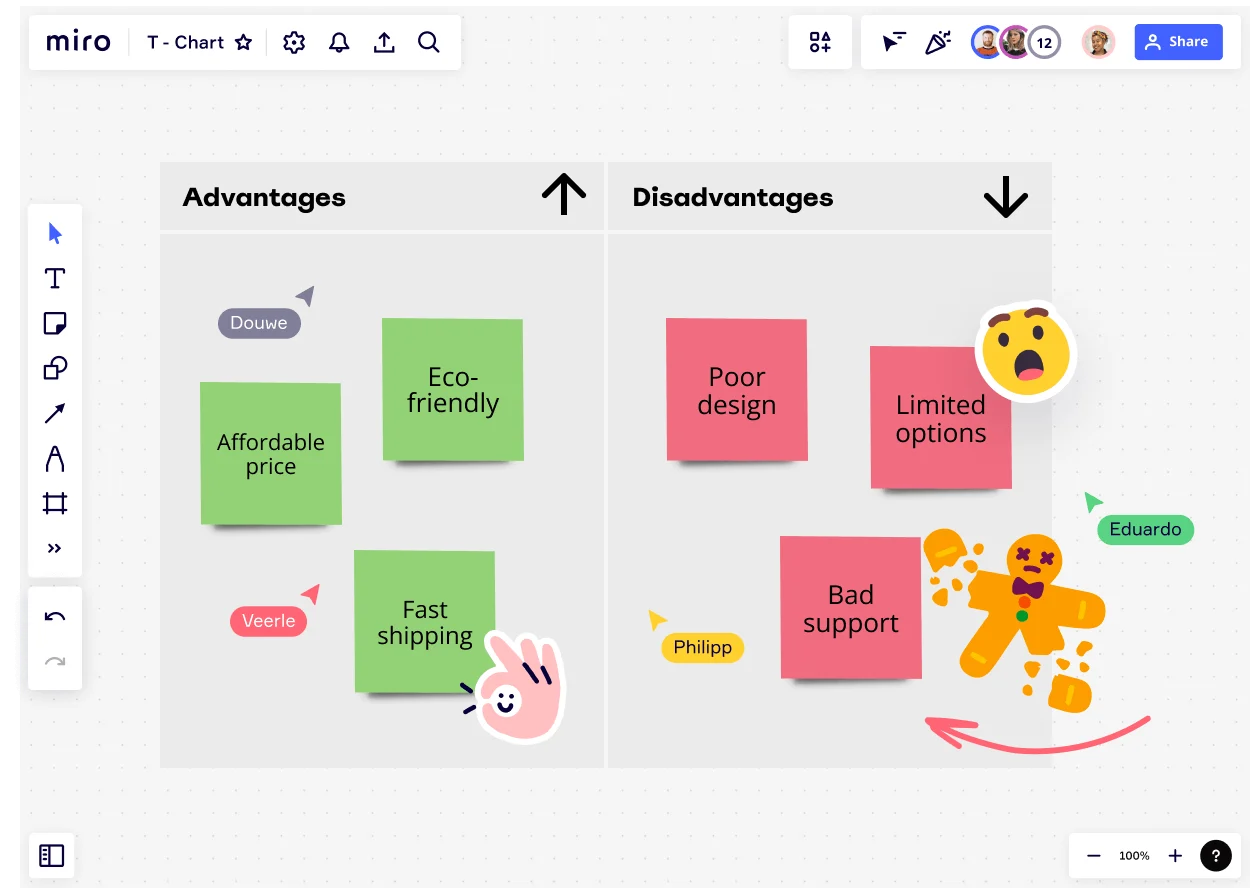
Use Miro's T-chart maker to quickly create, customize, and organize T-charts to compare and contrast different variables. The drag-and-drop UI and editing options make it easy to tailor your online T-charts to your specific needs.

Why Miro is the best T-chart maker
Real-time collaboration
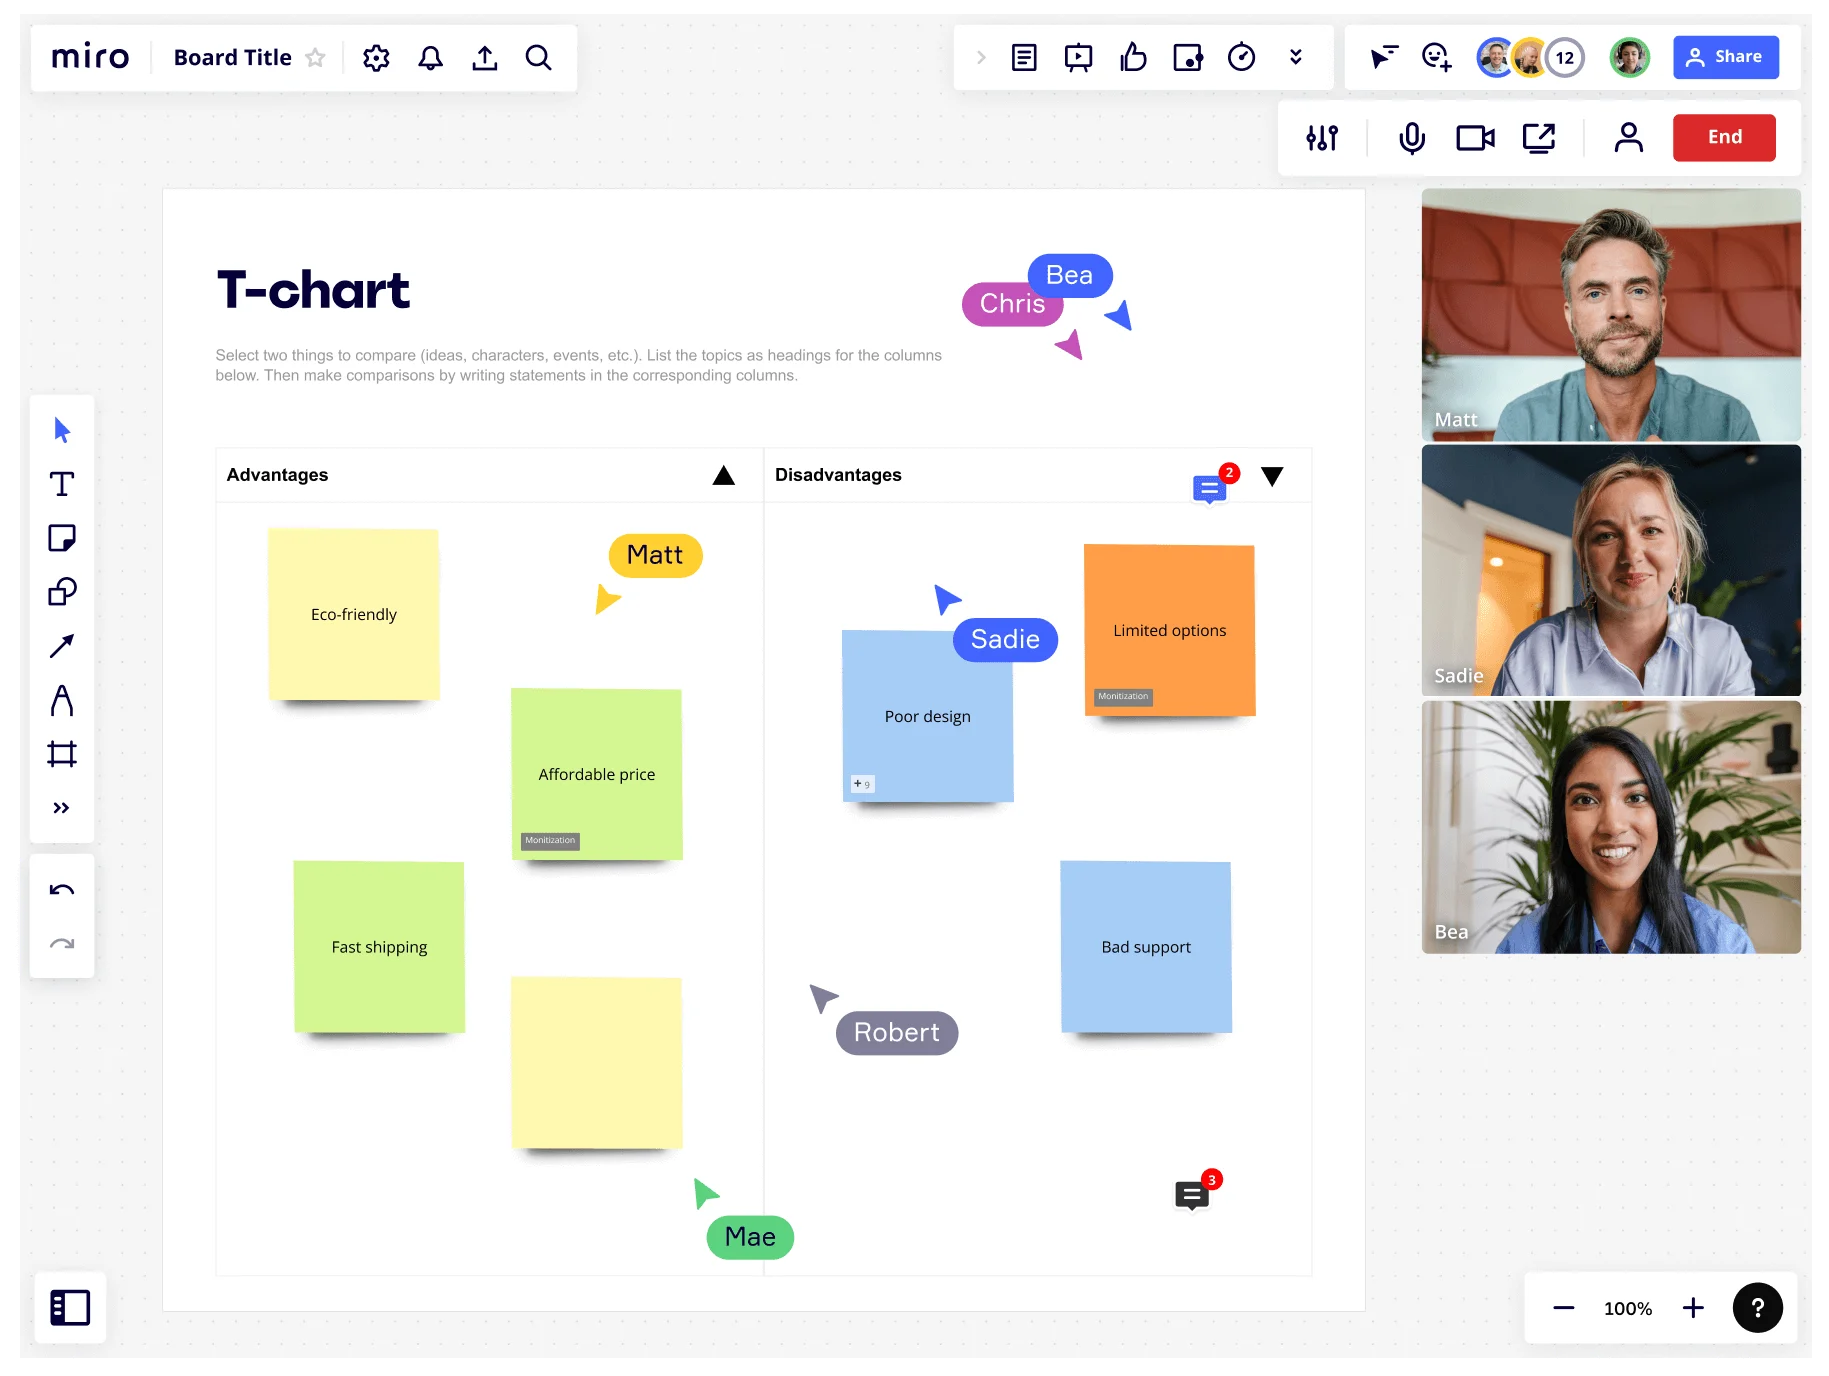
Collaborate in real-time with Miro's T-chart maker to get feedback and make better decisions. Ensure everyone is on the same page and achieve your goals faster.
Intuitive UI
Effortlessly create and customize T-charts with Miro's drag-and-drop UI. Tailor your T-charts to your needs and highlight important information with ease.
Quick T-chart creation
Add structure to your analysis with a T-chart template. Easily make product comparisons, plan projects, or simplify decision-making with customizable templates.
Seamless integrations
Miro's T-chart creator integrates with Google Drive, Dropbox, Trello, and other tools. Import and export data from different sources, ensuring a seamless workflow and saving you time.
Related templates
Make better, faster decisions by organizing and comparing your ideas.
Spot differences between ideas or products and make confident and informed decisions.
Visually understand the relationships, similarities, and differences between groups.
Present relationships between datasets and see contrast right away.
Compare different types of categories and datasets visually.
Focus on important ideas and expand your learning with the KWL Chart template.
How to make a T-chart with Miro

1
Create a new board
Click on the Templates icon and select T-chart.
2
Add content
Label the blank T-chart with categories to compare (e.g., "Product A" and "Product B").
3
Complete your T-chart
Add data by dragging and dropping shapes, text, or images.
4
Share your work
Collaborate in real-time by sharing and receiving feedback directly on the board.
Integrated with your favorite tools
Ideas, inspiration, and intel in full view. Visualize marketing campaigns and client and prospect info to take action, and track tasks and status updates for the team.

Connect Miro to 1OO+ of your favorite collaboration tools
“Miro helps solve one of the major gaps in product design: how to manage tasks across product designers whose projects are in different tools.”
Jane Ashley
Head of Design at DocuSign
T-chart maker FAQs
When selecting a T-chart maker, it's important to look for features that allow you to easily create and customize your charts. You may want to consider tools that offer collaboration features, the ability to input various types of data, and the ability to export or share your charts in different formats.
Yes, Miro offers real-time collaboration that allows multiple users to work on the same chart simultaneously. Collaborators can add, edit, or comment on the chart, making it easier to share ideas and get feedback.
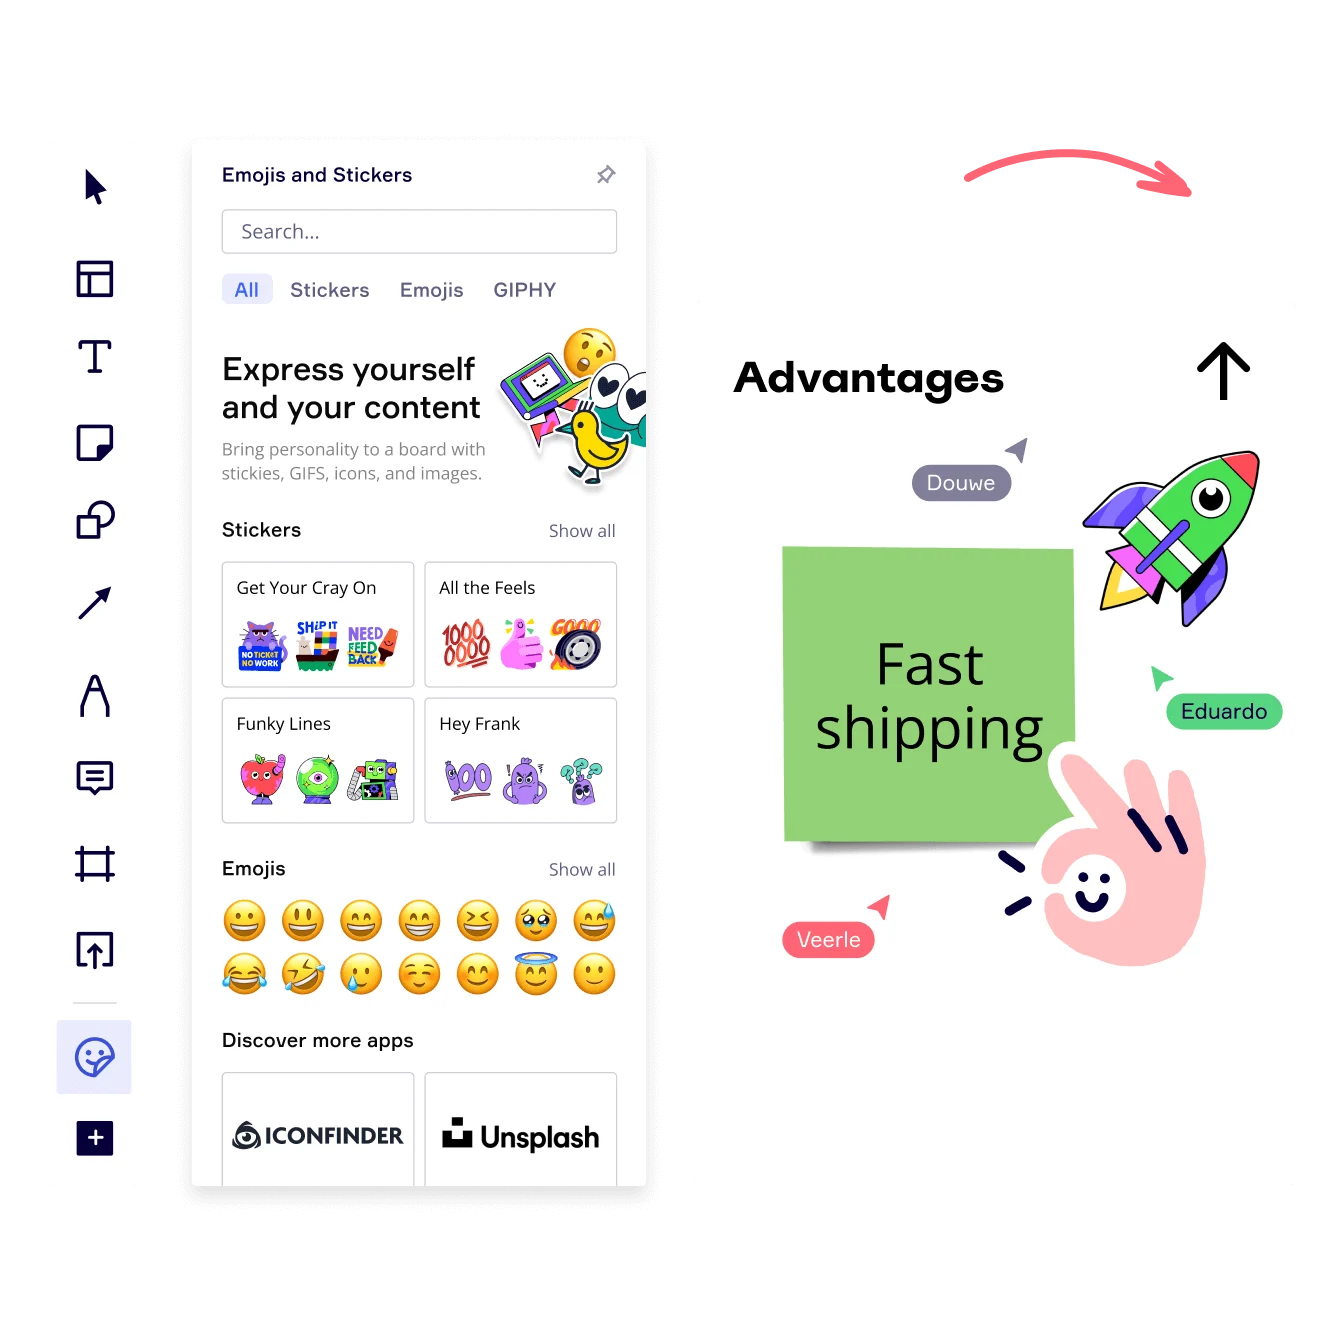
Miro’s T-chart maker lets you input a wide range of data types, such as text, images, tables, and shapes. You can also customize your chart by editing colors, font styles, and other design elements. Miro also allows you to add icons or symbols to your online t-chart, making it easier to visualize your data.
Yes, Miro offers a variety of chart and diagram templates, including flowcharts, mind maps, Venn diagrams, and more.
Read more
Other Miro solutions
Concept Map
Use Miro's concept map to link key concepts to get a big picture overview. Bring structure to concepts through visual collaboration.
Get on board in seconds
Join thousands of teams using Miro to do their best work yet.