T-Chart Template
Make better, faster decisions by organizing and comparing your ideas.
Trusted by 65M+ users and leading companies


About the T-Chart Template
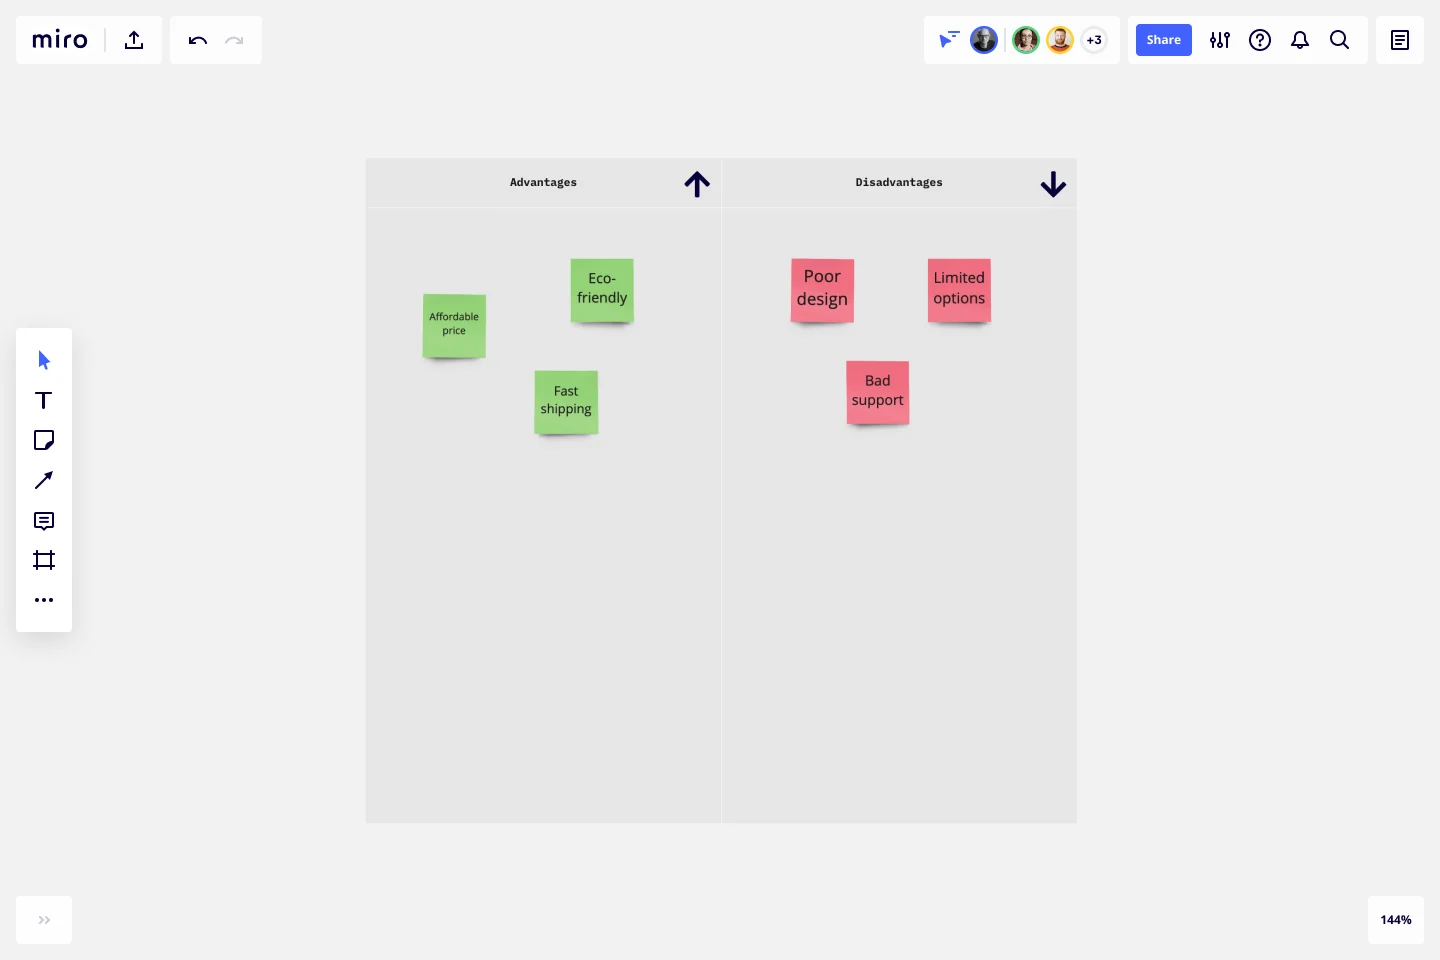
T-Charts can help you compare and contrast two different ideas, group information into different categories, and prove a change through “before” and “after” analysis. Designers and content creators can use T-Charts to turn possibilities into actionable ideas.
What is a T-Chart
T-Charts are a visual organizational tool that can help problem solve and compare aspects of two ideas. You can make comparisons such as pros and cons, facts and opinions, strengths and weaknesses, or big-picture views versus specific details.
When to use a T-Chart
T-Charts are useful for discussing differences and similarities with your team or clients and can help you to reach a decision together. Try testing out different headings or themes depending on the kind of problem you’d like to solve. This can include:
Compare pros and cons
Analyze personality traits
Contrast before and after states
Define cause and effect
Compare then and now states
Build a glossary to keep track of words and definitions
Outline hypothetical solutions and their potential outcomes
T-Charts allow your team to record new insights, spot patterns, and share knowledge. T- Charts often complement statistical data and graphs that can be presented with a formed narrative.
Create your own T-Chart
Making your own T-Charts is easy. Miro is the perfect canvas to create a T-chart and share them. Get started by selecting the T-Chart Template, then take the following steps to make one of your own:
Decide why you need a T-Chart. Are you comparing and contrasting design or content-related ideas to make a decision? Or outlining situations to plan ahead of important events? Either way, thinking ahead can create a strong foundation for your chart.
Invite your team or clients to fill in the blanks. Up to 300 people can collaborate seamlessly on your Miro board. If you need input or feedback to narrow down your ideas, invite others to participate.
Add visuals to strengthen your text, or make a final decision. Adding emojis or photos will bring an emotional layer or more context for your team. You can use imagery as a tool to vote for a preferred option. Imagery can also help bring the chart to life with real-life references.
Get started with this template right now.
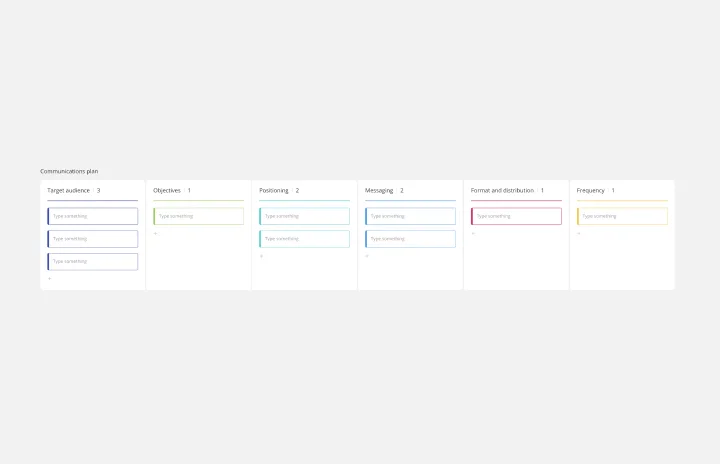
Communications Plan Template
Works best for:
Marketing, Project Management, Project Planning
You saw the opportunity. You developed the product. Now comes an important step: Find your audience and speak to them in a way that’s clear, memorable, and inspiring. You need a communications plan—a strategy for controlling your narrative at every stage of your business—and this template will help you create a good one. No need to build a new strategy every time you have something to communicate. Here, you can simplify the process, streamline your messaging, and empower you to communicate in ways that grow with your business.
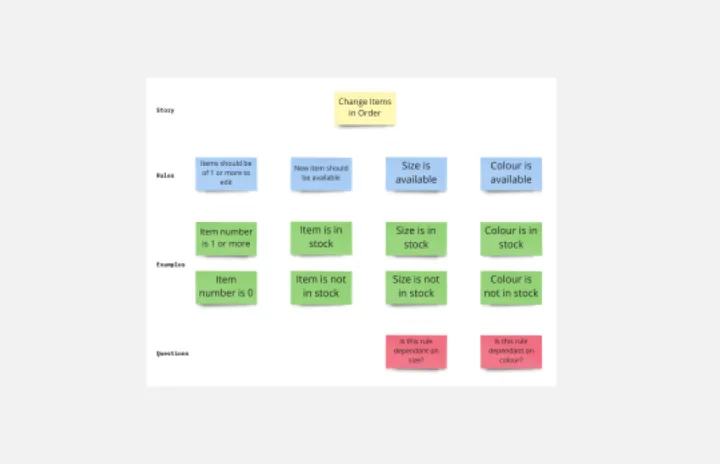
Example Mapping Template
Works best for:
Product Management, Mapping, Diagrams
To update your product in valuable ways—to recognize problem areas, add features, and make needed improvements—you have to walk in your users’ shoes. Example mapping (or user story mapping) can give you that perspective by helping cross-functional teams identify how users behave in different situations. These user stories are ideal for helping organizations form a development plan for Sprint planning or define the minimum amount of features needed to be valuable to customers.
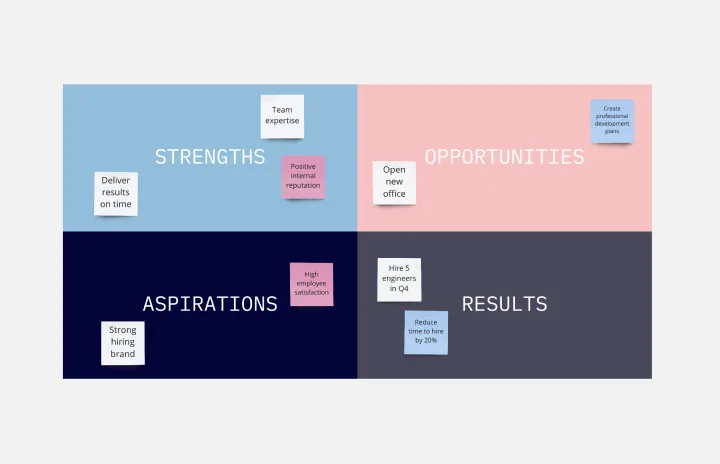
SOAR Analysis Template
Works best for:
Leadership, Decision Making, Strategic Planning
The SOAR Analysis template prompts you to consider your organization’s strengths and potential to create a shared vision of the future. The SOAR Analysis is unique in that it encourages you to focus on the positive rather than solely identifying areas for growth. SOAR stands for Strengths, Opportunities, Aspirations, and Results. To use the template, examine each category through a positive lens. Perform a SOAR Analysis whenever you want to bring people together and encourage action.
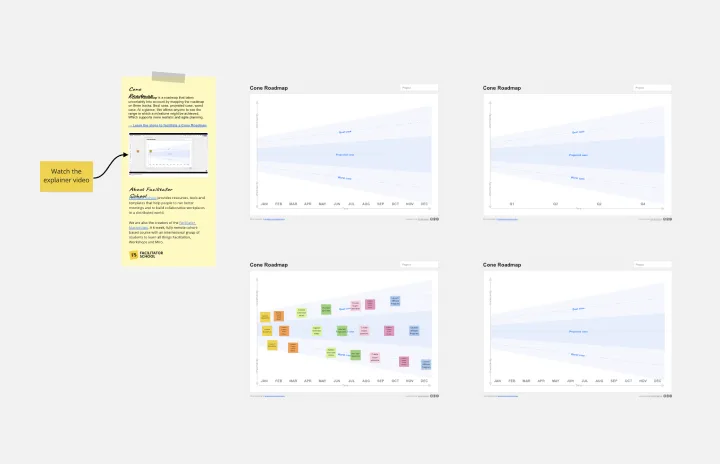
Cone Roadmap
Works best for:
Roadmap, Planning, Mapping
The Cone Roadmap template offers a visual representation of project timelines and dependencies, with a focus on narrowing scope over time. By starting with broad initiatives and gradually refining them into actionable tasks, teams can manage complexity and ensure alignment with strategic goals. This template promotes transparency and adaptability, empowering teams to respond effectively to changing priorities and market dynamics.
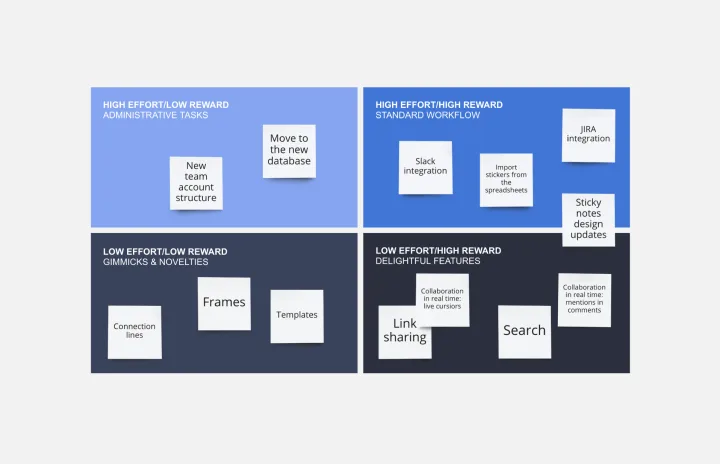
Cost-Benefit Analysis Template
Works best for:
Leadership, Decision Making, Strategic Planning
With so many day-to-day decisions to make—and each one feeling high-stakes—it’s easy for all the choices to weigh a business or organization down. You need a systematic way to analyze the risks and rewards. A cost benefit analysis gives you the clarity you need to make smart decisions. This template will let you conduct a CBA to help your team assess the pros and cons of new projects or business proposals—and ultimately help your company preserve your precious time, money, and social capital.
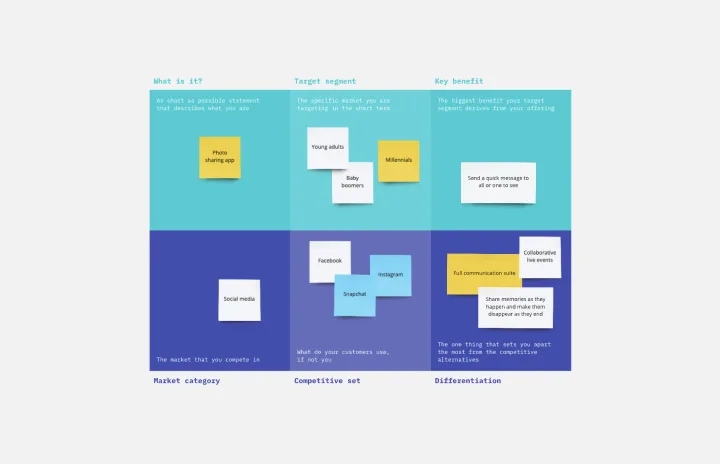
Product Positioning Template
Works best for:
Marketing, Product Management, Desk Research
For better or for worse, your company’s chances for success hinge partially on your market. As such, before you start building products and planning strategies, it’s a good idea to conduct a product positioning exercise. A product positioning exercise is designed to situate your company and your offering within a market. The product positioning template guides you to consider key topics such as defining your product and market category, identifying your target segment and competitors, and understanding your key benefits and differentiation.