3-Circle Venn Diagram
Visually understand the relationships, similarities, and differences between three different groups using our fully customizable 3-circle Venn diagram template.
Trusted by 65M+ users and leading companies


About the 3-Circle Venn Diagram Template
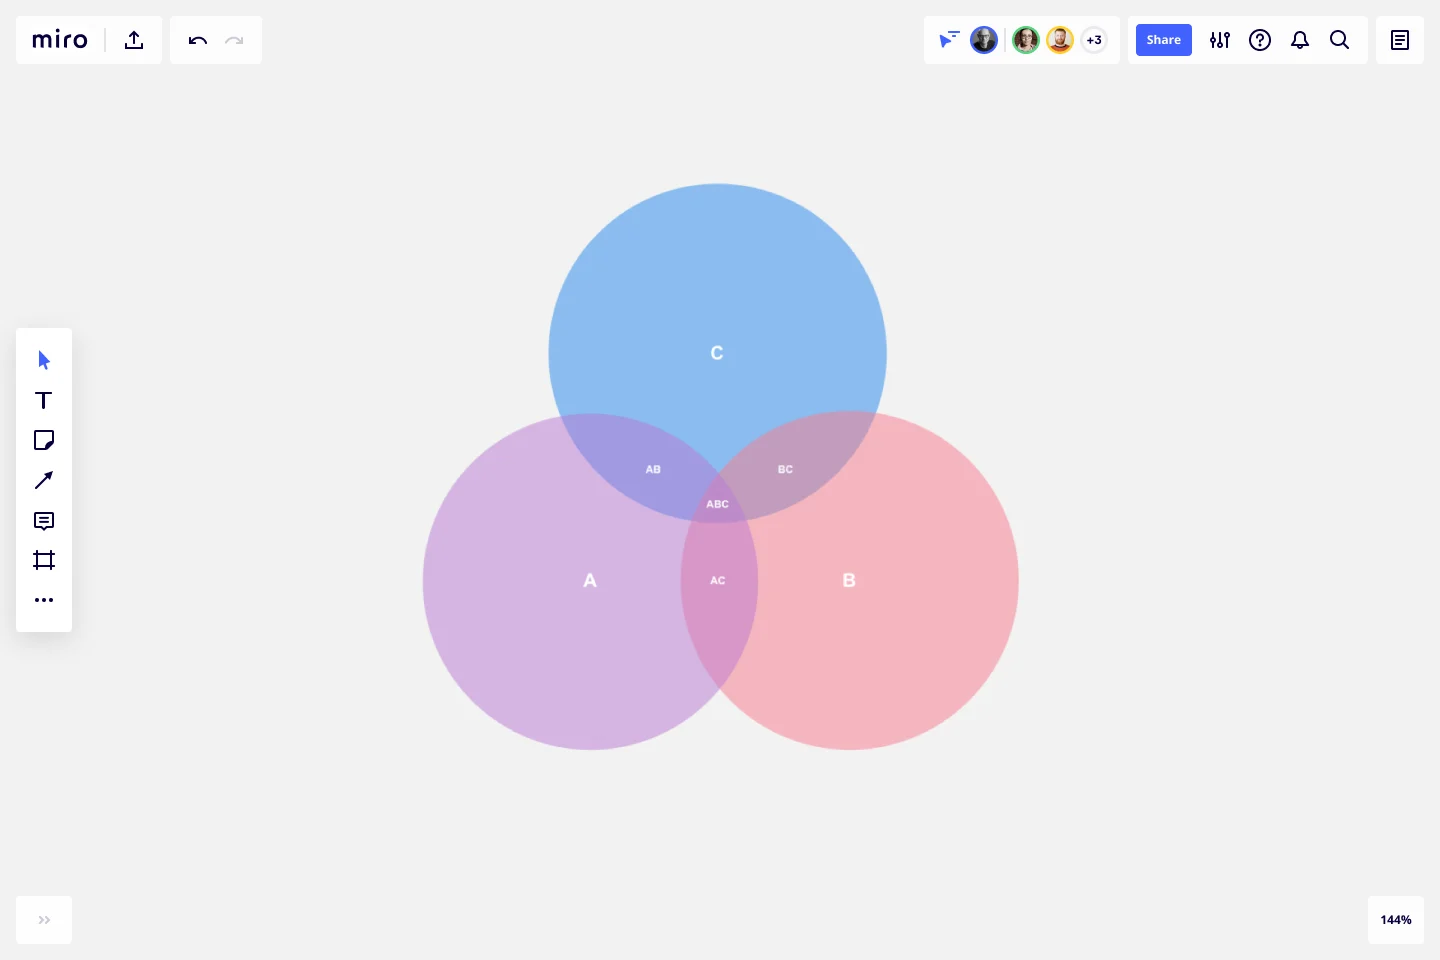
Miro’s 3-circle Venn diagram template is a visual tool for providing a clear and effective way to showcase relationships between datasets. By overlapping two or more circles, Venn diagrams are great for visualizing the differences and similarities between multiple datasets.
It’s therefore no surprise that they’re useful for assessing probability in statistics, mathematics, and engineering. Because they can help break down complex ideas into visually appealing and digestible ways, Venn diagrams are especially useful for brainstorming and problem-solving.
Using the 3-circle Venn diagram template saves you time from having to build one from scratch. We’ll walk you through how to make the most of it.
How to use the 3-circle Venn diagram template
To get started, click on the blue “use template” button to open the 3-circle Venn diagram template in Miro. When you’re ready, follow these steps:
1. Add data to each circle
As its name implies, the 3-circle Venn diagram template comes with three circles ready for you to fill in. Identify what groups you want to compare in your Venn diagram and assign them to each circle: A, B, and C. In each circle, list the items that belong to that group.
For example, let’s say you’re comparing the qualities of an apple, a pear, and an orange. You could use circle A to list an apple’s qualities, circle B to list a pear’s qualities, and circle C to list an orange’s.
2. Identify the differences
Let’s say you’re comparing apples, pears, and oranges based on their color. You could write “red” in circle A, “green” in circle B, and “orange” in circle C. Since each fruit has a unique color, you’ll notice that none of them are part of overlapping circles. These are your differences. Double-click the text boxes in each circle to replace the pre-written text with your own.
3. Identify the similarities
Identify what all three fruits have in common and make sure that you’ve placed those qualities in the overlapping section of the circle. For example, you might write “contains seeds” as a similarity. Double-click on the text box in the overlapping section to edit the pre-written text.
4. Customize the template
Once you’ve added all the information you need to compare your three objects or concepts, it’s time to customize the look and feel. It’s easy to change up shapes, sizes, and font types in the 3-circle Venn diagram template — whether you want to align your diagram with brand colors, present your information more clearly, or simply make it more visually appealing.
Want to try creating your Venn diagram from scratch? Explore our Venn diagram tool to learn more.
Benefits of using Miro’s 3-circle Venn diagram template
Miro makes it easy to create Venn diagrams online with your team and discuss them in real time or asynchronously. It only takes seconds to add the 3-circle Venn diagram template, saving you time from having to create one from scratch while allowing you to dive straight into the customization process. Easily edit text, drag and drop your own images, and tag your teammates in comments.
With an infinite canvas, you can also add as many sticky notes, shapes, and images as you need to add context to your Venn diagram. On top of that, Miro integrates with over 130 apps, including project management tools like Jira and Trello and entire suites like Microsoft 365 and Google Workspace. That means you get to use the 3-circle Venn diagram template alongside other tools you already love.
Is Miro’s 3-circle Venn diagram template free?
Yes, Miro’s 3-circle Venn diagram template is free and customizable. Simply click on “use template” to open the template in Miro and start filling it in, editing the look and feel, and sharing it with teammates when you’re ready.
When should I use Miro’s 3-circle Venn diagram template?
One of Venn diagrams' most well-known use cases is determining probability — which is especially common in fields like data analytics, engineering, and other scientific fields. Speaking of science, they’re helpful for visual problem-solving complex algorithms in the world of software and computer science. That said, Venn diagrams are also popular in the arts, such as studying the similarities and differences between various languages and language groups. In other words, you can use Venn diagrams anytime you have to compare two or more groups.
What are the key components of a Venn diagram?
There are six key components: sets, union, intersection, symmetric difference, complement, and relative complement. Sets refer to the data you’re comparing, such as numbers, ideas, or even objects. Union refers to everything that we’re considering in the Venn diagram — also known as the universal set. The intersection refers to what the datasets have in common — where the circles overlap. The symmetric difference includes everything except the intersection. The complement refers to everything that doesn’t belong to a particular set, while the relative complement refers to everything that’s in one set but not another.
Get started with this template right now.
Opportunity Canvas Template
Works best for:
Leadership, Decision Making, Strategic Planning
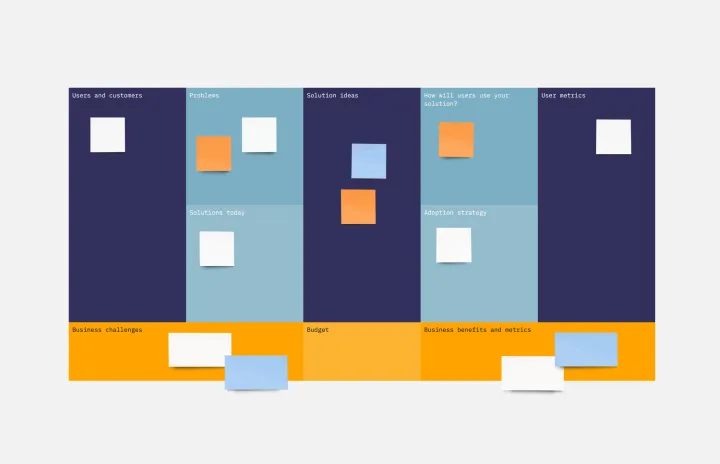
Features and capabilities — they make or break a product, which is why companies spend so much time and effort focusing on them. Sound like you? Try it with an Opportunity Canvas. This streamlined one-pager gives you and your team the power to improve your product by exploring the use cases, potential setbacks, strategies, challenges, and metrics. An Opportunity Canvas is ideal if you’ve already built a product, because you don’t need to consider the operational or revenue model.
Mood Board Template
Works best for:
Design, Brainstorming, Ideation
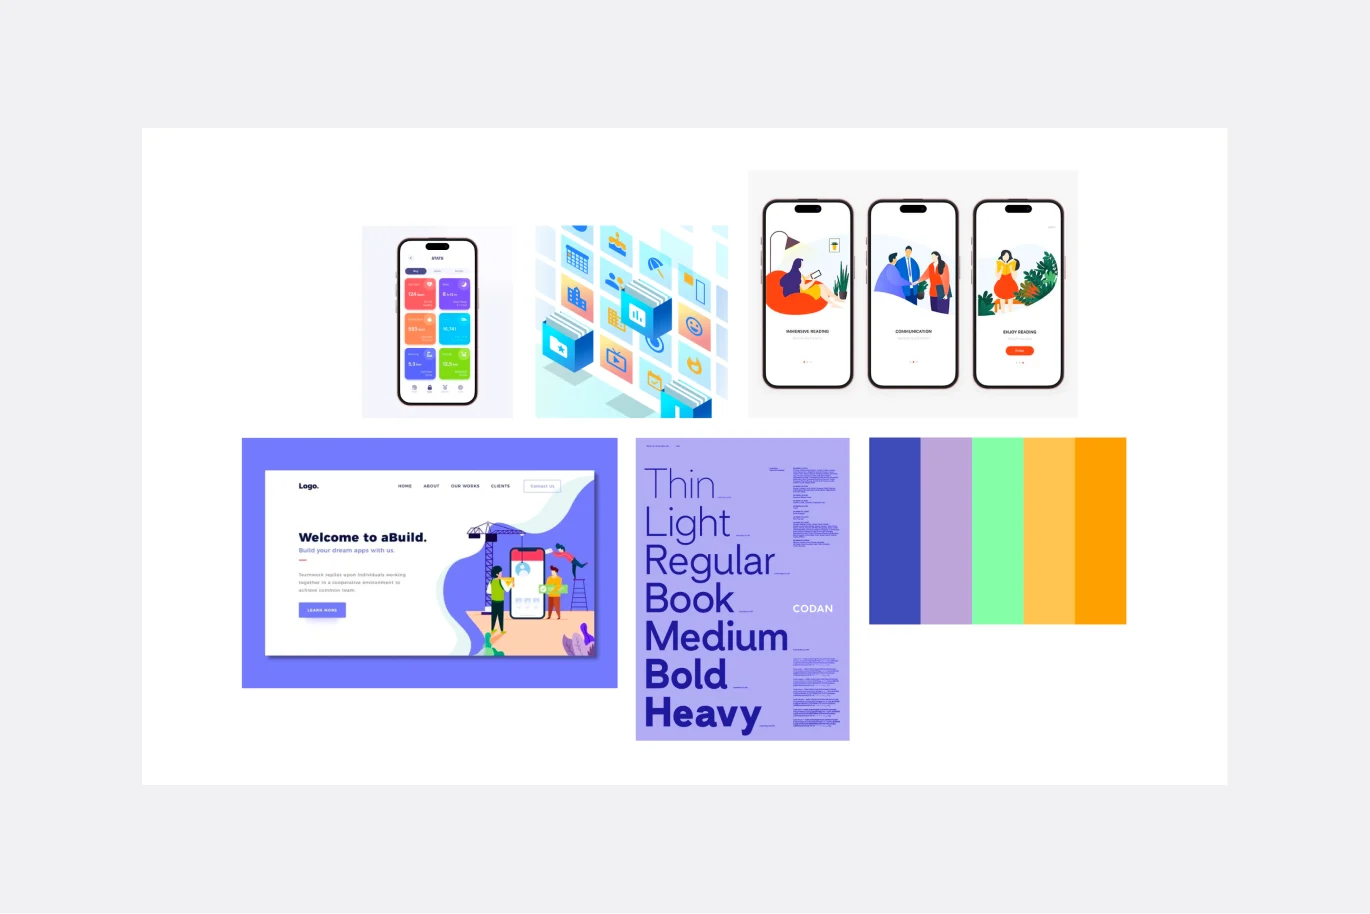
When you’re kicking off a creative project, it’s sometimes important to communicate the mood you’re trying to evoke — but it’s so hard to do it with words. So create a mood board and use images, color palettes, textures, and typography. Mood boards are also perfect for gathering inspiration and sketching out and pitching ideas, and they’re not just for designers — your content writers, sales teams, and product teams can use them too, and this template makes it easy for all of you to get started.
Prioritized Product Roadmap
Works best for:
Roadmap, Mapping, Planning
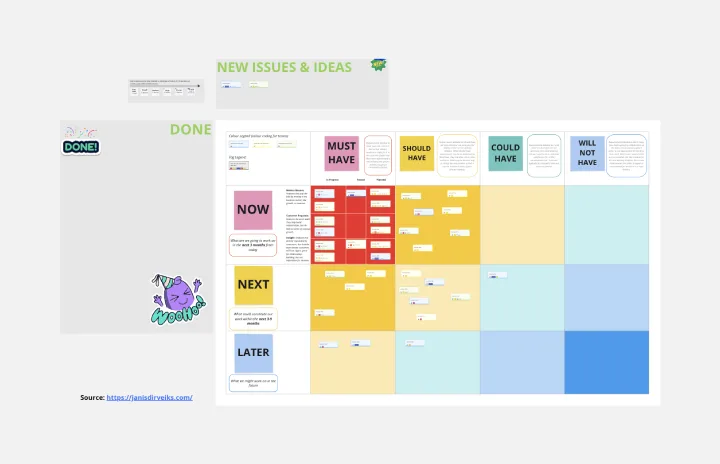
The Prioritized Product Roadmap template enables teams to focus on delivering the most valuable features to customers. By prioritizing initiatives based on impact and effort, teams can maximize the return on investment and drive business value. This template fosters collaboration and alignment, ensuring that development efforts are aligned with strategic objectives and customer needs.
Reverse Brainstorming Template
Works best for:
Ideation, Brainstorming, Team Meetings
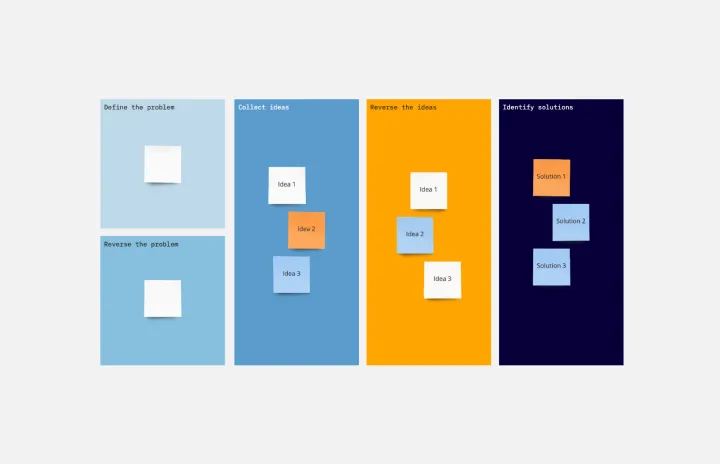
Reverse brainstorming is a technique that prompts a group to think of problems, rather than solutions. Because we naturally think of problems, it’s a great way to get a group to anticipate problems that may occur during a project. To engage in reverse brainstorming, start by identifying the problem, and then think of things that might exacerbate it. Ask your team to generate ideas around ways in which the problem could get worse. Reverse the problems into solutions again, and then evaluate your ideas.
Bull's Eye Diagram Template
Works best for:
Diagrams, Project Management, Prioritization
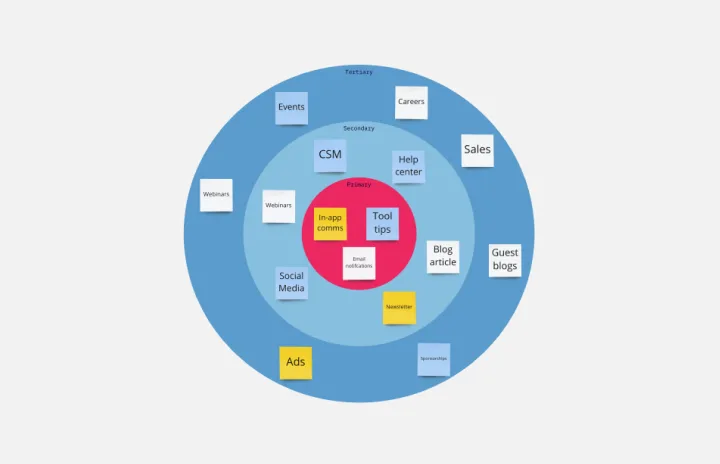
When you’re a growing organization, every decision can feel like it has make-or-break consequences—which can lead to decision paralysis, an inability to prioritize, inefficient meetings, and even low morale. If that sounds like you, put a Bull’s Eye Diagram to work. True to its name, a Bull’s Eye Diagram uses a model of concentric circles to help companies establish priorities, make critical decisions, or discuss how to remove or overcome obstacles.
Startup Canvas Template
Works best for:
Leadership, Documentation, Strategic Planning
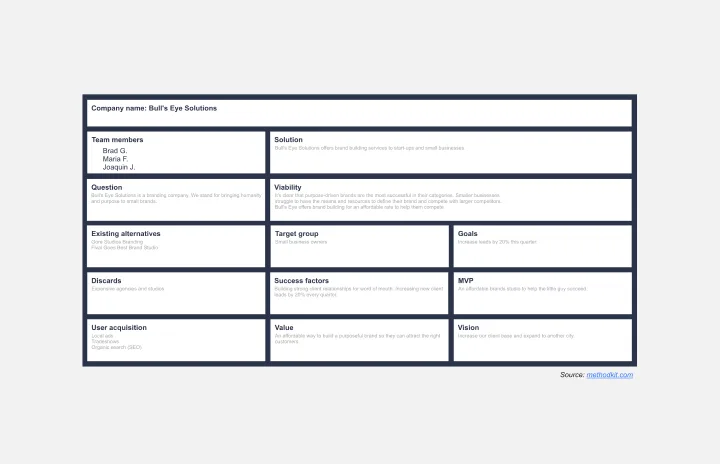
A Startup Canvas helps founders express and map out a new business idea in a less formal format than a traditional business plan. Startup Canvases are a useful visual map for founders who want to judge their new business idea’s strengths and weaknesses. This Canvas can be used as a framework to quickly articulate your business idea’s value proposition, problem, solution, market, team, marketing channels, customer segment, external risks, and Key Performance Indicators. By articulating factors like success, viability, vision, and value to the customer, founders can make a concise case for why a new product or service should exist and get funded.