Cross Functional Flowchart
Plan for any undesirable actions, outcomes, or behaviors that occur in the workplace. Clarify different team responsibilities and identify bottlenecks using a Cross-Functional flowchart.
Trusted by 65M+ users and leading companies


About the Cross-Functional Flowchart
Cross-functional flowcharts (also known as a “swim lane diagram” or “cross-functional process map” ) can help you visualize business relationships and end-to-end project contributions. These elements that depend on each other can include the relationship between functions and stakeholders (such as departments and clients) or project phases and milestones.
The map format allows you to make your business processes or project phases more transparent with added layers of detail and structure.
Keep reading to learn more about cross-functional flowcharts.
What is a Cross-Functional flowchart?
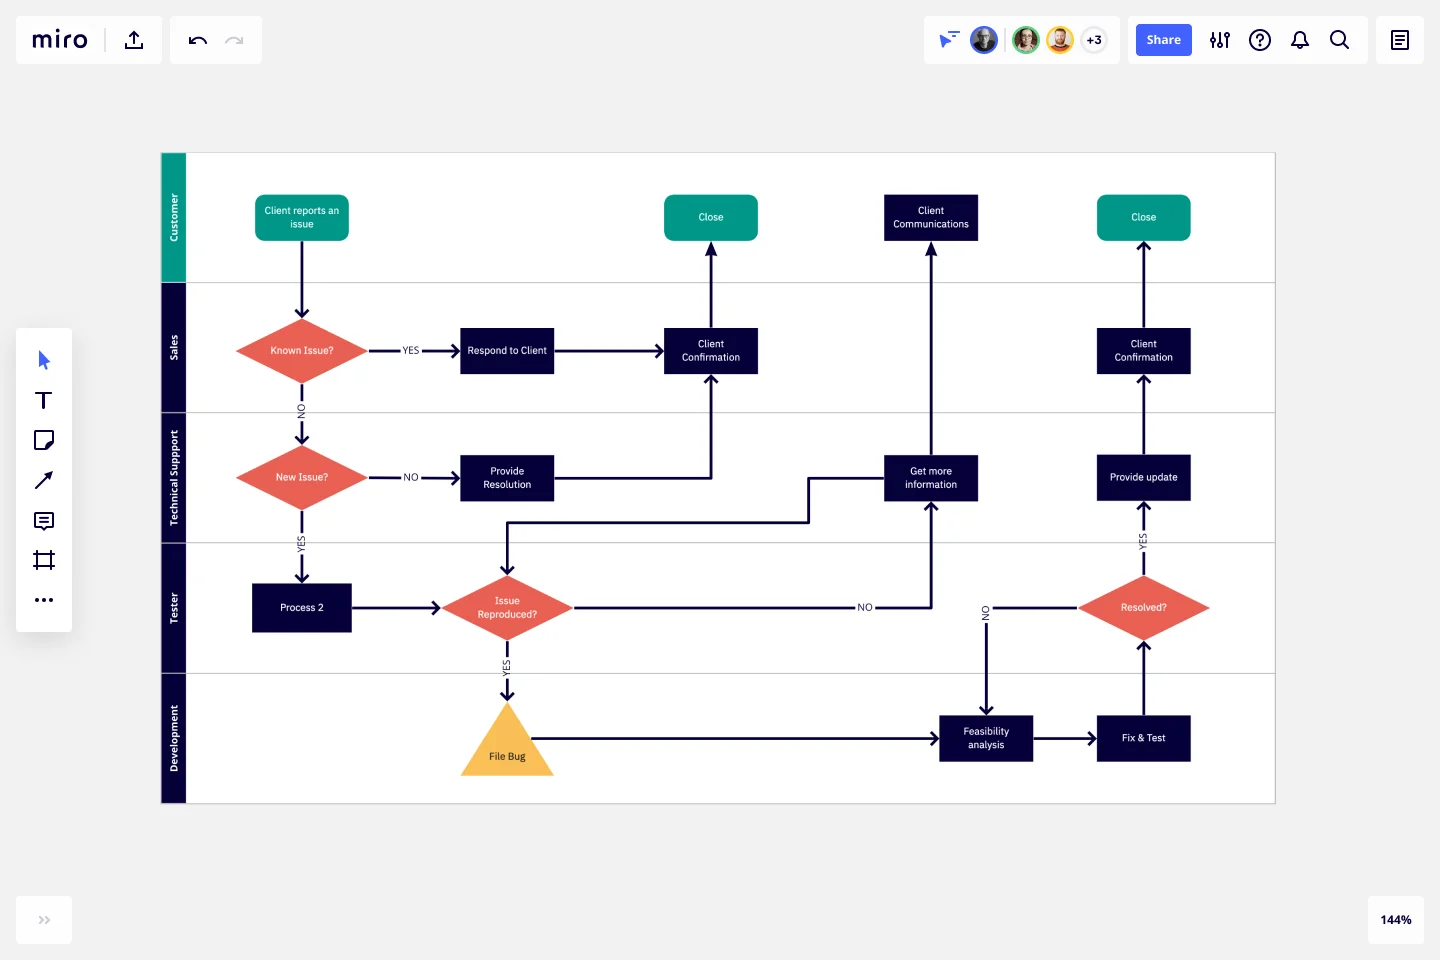
A cross-functional flowchart shows how people from different teams contribute to, and complete, a business process or project.
The lanes in the chart can help separate and clarify which department, employee, or person outside of the business contributes to a business or project.
Each person (such as a customer, client, or representative from a specific function) who contributes to the big-picture process is assigned a lane. That assigned area outlines all the activities they are responsible for moving forward to the finish line.
When to use a Cross-Functional flowchart
Cross-functional flowcharts can be used to improve your team and organizational processes. These changes can include the need to work out what factors create inefficiencies and address delays that impact both internal and external stakeholders.
A cross-functional flowchart can also help different teams or departments better understand each other’s responsibilities and capabilities. These details are especially useful when people haven’t worked together before or struggle to understand what different teams do on a day-to-day basis. Consistently collaborating with an online flowchart creates greater transparency and alignment.
Create your own Cross-Functional flowchart
Making your own cross-functional flowchart is easy. Miro’s virtual collaboration platform is the perfect flowchart maker and canvas for sharing them. Get started by selecting the Cross-Functional Flowchart Template, then take the following steps to make one of your own.
1. Decide what your lanes are.
Decide what divisions (functions) or identities (internal or external stakeholders) need representation on the flow chart.
2. Define what the start of your process is.
What’s the first action that triggers a series of tasks or interactions? Maybe it’s a client confirmation or a customer request. Each division will have a different starting point, but you’ll see that there may be points in the journey or interaction where functions or individuals coincidentally meet (or need to coordinate and communicate, for a smoother process to roll out).
3. Keep adding steps to your process until you get to the last step or endpoint.
What does the flow of information look like from start to finish? What decisions need to be made? Ask yourself and your team these questions as you map out each situation. Try to convert your quick sketches to sticky notes, shapes, and connecting lines that work together to create a logical flow chart.
4. Update your flow chart as needed—and use it alongside other process-based templates.
Cross-functional process maps were designed to work alongside – or be connected to – other templates, such as a product roadmap or stakeholder mapping tool. Rally your teammates, stakeholders, and leadership team around a people-first vision by helping them see the bigger picture alongside the all-important details.
Get started with this template right now.
Prototype Template
Works best for:
UX Design, Design Thinking
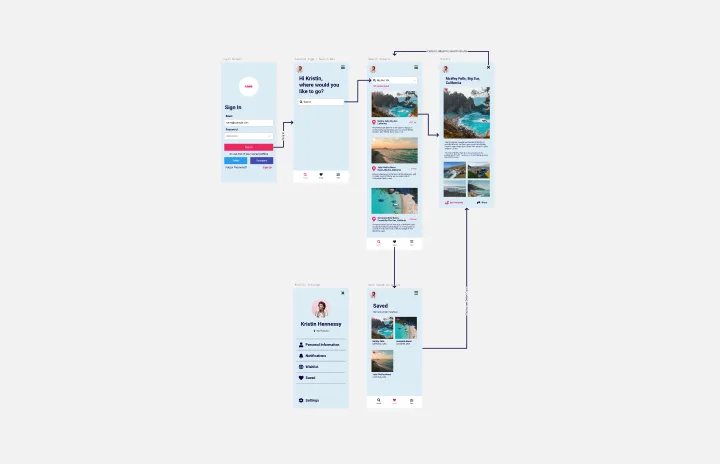
A prototype is a live mockup of your product that defines the product’s structure, user flow, and navigational details (such as buttons and menus) without committing to final details like visual design. Prototyping allows you to simulate how a user might experience your product or service, map out user contexts and task flows, create scenarios to understand personas, and collect feedback on your product. Using a prototype helps you save money by locating roadblocks early in the process. Prototypes can vary, but they generally contain a series of screens or artboards connected by arrows or links.
Project Status Report Template
Works best for:
Project Management, Documentation, Project Planning
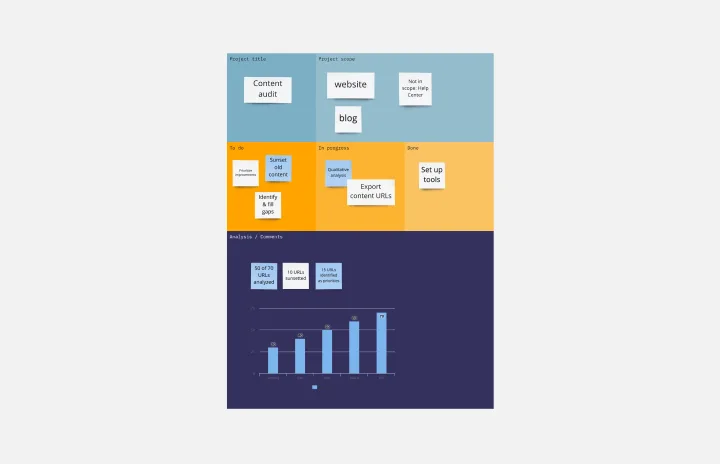
When a project is in motion, the project manager must keep clients and shareholders updated on the project’s progress. Rather than waste time with constant meetings, leaders can send out weekly or daily project status reports to keep everyone informed. You can use the Project Status Report Template to streamline the report creation and distribution process.
Low-fidelity Wireframes Template
Works best for:
Desk Research, Product Management, Wireframes
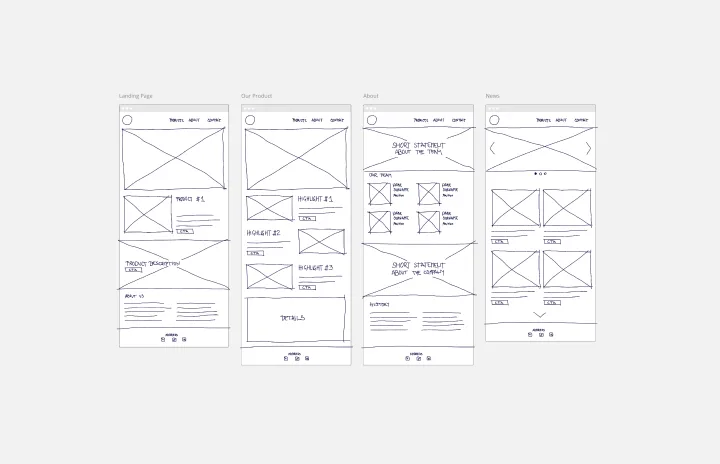
When you’re designing a site or building an app, the early stages should be BIG — seeing the big picture and communicating the big idea. Low fidelity wireframes empower you to see it and do it. These rough layouts (think of them as the digital version of a sketch on a napkin) help your teams and project stakeholders quickly determine if a design meeting meets your users’ needs. Our template lets you easily use wireframes during meetings or workshops, presentations, and critique sessions.
If then Flowchart Template
Works best for:
Flowcharts
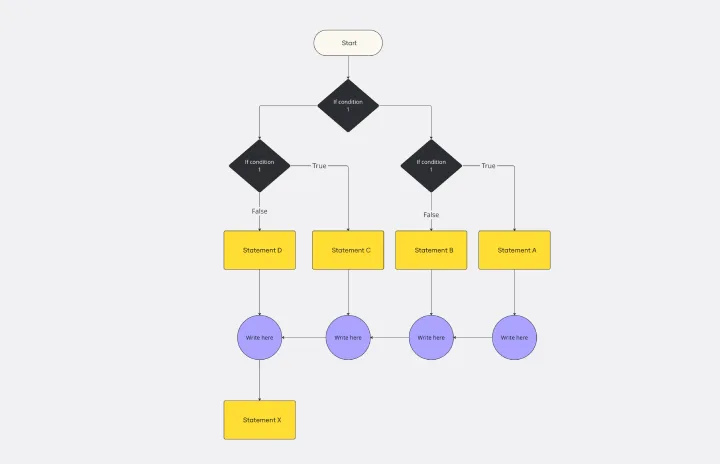
The If-then Flowchart Template is a useful tool for decision-making. It visually maps out conditional steps and outcomes, allowing users to anticipate potential challenges and opportunities. This foresight is valuable for making informed decisions, especially for those with significant implications. Whether for business strategy, project management, or personal decision-making, the template helps navigate complex decision trees with confidence.
Creative Brief Template
Works best for:
Design, Marketing, Desk Research
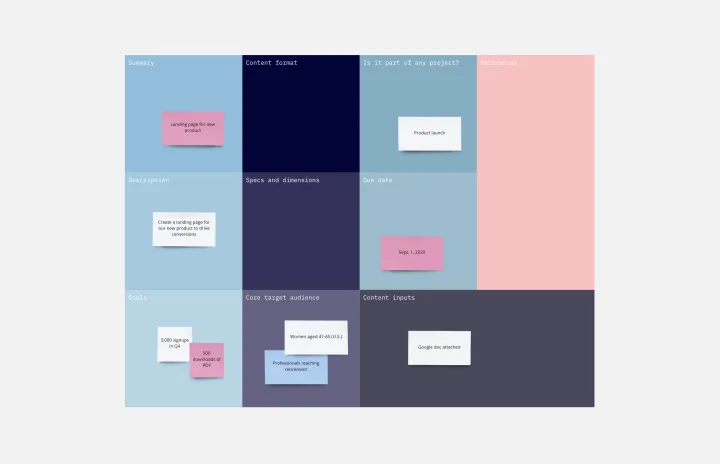
Even creative thinkers (or maybe especially creative thinkers) need clear guidelines to push their ideas in productive, usable directions. And a good creative lays down those guidelines, with information that includes target audience, goals, timeline, and budget, as well as the scope and specifications of the project itself. The foundation of any marketing or advertising campaign, a creative brief is the first step in building websites, videos, ads, banners, and much more. The brief is generally prepared before kicking off a project, and this template will make it easy.
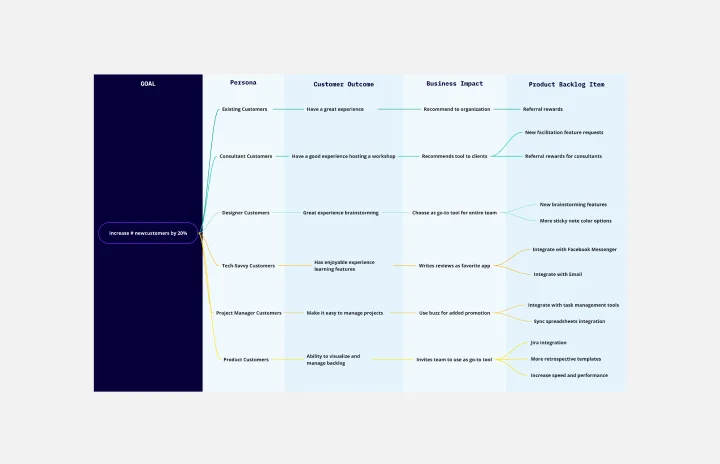
Outcome Mapping Template
Works best for:
Diagrams, Mapping, Project Management
Use Miro’s outcome mapping template to improve your operational efficiency. Outcome mapping will help you visualize all the possible strategic outcomes for your upcoming project, allowing you to see into the black box to identify any potential challenges along the way.