Project Status Report Template
Compare the current state of your project against its projected plan. Stay focused on project goals and keep everyone up to date.
Trusted by 65M+ users and leading companies


About the Project Status Report Template
A project status report is a timely update on the progress of your project. It compares the current state of your project against the initial project plan.
It’s also likely to be read by an executive-level audience controlling budgets and governance, which can help you keep the report focused on critical issues.
This template is only a starting point. You and your team can change which completion metrics are essential or more important. You can customize the template name according to specific accomplishments in a particular period, like “weekly activity report” or “quarterly activity report.”
What is a project status report?
A project status report is a concise document detailing project progress during a specific period. Typically, these reports are sent out daily, weekly, or monthly, depending on the audience.
A project status report keeps key stakeholders informed and aligned on what is happening and why. You can start writing this document on your own, then include your teammates as well to produce a timely and relevant report.
Project reports typically include:
Project basics: Name, lead project manager, date.
Project progress: A basic summary of project progress.
Overall project health: Updates on project scope, budget status, and project schedule.
Project milestones: Actual progress toward reaching milestones.
Project timelines: Estimated timeline vs. the actual timeline.
Action items or project deliverables: Updates on ongoing and upcoming tasks.
Project risks: Incomplete tasks, delays, and other problems.
Remember that your daily or weekly project status reports should be created within the context of your previous report.
When to use a project status report?
Teams and project managers can use weekly status reports to update project stakeholders on project details, such as project schedule, overall status, budget, and deliverables.
A weekly report allows teams to prove they’re proactive and keeps them focused on project goals. They also update stakeholders on the project’s current status, which helps with budgeting and governance.
Apart from summarizing project progress, a status report also details project health, risks and solutions, and action items and helps eliminate redundancies. All of this helps avoid constant update meetings.
Create your own project status report
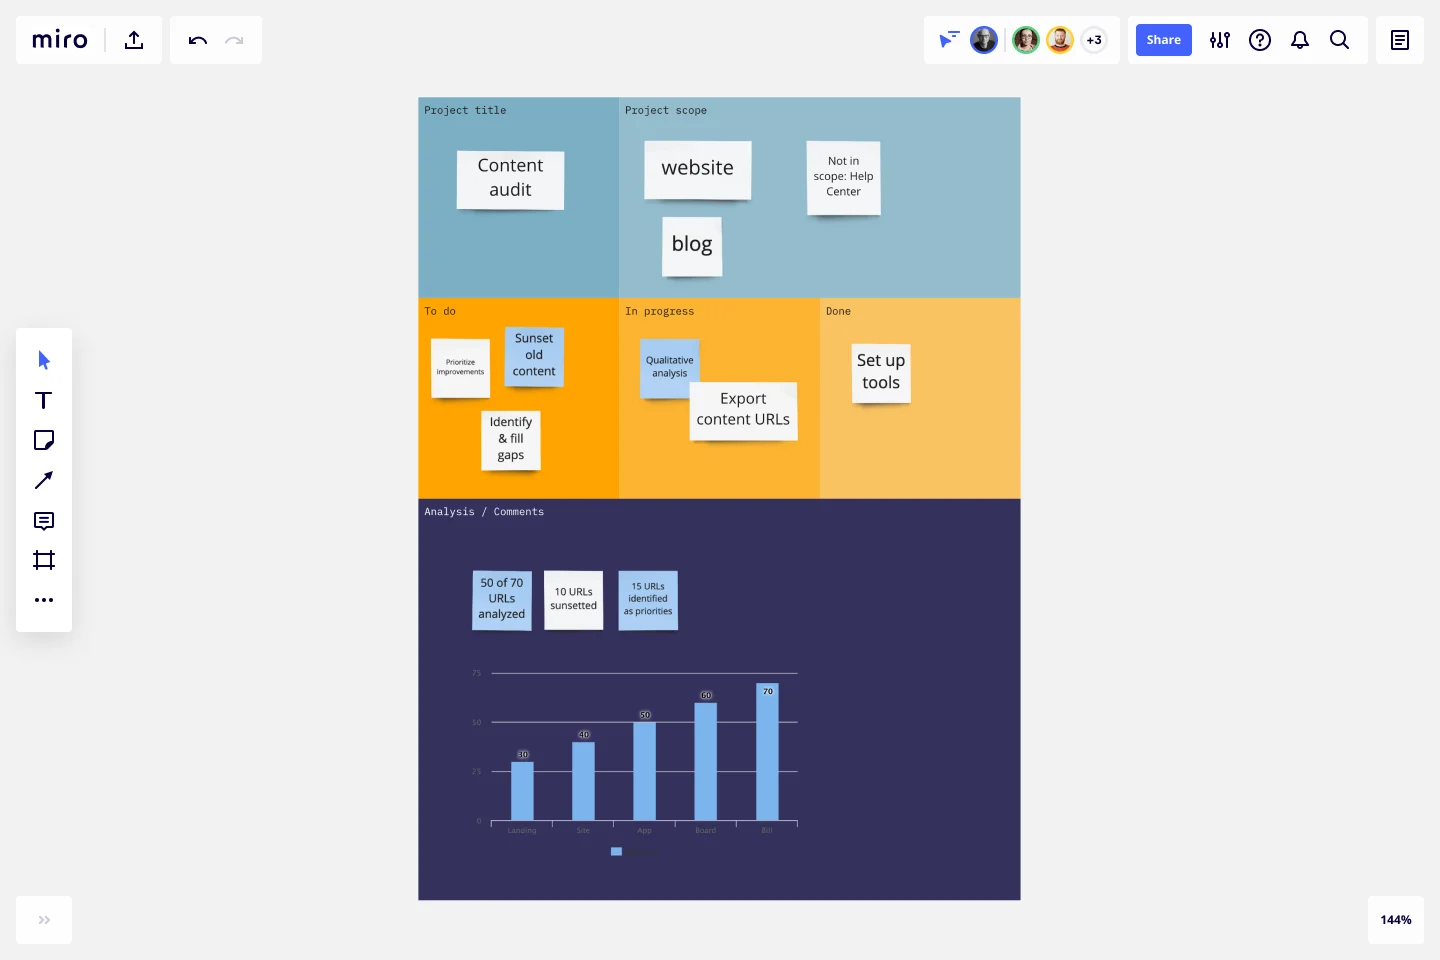
Making your own project status reports is easy. Miro is the perfect tool to create and share reports with your team. Get started by selecting the Project Status Report Template, then take the following steps to make one of your own:
Customize the template: Add titles to report sections, use color-coding, and change the arrangement of columns to suit your needs. Add relevant project details under each column.
Decide Key Performance Indicators (KPIs): If your boss or teammates ask you what success looks like, how would you measure a positive outcome? Add project goals to your report.
Collect data: Collect data related to your KPIs. It must be relevant to team members, stakeholders, and clients. Project management software can help collect accurate data. Adding analytical data makes it easier to judge progress.
Relay project activities and outputs: Use any data included in your report to tell a compelling story grounded in concrete facts. Inform readers about how team decisions and performance impacted project progress.
Include issues: No project is perfect, and you’ll likely run into some setbacks during the reporting period. Be proud and highlight what you did to fix the unexpected. Point out how you took charge and recommended what to do if something could potentially go wrong, too.
Collaborate effectively: Invite team members and stakeholders to view the report with a simple link on Miro. Collect feedback via the comments and implement them in real-time. Invite clients to view the final draft and add suggestions as well.
Get started with this template right now.
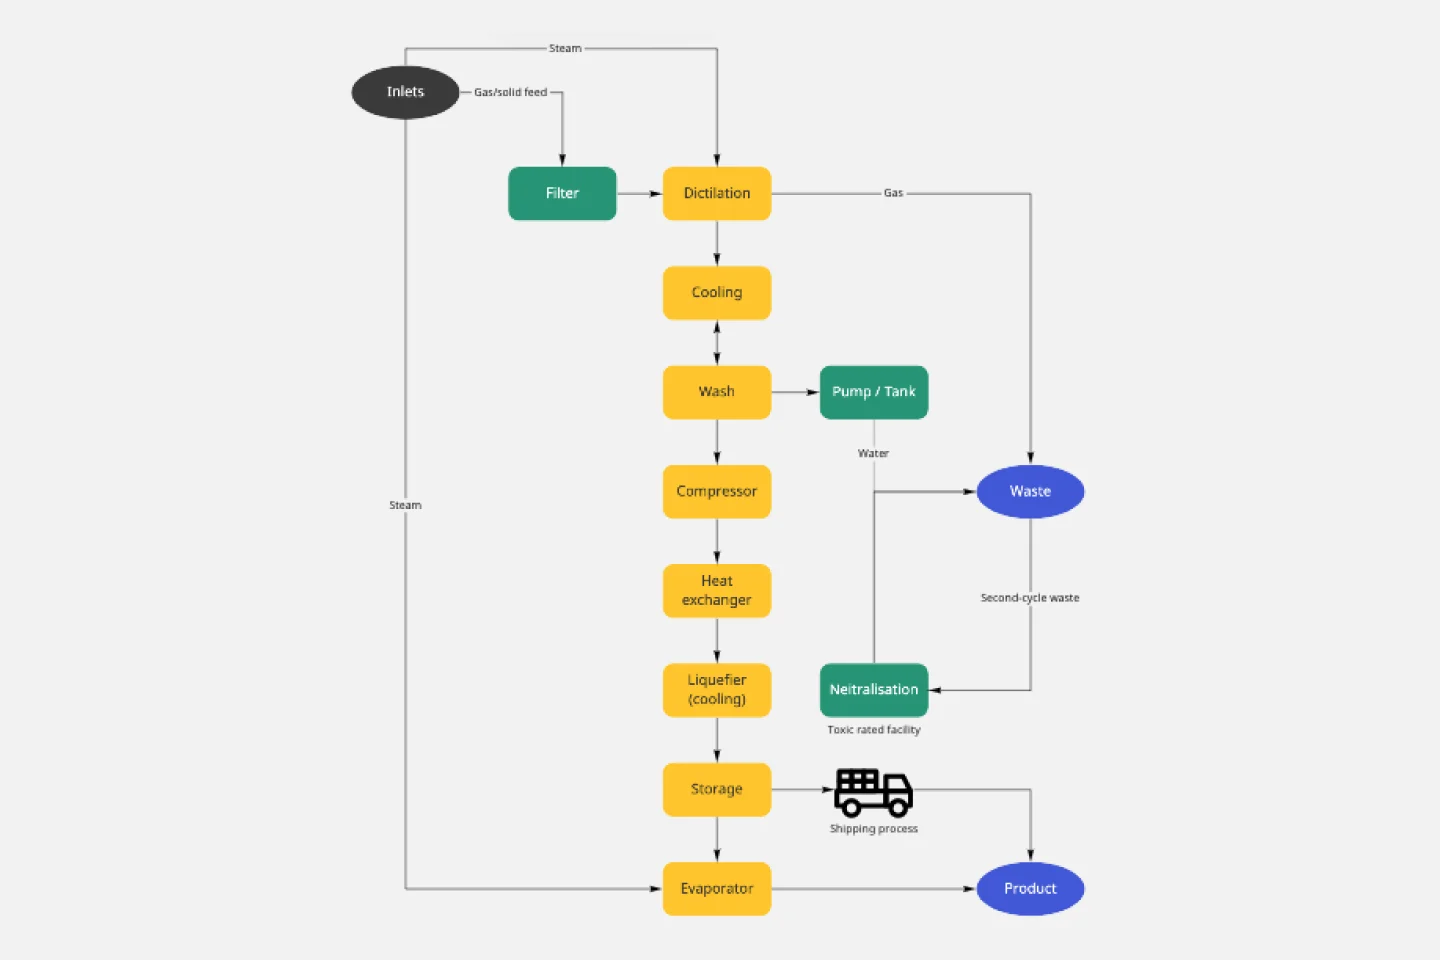
Block Diagram Template
Works best for:
Mapping, Software Development, Diagrams
Use this template to illustrate technical systems. Blocks represent important objects in the system, and arrows demonstrate how the objects relate to each other. Perfect for engineers, workflow managers, or anyone trying to build a better process.
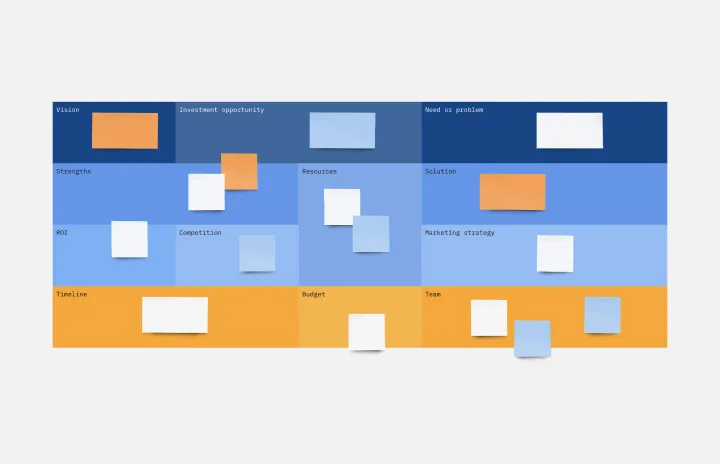
Executive Summary Template
Works best for:
Leadership, Project Management, Documentation
Pique their curiosity. Get them excited. Inspire them to keep reading, diving further into your proposal details. That’s what a good executive summary has the power to do—and why it’s a crucial opening statement for business plans, project plans, investment proposals, and more. Use this template to create an executive summary that starts building belief, by answering high-level questions that include: What is your project? What are the goals? How will you bring your skills and resources to the project? And who can expect to benefit?
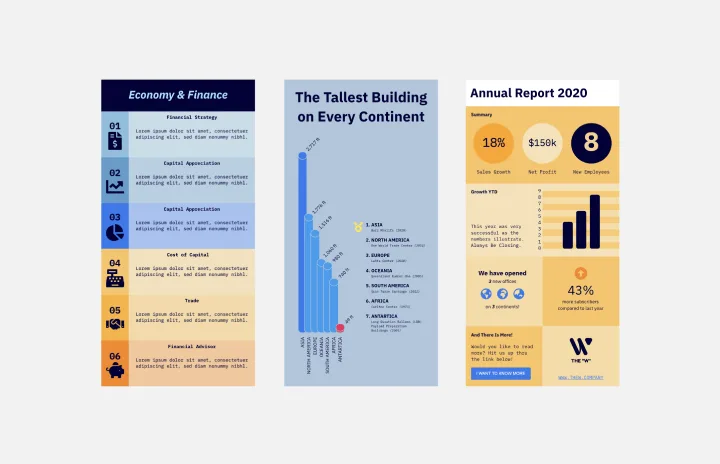
Infographic Template
Works best for:
Marketing, Desk Research, Documentation
As we bet you’ve experienced, data can get pretty dense and dry. But you need it to be compelling, memorable, and understandable. The solution? Infographics. These are tools that let you present information in a visually striking way and turn quantitative or qualitative data into stories that engage and resonate. Whoever you’ll be presenting to — customers, donors, or your own internal teams — our template will let you design an infographic that combines text and visuals to break down even the most complicated data.
T-Chart Template
Works best for:
Ideation, Operations, Strategic Planning
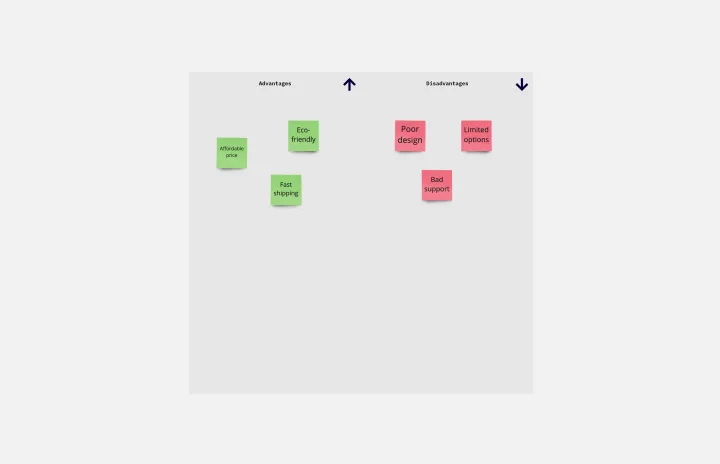
T-Charts can help you compare and contrast two different ideas, group information into different categories, and prove a change through “before” and “after” analysis. T-Charts are visual organizational tools that enable you to compare ideas, so you can evaluate pros and cons, facts and opinions, strengths and weaknesses, or big-picture views versus specific details. Designers and content creators can use T-Charts to turn possibilities into actionable ideas. T-Charts are useful for discussing differences and similarities with your team or clients and can help you to reach a decision together.
Scenario Mapping Template
Works best for:
Desk Research, Mapping, Product Management
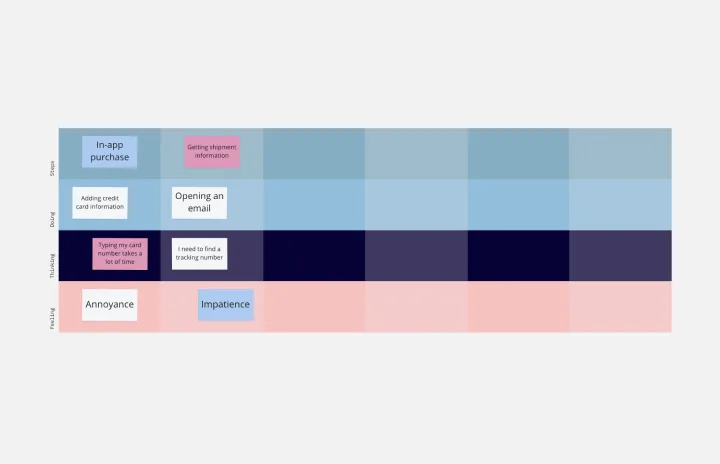
Scenario mapping is the process of outlining all the steps a user will take to complete a task. The scenario mapping template helps you create a visual guide to what different personas are doing, thinking, and feeling in different situations. Use scenario mapping to outline an intended or ideal scenario (what should happen) as well as what currently happens. If you’re trying to outline the ideal scenario, user mapping should take place very early on in a project and can help inform user stories and the product backlog. If you’re just trying to get a better sense of what currently happens, you can do user mapping when conducting user interviews or observation.

Daily Stand-up Meeting Template
Works best for:
Agile Methodology, Meetings, Software Development
The entire team meets to review the day before and discuss the day ahead. These daily meetings, also known as “scrums,” are brief but powerful — they identify roadblocks, give each team member a voice, foster collaboration, keep progress on track, and ultimately keep teams working together effectively. This template makes it so easy for you to plan daily standups for your sprint team. It all starts with picking a date and time, creating an agenda, and sticking with the same format throughout the sprint.