Block Diagram Template
Gain a better understanding of your current systems and build new ones.
Trusted by 65M+ users and leading companies


About the Block Diagram Template
The block diagram template is a free, ready-to-use flowchart template, which you can use to model objects in a system and visualize how they connect to each other.
Opening the template allows you to start customizing it right in Miro, saving you from having to create one from scratch, while giving you plenty of diagramming tools to make it your own — such as shapes, text boxes, and connection lines. In other words, the block diagram template makes it easy for anyone to get a high-level overview of complex systems, and to visualize them in digestible ways.
How to create a block diagram using Miro’s template
Ready to try out the block diagram template? Here are four steps to help you make the most of it:
Step 1: Identify your goal
To get started, scroll to the top of this page and click on the “Use template” button. That’ll open the block diagram template up right in Miro, allowing you to start filling it in immediately. If you’re collaborating with teammates, don’t forget to invite them to edit the template by clicking the blue “Share” button on the top right of your Miro board.
But before you start filling the template in, identify the system or process you’re trying to visualize with your block diagram — whether you’re building a new control system, representing a complex subway map, or improving an existing business process. When collaborating, talk to your teammates to align expectations. For the sake of learning how to use this template, let’s pretend you’re trying to visualize the process of serving lemonade.
Step 2: Fill in the input and output
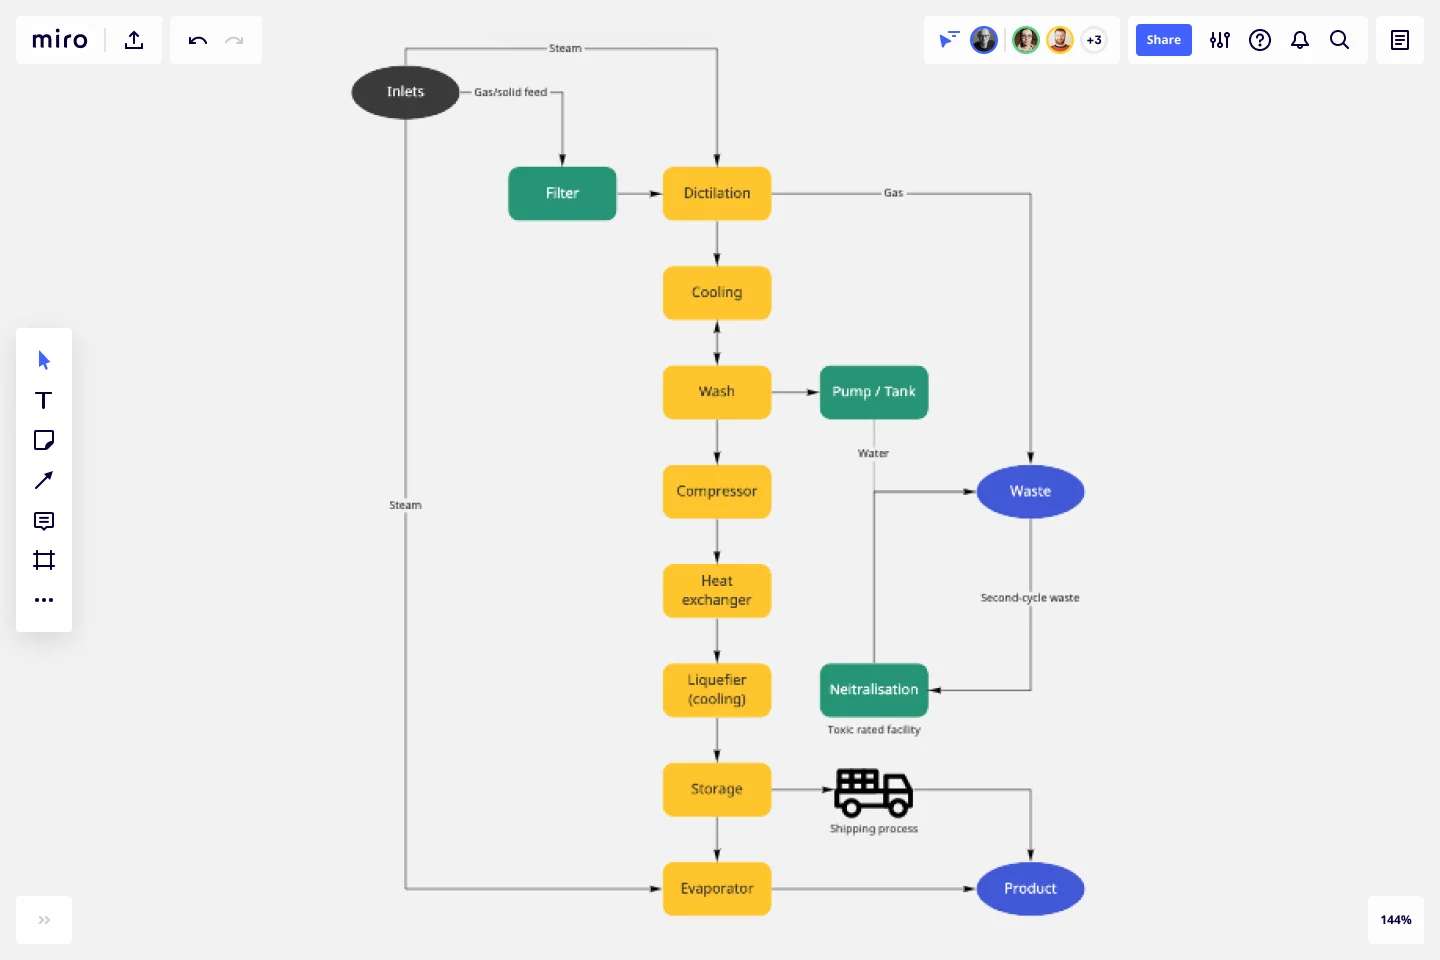
A block diagram typically depicts processes from start to finish — beginning with an input and ending with an output. The black oval on the top left of your template represents the input, while the two blue ovals on the right represent two possible outputs. The rest of the blocks represent all the important components or steps that are part of the process you’re visualizing.
Double-click on the text box in the black oval on the left to add your own input. Going back to the example of serving lemonade, write “pick lemons.” Next, edit the text boxes in the blue ovals on the right to add your outcomes by writing “served lemonade” in one of them. Since making lemonade can lead to peel and seed waste, we can keep the other blue oval’s default text as “waste.”
That said, feel free to add or delete ovals depending on the number of outcomes you’d like to portray.
Step 3: Fill in the process blocks
Next, it’s time to fill in the green and yellow boxes — also known as the process blocks. These blocks represent the various steps it takes to get from input to output, and depending on how complex the process you’re visualizing is, you may not need as many as you see in the template.
You’ll also notice that the template comes with eight yellow process blocks and three green ones. The yellow ones represent the core set of steps for completing your process, whereas the green ones represent any additional steps you need to take before or after.
In this case, our core steps (yellow blocks) refer to the process of making the lemonade itself, while the additional steps (green block) refer to anything we need to do before or after that — like gathering the ingredients or actually serving the juice. Our lemonade recipe is simple, so go ahead and delete five of the yellow blocks so that you only have three left. Then, write “squeeze lemons” in the first one, “add sugar” in the second one, and “stir” in the third one.
Then edit the text for the first green block on the left to say “gather other ingredients”. This represents the step you need to take before squeezing lemons. In the green block that leads to the “waste” outcome from step 2, edit the text to say “collect peels”. This represents the step you need to take before you generate waste. Similarly, edit the text in the final green block – the one that leads to “served lemonade” – to say “pour into glass”.
Step 4: Rearrange and label the arrows
You’ve added all the steps, but you might notice that the arrows are still pointing in the default directions they came in when you first opened the block diagram template. Take a moment to rearrange the arrows to make sure your diagram accurately depicts the process of making lemonade in chronological order. If you’re not sure where to start, remember that your block diagram should begin with an input block, continue toward process blocks, and end with the output block.
To delete any unnecessary arrows, simply click on them and hit “delete” on your keyboard. To add a new arrow, click on any process block to reveal the blue dots around it. Then, click on the dot where you want your arrow to start and drag it to where you want it to end. You can also click on the text boxes along the arrows to edit the text or remove them altogether.
And there you have it, a personalized block diagram template according to your goals.
Benefits of using the block diagram template
Miro’s online block diagram maker not only makes it easy for you to create quickly but also comes with plenty of customization options to help you truly make it your own. Not only does the block diagram template come with pre-made shapes and text boxes ready for you to fill in, but it’s also easy to modify — whether you want to add more blocks and connection lines, or delete the ones you don’t need.
You can even change everything from your Miro board’s background color to the thickness of your connection lines, making it easy to apply your brand style or simply play with the look and feel.
Want to refer to important notes on the go? Embed entire Google Documents, Sheets, or Slides right in your Miro board’s infinite canvas, allowing you to refer to them while filling in the block diagram template. Want a quicker way to add notes? Simply copy and paste text onto your canvas, or drag and drop images and screenshots. In other words, Miro’s block diagram template isn’t just a creative outlet; it’s also an all-in-one solution for speeding up your entire workflow.
What is a block diagram template?
A block diagram template is a pre-made diagramming template you can use to visually represent complex systems or processes. It uses blocks to represent individual components within that system or process, and arrows to represent the relationships between those components. Some common use cases for a block diagram include visualizing a subway system and mapping a customer journey.
Can I customize the block diagram template to suit my needs?
Yes, you can easily customize the block diagram template by using Miro’s robust diagramming and styling tools. That includes adding or deleting more blocks and arrows, changing the colors and shape sizes, and editing the text — all according to your unique goals and interests. These features are especially helpful for teams looking to create a block diagram in line with their brand guidelines.
How can I share my block diagram template with others?
There are many ways to share your block diagram template — from exporting it as a PDF or image to inviting collaborators to view your Miro board and add comments. You can also share your Miro board via a link, or generate a code to embed it elsewhere. It’s all a matter of what method suits your team best.
Get started with this template right now.
Google Cloud Architecture Diagram Template
Works best for:
Software Development, Diagrams
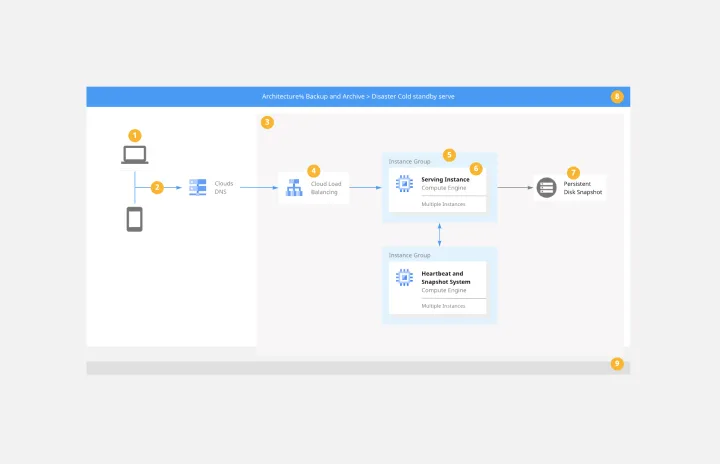
Use the Google Cloud Architecture Diagram template to clearly visualize the deployment of your application and allow you and your team to optimize processes. The GCP template gives you a great overview of your application architecture, and it helps you to iterate quickly and better manage your application development, deployment, and documentation. Try it out and see if it works for you.
PERT Chart Template
Works best for:
Mapping, Diagrams, Project Planning
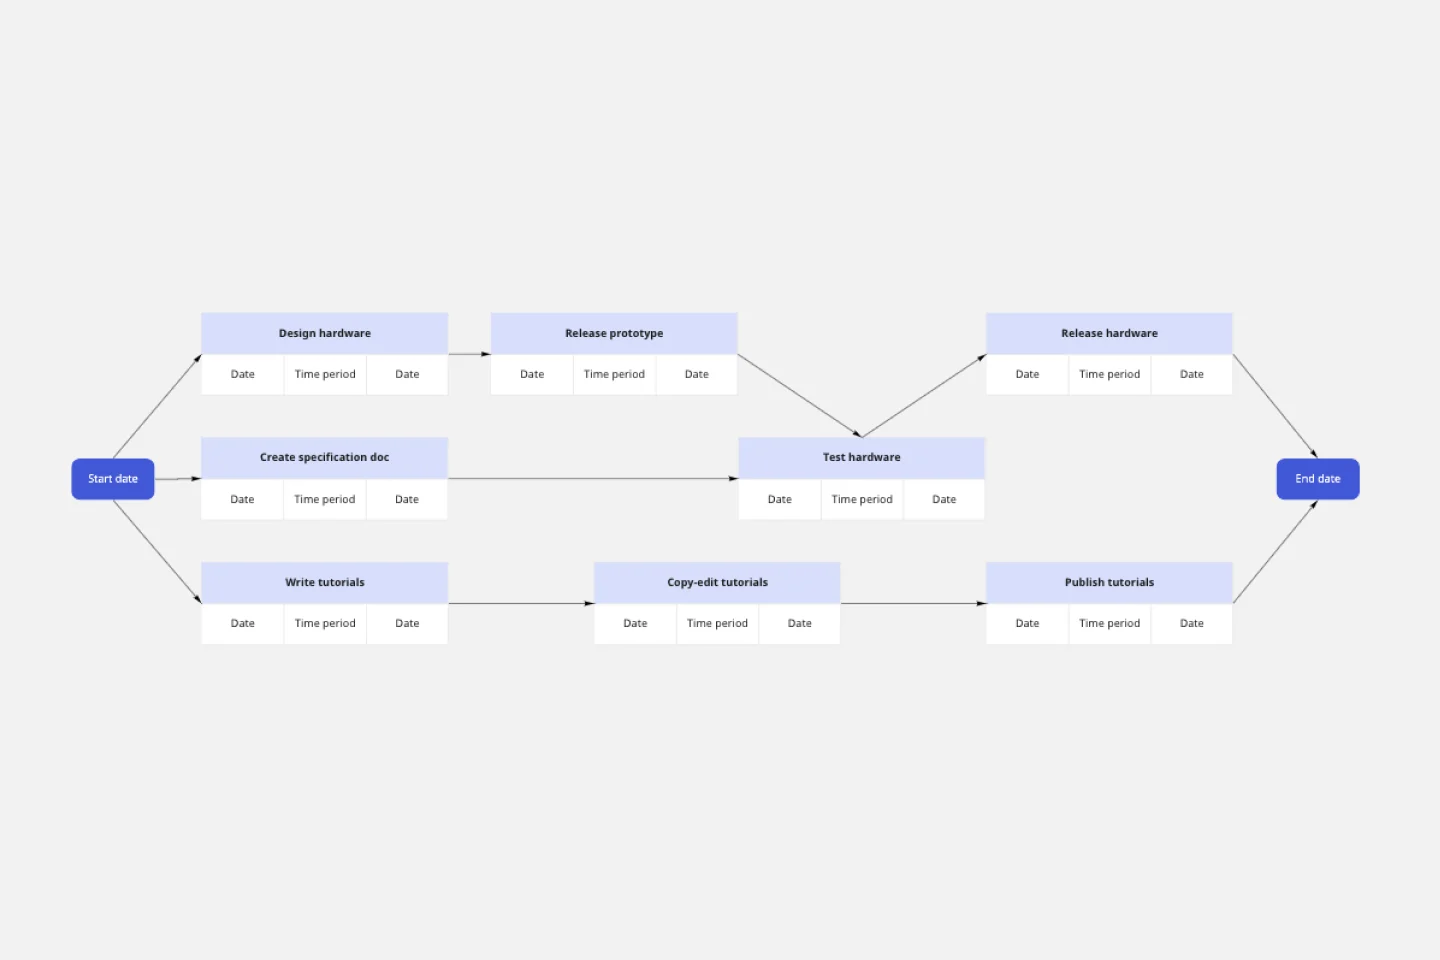
A Program Evaluation and Review Technique (PERT) diagram is used to plan projects efficiently. They help you set a clear timeline, plan out tasks and dependencies, and determine a critical path.
Team Charter Template
Works best for:
Meetings, Workshops, Team Meetings
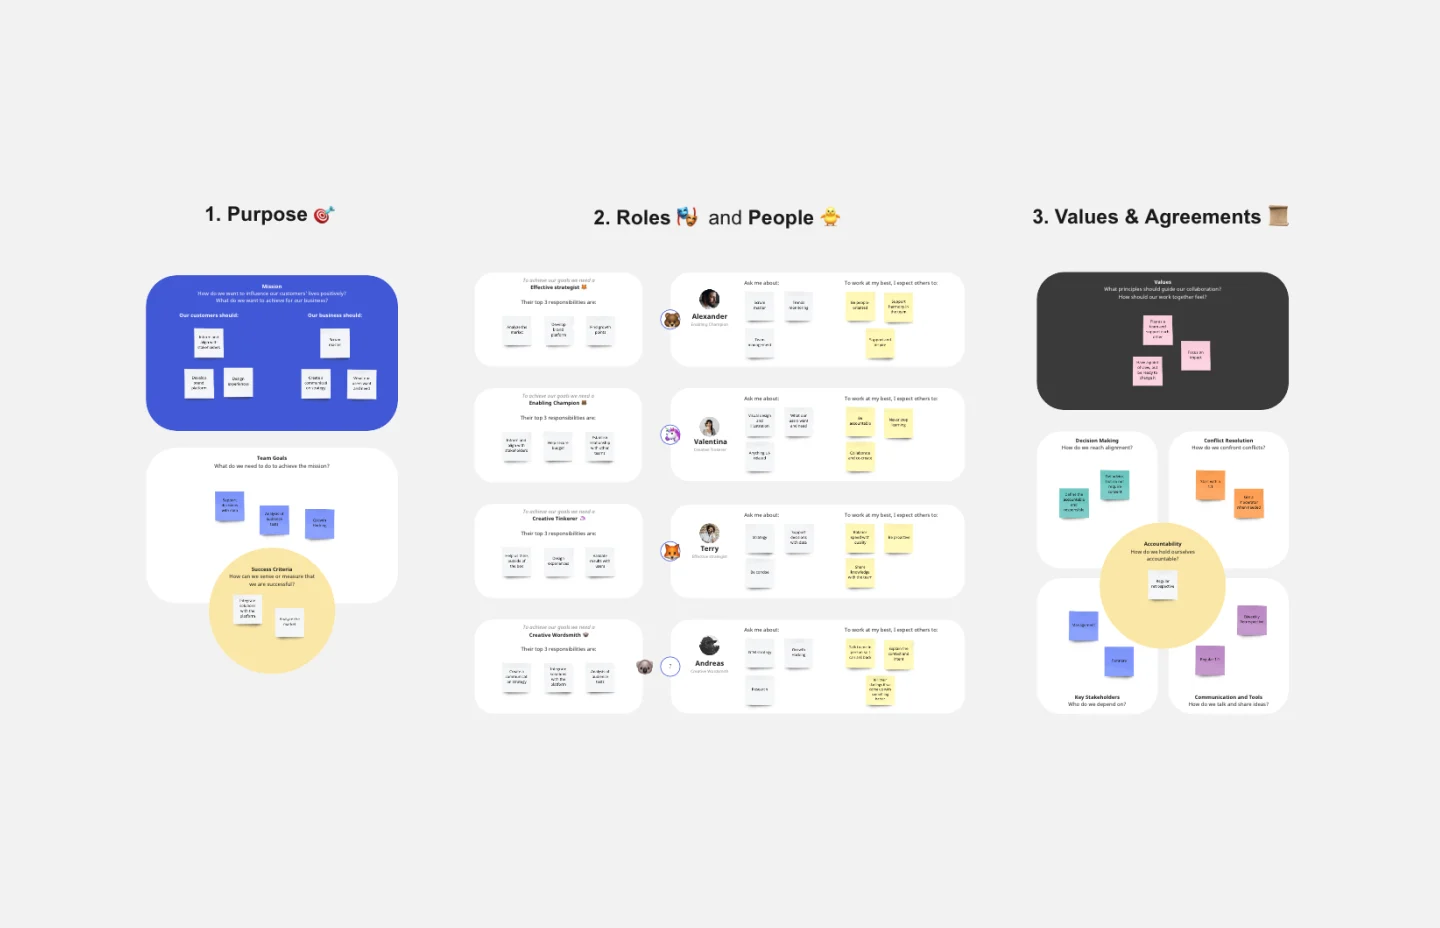
A team charter is a document that outlines your team’s purpose and objectives, as well as steps you will take to reach your goals. The team charter illustrates the focus and direction for all team members. When created collaboratively, the team charter is a great way for individuals to feel even more connected to one another within the group. A team charter template is useful when you’re first establishing a new team, adding new members to an existing team, or when you need to better align regardless of your team’s tenure.
Production Workflow Template
Works best for:
Agile Workflows, Agile Methodology, Project Management
Whether you’re producing a podcast, a marketing campaign, a TV show, or a piece of content, establishing a production workflow is crucial. A production workflow creates a visual guide to the different steps in a process. It can be used to train new team members or give a high-level overview to stakeholders. Although production workflows vary by team and business, they generally contain information about who the stakeholders are, how you brainstorm ideas, what your timeline looks like, and what resources you need to succeed.

Opportunity Solution Tree Template
Works best for:
Flowcharts, Product Management, Diagrams
Solving problems — successful companies and productive teams just know how to do it. They’re able to identify many possible solutions, then settle on the one that leads to the desired outcome. That’s the power an Opportunity Solution Tree gives you. Designed by Teresa Torres, a product discovery coach, this mind map breaks down your desired outcome into opportunities for the product to meet user needs, then gives your team an effective way to brainstorm potential solutions.
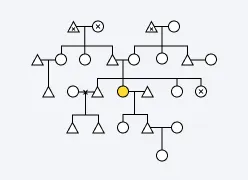
Kinship Diagram Template
Works best for:
Mapping, Diagrams
Use a Kinship Diagram Template to map out a clear picture of your family relationships. With clear guidelines for kinship notation, you can navigate everything from your closest uncle to your third cousin twice removed. Try the Kinship Diagram Template to understand your family relationships.