2-Circle Venn Diagram Template
Simplify complex ideas, boost team collaboration, and foster innovative insights with the 2-Circle Venn Diagram Template. It's an all-encompassing tool that improves your decision-making and brainstorming processes.
Trusted by 65M+ users and leading companies


About the 2 Circle Venn Diagram Template
The 2 Circle Venn Diagram Template is one tool that helps teams to collaborate and communicate better. Whether for business strategy, education, or simply brainstorming, this universal template allows you to illustrate connections and disparities and distill complex data into digestible visual information.
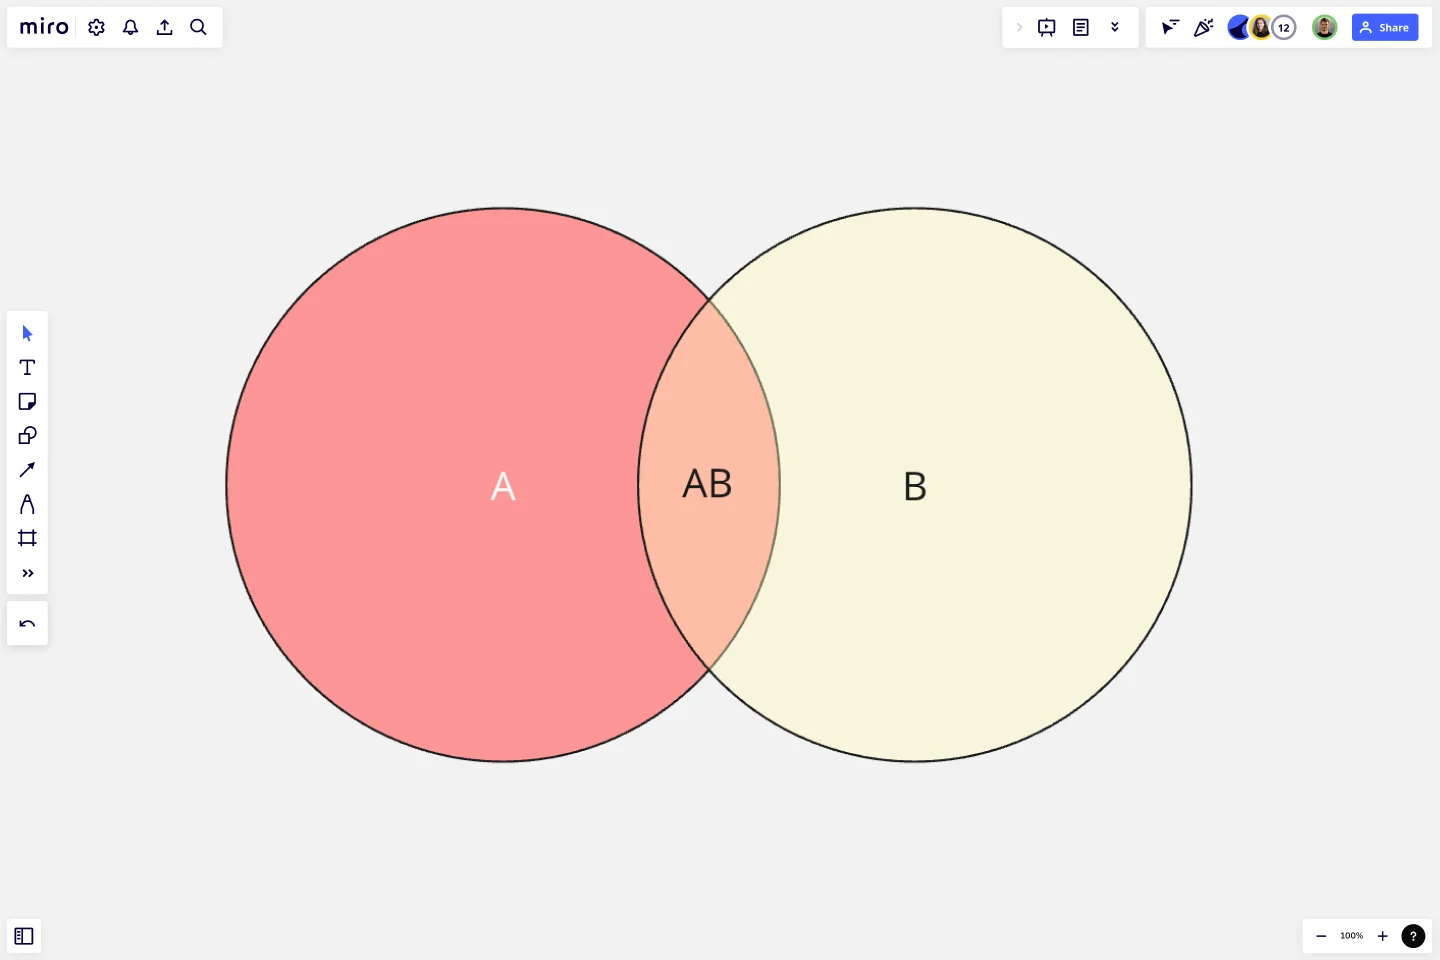
What's a 2-Circle Venn Diagram Template?
A 2-Circle Venn Diagram is a visual representation that maps the relationship between two distinct groups or sets of data. It consists of two overlapping circles, where each circle symbolizes a unique set. These circles' overlapping or intersecting area delineates shared traits or commonalities between these sets. Venn diagrams are an easy-to-understand visual tool that allows you to represent complex relationships, compare and contrast different entities, and stimulate thought-provoking discussions.
How to use a 2-Circle Venn Diagram Template in Miro?
Step 1: Select the 2-Circle Venn Diagram Template and add it to your board.
Step 2: Once the template is on your board, label each circle to represent the two sets or groups you are comparing and contrasting.
Step 3: Fill your circles with respective data points or ideas. Depending on your project's requirements, these could be anything from product features to business strategies.
Step 4: Use Miro's automated diagramming features for an impeccably neat and professional look. These tools automatically align and space your elements, helping you maintain consistency throughout your diagram.
Step 5: Edit your 2-circle Venn diagram effortlessly. Adjust, move, and edit elements until you achieve a layout that serves your purpose best.
Step 6: Finally, invite your team members to collaborate. They can simultaneously work on the diagram, provide real time feedback, and contribute to it. Once satisfied with your Venn Diagram, you can share it with others via a link or present it in a meeting.
Remember, practice makes perfect. The more you use the 2 Circle Venn Diagram Template in Miro, the more fluent you'll become at visualizing and communicating complex relationships and ideas. Miro is the perfect Venn diagram maker with a range of available templates and the ability to customize everything, from the number of circles to labeling and colors. Happy diagramming!
Can I customize my 2 Circle Venn Diagram Template in Miro?
Absolutely! Change the size, colors, and labels of the circles, as well as the fonts used, thereby aligning your diagram with your project's unique aesthetics or your personal preferences.
Can multiple team members collaborate on a single Venn Diagram?
Yes. Team members can work simultaneously on the same Venn Diagram, making it a truly interactive experience. They can add comments, provide real-time feedback, and contribute to the diagram, enhancing team synergy.
Does Miro support data import for creating Venn Diagrams?
Yes, Miro supports data import from a range of formats. This functionality streamlines the process of inputting the necessary information into your Venn Diagram, saving you time and ensuring accuracy.
Can I share my Venn Diagram with people who do not have a Miro account?
Yes, Miro allows you to share your Venn Diagram via a link. The receivers can view it without a Miro account. However, if they need to edit or contribute, they must create a free account.
Get started with this template right now.

Force Field Analysis Template
Works best for:
Diagramming, Strategic Planning
A Force Field Analysis Template is a powerful tool that helps teams identify and analyze the forces supporting or hindering progress toward a specific change or goal. This template provides a visual space where you can brainstorm and plot out 'driving forces' that push objectives forward and 'restraining forces' that prevent advancement, all on a single, intuitive board. One of the primary benefits of utilizing the Force Field Analysis template is that it fosters a shared understanding among team members. By visually mapping out and discussing each force, teams can prioritize efforts, build consensus on the central issues to tackle, and collaboratively devise strategic plans to strengthen positive influences while reducing negative ones.

Azure Demand Forecasting Template
Works best for:
Software Development, Diagrams
The Azure Demand Forecasting diagram will show the architecture of a demand forecast, making it easier for you to predict data consumption, costs, and forecast results. Azure is Microsoft’s cloud computing platform, designed to provide cloud-based services such as remote storage, database hosting, and centralized account management. Azure also offers new capabilities like AI and the Internet of Things (IoT).
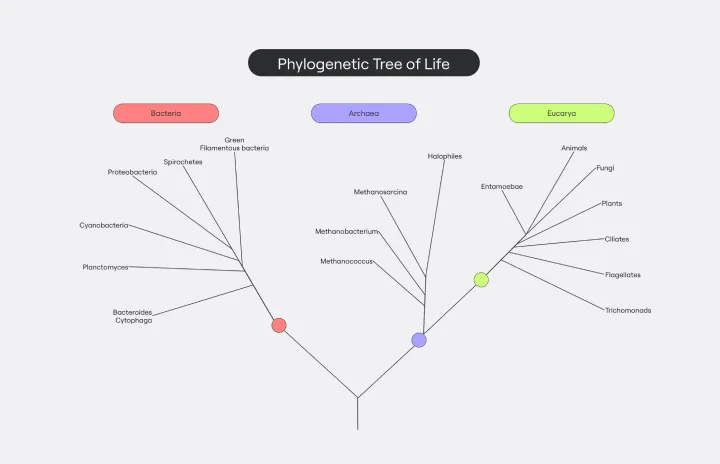
Phylogenetic Tree Template
Works best for:
Diagramming
The Phylogenetic Tree Template is a powerful tool that allows scientists and researchers to visualize evolutionary relationships between species. It is a visual representation of the history of the evolution of life on Earth and helps users identify the relationships between other organisms and their ancestors. The key benefit of this template is that it organizes complex data and makes it more understandable to everyone. Additionally, it offers an efficient way to collect and analyze data, saving time and effort and enabling users to identify significant patterns and relationships in the data.

Production Flowchart Template
Works best for:
Diagramming, Flowcharts
The Production Flowchart Template is a well-crafted tool that clearly represents a production process from start to finish. It breaks down complex procedures into easy-to-understand segments, making it easier for stakeholders to grasp the entire process. One of the key benefits of using this template is that it helps to clarify complex production pathways. By mapping out operations visually, teams can identify potential bottlenecks or inefficiencies, facilitating timely and well-informed decision-making.

Azure Architecture Diagram Template
Works best for:
Software Development, Diagrams
The Azure Architecture Diagram Template is a diagram that will help you visualize the combination of any data and build and deploy custom machine learning models at scale. Azure is Microsoft’s cloud computing platform, designed to provide cloud-based services such as remote storage, database hosting, and centralized account management. Use Azure Architecture Diagram template to build sophisticated, transformational apps.

Stage-Gate Process Flowchart Template
Works best for:
Diagramming, Project Management
The Stage-Gate Process Flowchart Template structures a project into distinct stages separated by decision-making gates, enhancing the quality of decisions and leading to more successful project outcomes.