Phylogenetic Tree Template
Organize complex data and make it more understandable to everyone with the phylogenetic tree template.
Trusted by 65M+ users and leading companies


About the Phylogenetic Tree Template
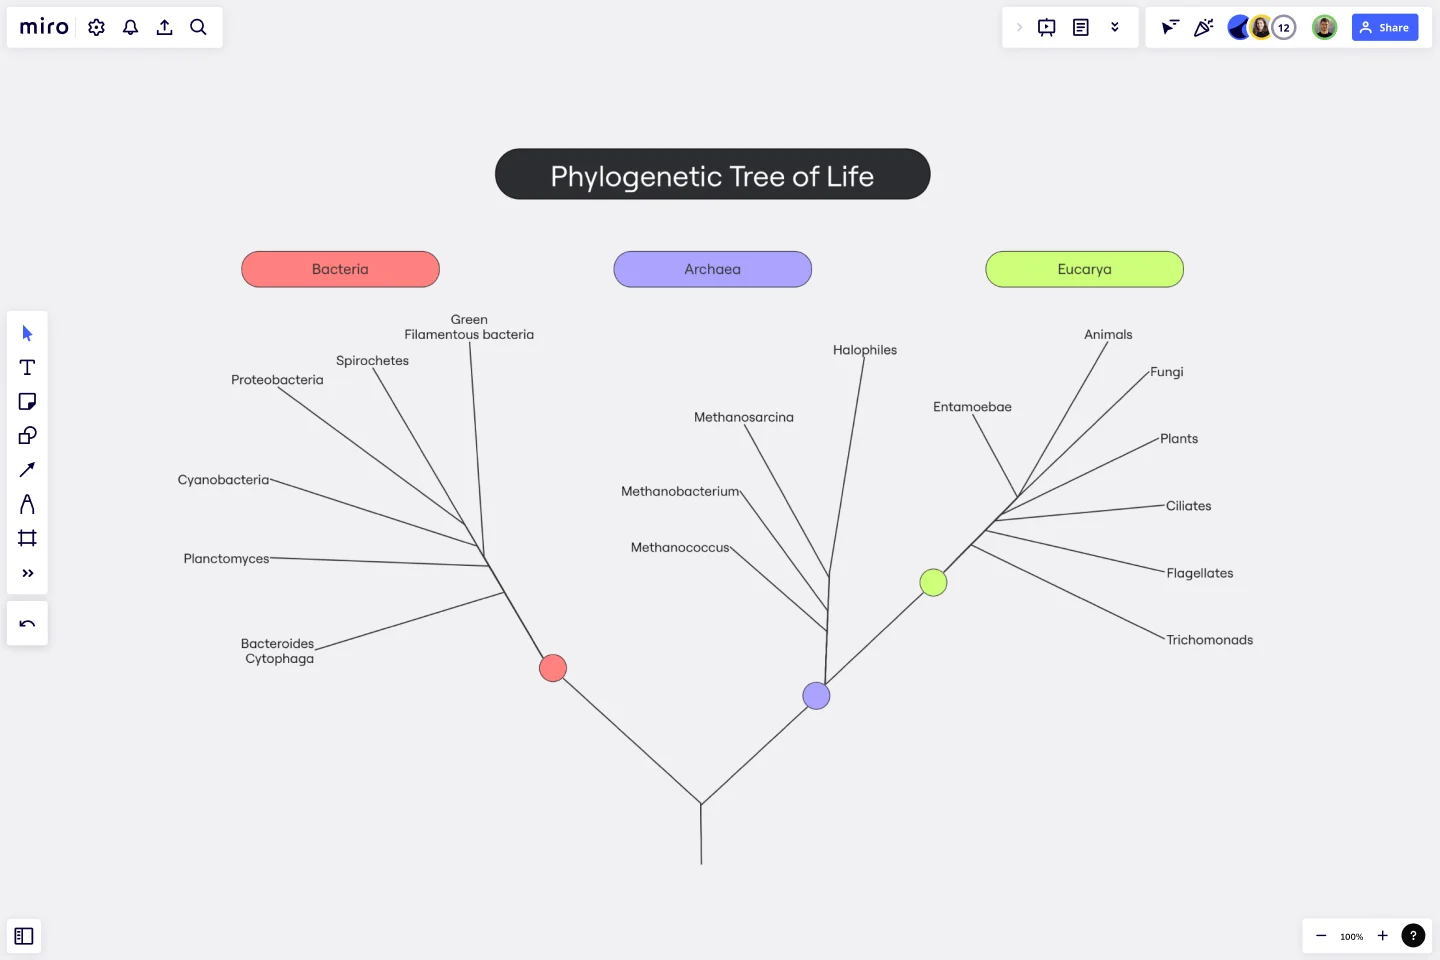
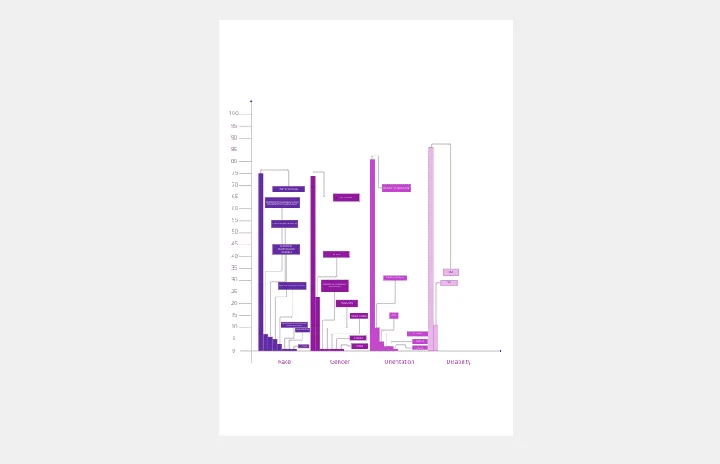
The phylogenetic tree template is an innovative tool for visualizing the evolutionary relationships between species. It is a visual representation of the history of the evolution of life on Earth, and it helps scientists and researchers to identify the relationships between different organisms and their ancestors. This template is a great way to organize complex data and make it more understandable to everyone.
In Miro, the phylogenetic tree template is designed to be simple and easy to use, consisting of different areas representing various aspects of organisms' evolutionary history. These areas include different branches, connector lines, and nodes.
How to use the phylogenetic tree template in Miro
Using the phylogenetic tree template in Miro is very easy. Here are the steps:
Start by adding your data to the template, anything from taxonomic names to DNA sequences.
Use the automated diagramming features to expand the template with more branches and connector lines.
Add any artifact to the Miro board to give more context to your data.
Why should you use the phylogenetic tree?
The phylogenetic tree template offers many benefits to researchers and scientists in biology. Here are some of its key advantages:
Visualizes complex data clearly and concisely, making it easier to comprehend.
It provides an efficient way to organize data and information, enabling easy access and analysis.
It helps identify the relationships between different organisms and their ancestors, leading to important discoveries and insights.
Useful for teaching and learning, providing a visual representation of complex topics and concepts.
Allows for collaboration between researchers and scientists, facilitating the sharing and analysis of data and leading to breakthroughs in the field of biology.
Overall, the phylogenetic tree template is a highly effective tool that has proven invaluable in studying evolutionary biology. Explore all features of Miro's phylogenetic tree maker and start diagramming right now.
Can I personalize the template according to my requirements?
Yes, the template is fully customizable, and you can easily change it with just a few clicks.
Can I expand the template with more branches and connector lines to accommodate my data?
Yes, you can increase the template size with automated diagramming features that allow you to add more branches and connector lines.
Can I add artifacts to the Miro board to provide more context?
Yes, you can add any artifacts to the Miro board to give more context to your data. Simply drag and drop files onto your board.
Get started with this template right now.

Driver Diagram Template
Works best for:
Diagramming
The driver diagram template is a strategic visual tool that helps teams map out their primary objectives and break them down into actionable components. It presents goals, drivers, and specific change ideas in a coherent and interconnected format, ensuring clarity of objective. By doing so, every team member is aligned towards a common endpoint, fostering unified efforts. The visual nature of the template simplifies complex objectives, making it easier for teams to stay on track and measure their progress effectively.
Job Search Process Diagram
Works best for:
Diagramming
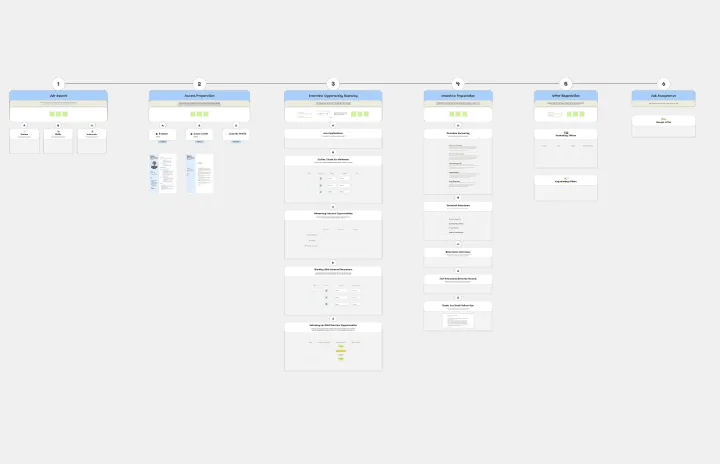
The Job Search Process Diagram template offers a visual tool for mapping out the steps and stages involved in the job search process. It provides a structured framework for organizing tasks, tracking progress, and managing resources. This template enables job seekers to streamline their job search efforts, stay organized, and increase their chances of success. By promoting clarity and efficiency, the Job Search Process Diagram empowers individuals to navigate the job market effectively and achieve their career goals.
Cisco Data Network Diagram Template
Works best for:
Software Development
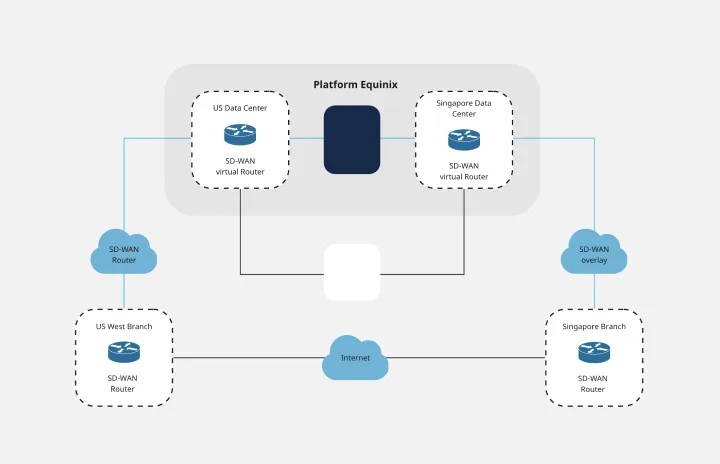
Cisco offers data center and access networking solutions built for scale with industry-leading automation, programmability, and real-time visibility. The Cisco Data Network Diagram uses Cisco elements to show the network design of Cisco Data Networks visually.
Dichotomous Key Template
Works best for:
Diagramming
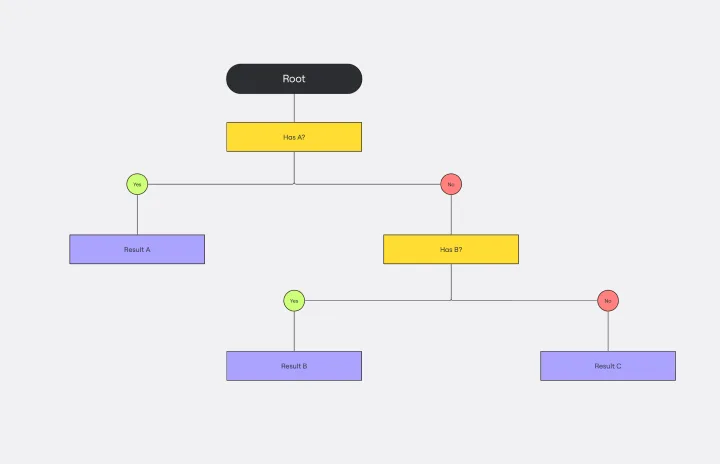
The Dichotomous Key Template stands out as an exceptional tool for simplifying complex classification processes, significantly enhancing learning experiences. Breaking down intricate subjects into a series of binary decisions transforms how information is absorbed and understood. This systematic approach not only aids in retaining intricate details but also makes the learning process more engaging and interactive. Whether for educational purposes or professional use, the template’s design fosters a deeper comprehension of the subject matter, allowing learners and professionals to navigate complex scenarios with clarity and ease.
DMAIC Analysis Template
Works best for:
Agile Methodology, Design Thinking, Operations
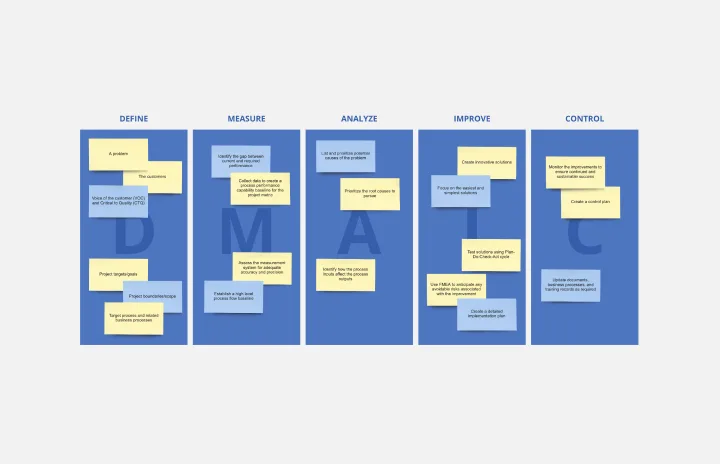
Processes might not seem like the funnest thing to dive into and examine, but wow can it pay off—a more efficient process can lead to serious cost savings and a better product. That’s what DMAIC analysis does. Developed as part of the Six Sigma initiative, DMAIC is a data-driven quality strategy for streamlining processes and resolving issues. The technique is broken into five fundamental steps that are followed in order: Define, Measure, Analyze, Improve, and Control.
Bar Chart / Diagram Combined
Works best for:
Diagramming
The Bar Chart / Diagram Combined template offers a versatile tool for creating visualizations that combine bar charts with other diagrammatic elements. It provides elements for representing data trends, relationships, and comparisons effectively. This template enables teams to create customized visualizations that communicate complex information in a clear and compelling manner. By promoting visual clarity and insight, the Bar Chart / Diagram Combined template empowers teams to make data-driven decisions and communicate findings with impact.