Stage-Gate Process Flowchart Template
Improve decision-making, mitigate risks, and drive project success with the stage-gate process flowchart template.
Trusted by 65M+ users and leading companies


About the Stage-Gate Process Flowchart Template
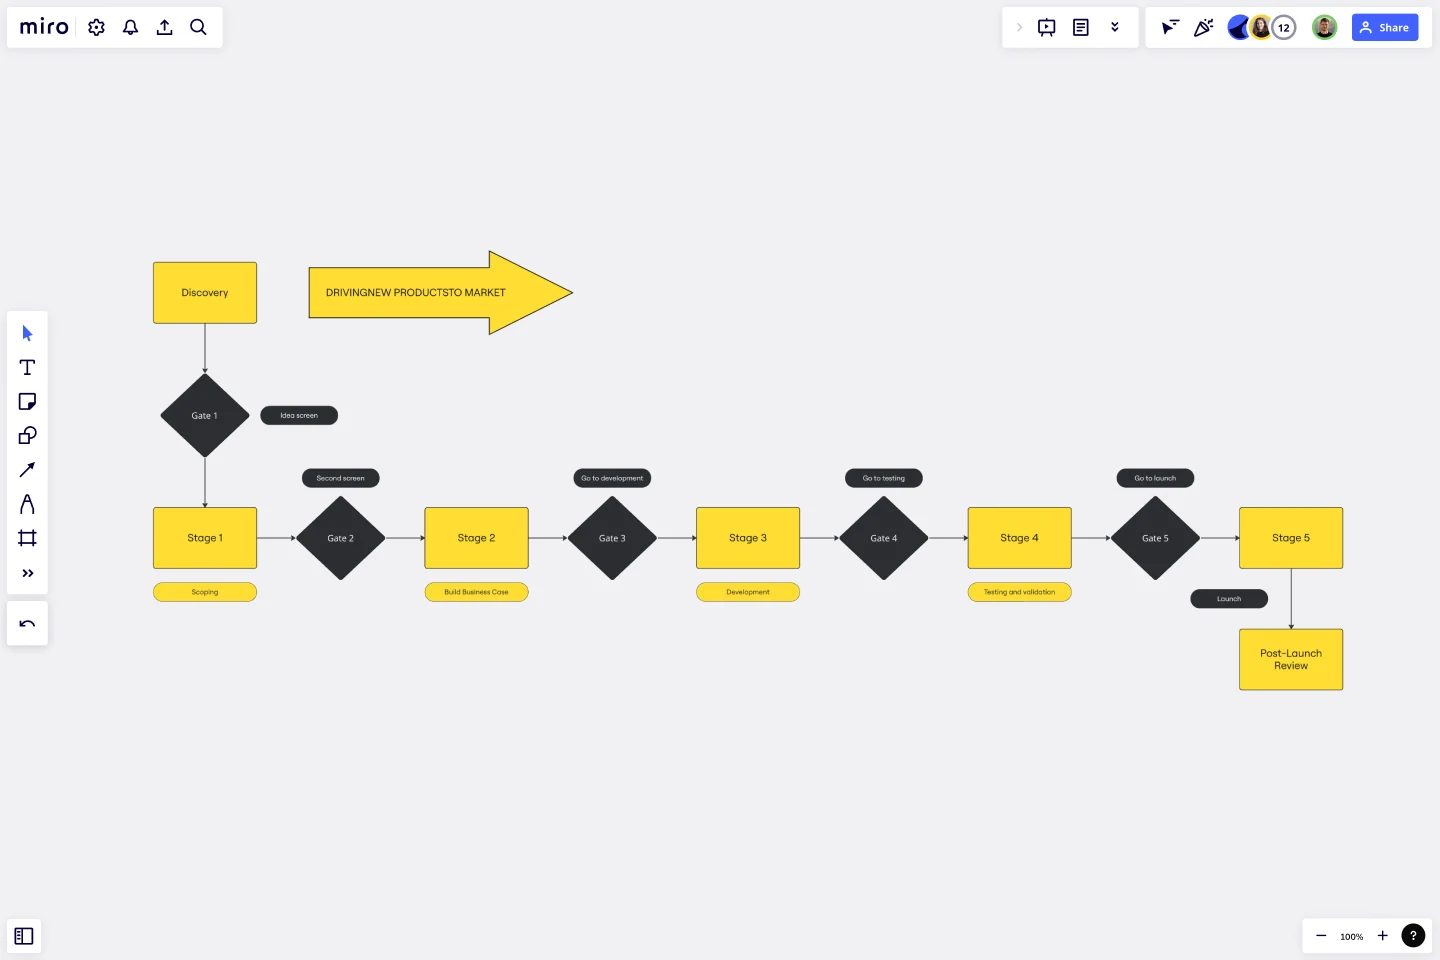
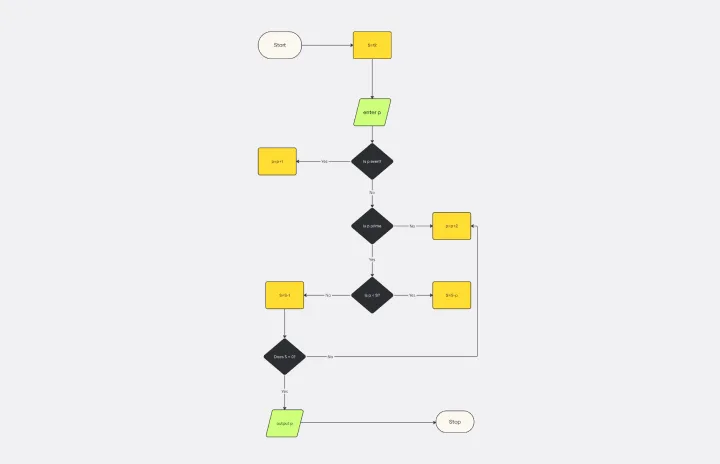
The Stage-Gate Process Flowchart Template is a significant asset for project management, designed to simplify the advancement of projects through different stages. This template provides a systematic approach that helps teams efficiently manage and monitor each phase of a project, starting from the beginning to completion. It guides teams through a sequence of checkpoints or "gates" where decisions are made before moving on to the subsequent stage.
This template is divided into sections representing a project's various stages and decision points. Each stage signifies a key phase in the project, such as ideation, planning, execution, and review. The decision points, positioned between stages, serve as checkpoints where progress is evaluated, and a decision is made to either continue, change, or stop the project. Using this template, you can systematically track progress, identify potential issues early on, and ensure that each project phase aligns with the objectives.
How to use the Stage-Gate Process Flowchart Template in Miro
Customize the template: Easily edit the template with just a few clicks. Change the stage names and descriptions to suit the project's specific needs.
Expand with diagramming tools: Use Miro's automated diagramming features to add more shapes and connector lines, enriching the flowchart with additional details and complexities as needed.
Integrate artifacts: Enhance the flowchart by adding any relevant artifacts directly onto the Miro board. This could include documents, images, or links, providing context and information at each stage.
Collaborate and share: Invite team members to view, edit, and comment on the flowchart, fostering a collaborative environment where everyone stays informed and aligned.
Why should you use a Stage-Gate Process Flowchart Template?
Improved project clarity: Clearly define each project stage, ensuring team members understand their roles and responsibilities at every phase.
Informed decision-making: The gate checkpoints facilitate informed decisions based on thorough project progress and feasibility evaluations.
Risk mitigation: Early identification and management of potential risks and issues, reducing the likelihood of project delays or failures.
Efficient resource allocation: Allows for the best distribution and utilization of resources throughout the project lifecycle.
Facilitates communication: Provides a visual representation of the project plan, improving Communication and understanding among stakeholders.
Can the template be customized for different project types?
Yes, the template is highly adaptable and can be tailored to fit a wide range of project types and industries.
How does the template assist in risk management?
The template allows for regular assessments at each gate, enabling teams to identify and address risks early in the project lifecycle.
Get started with this template right now.
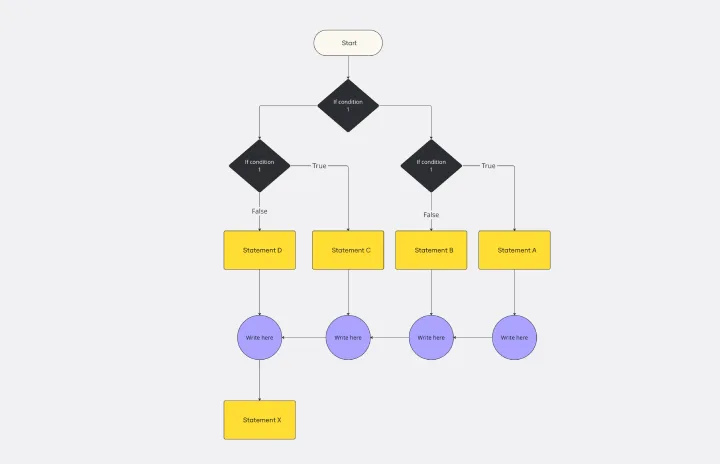
If then Flowchart Template
Works best for:
Flowcharts
The If-then Flowchart Template is a useful tool for decision-making. It visually maps out conditional steps and outcomes, allowing users to anticipate potential challenges and opportunities. This foresight is valuable for making informed decisions, especially for those with significant implications. Whether for business strategy, project management, or personal decision-making, the template helps navigate complex decision trees with confidence.
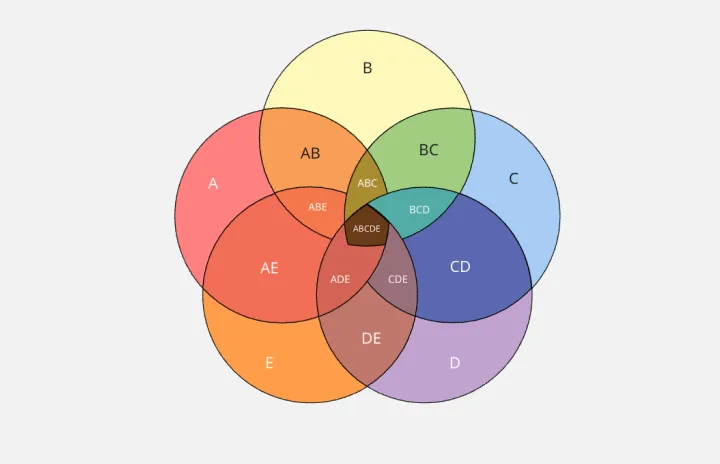
5-Circle Venn Diagram Template
Works best for:
Diagramming, Mapping, Brainstorming
Discover how Miro's 5 Circle Venn Diagram Template can simplify complex decision-making processes. Learn how to create, customize, and share your diagrams for effective visual collaboration. Transform brainstorming sessions with real time, remote teamwork.
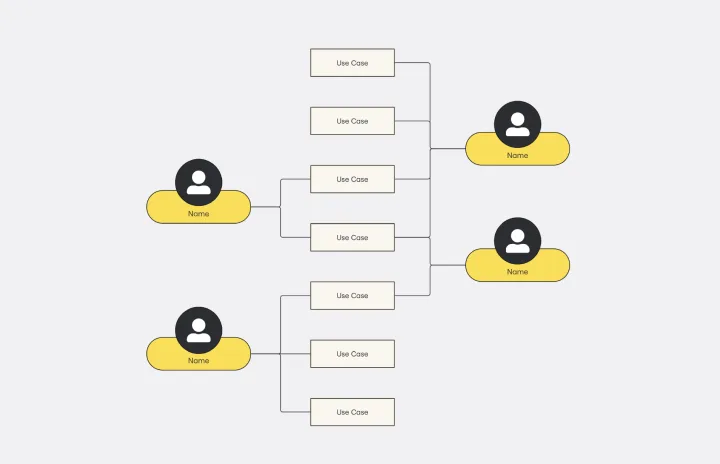
Use Case Diagram Template
Works best for:
Marketing, Market Research, Diagrams
A use case diagram is a visual tool that helps you analyze the relationships between personas and use cases. Use case diagrams typically depict the expected behavior of the system: what will happen and when. A use case diagram is helpful because it allows you to design a system from the perspective of the end user. It’s a valuable tool for communicating your desired system behavior in the language of the user, by specifying all externally visible system behavior.
Algorithm Flowchart Template
Works best for:
Diagramming, Flowcharts
The Algorithm Flowchart Template is a useful tool for simplifying the process of creating and understanding complex algorithms. Its pre-structured format makes it easy to lay out each operation and decision point in a clear and easily understandable visual format. This is particularly helpful for explaining intricate processes to team members who may not be as technically proficient in the subject matter. With each step clearly defined within its designated shape, the flowchart promotes clarity and makes it easy to identify the logical flow at a glance. This clarity is the template's most significant advantage, reducing cognitive load and enabling a more inclusive and straightforward approach to discussing and refining algorithmic solutions.
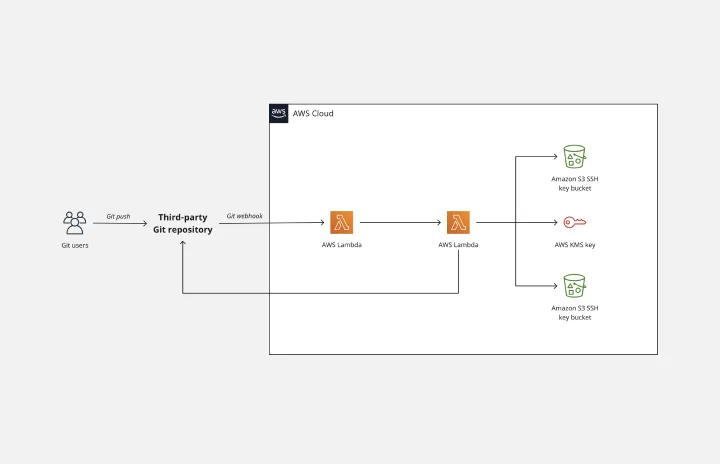
AWS Git to S3 Webhooks Template
Works best for:
Software Development, Diagrams
The AWS Git to S3 Webhooks Template is a visual representation of Git webhooks with AWS services Quick Start architecture. You can now have an overview of your AWS architecture with Miro’s AWS Git to S3 Webhooks Template, track your cloud solutions easily, and optimize processes like never before.

Production Flowchart Template
Works best for:
Diagramming, Flowcharts
The Production Flowchart Template is a well-crafted tool that clearly represents a production process from start to finish. It breaks down complex procedures into easy-to-understand segments, making it easier for stakeholders to grasp the entire process. One of the key benefits of using this template is that it helps to clarify complex production pathways. By mapping out operations visually, teams can identify potential bottlenecks or inefficiencies, facilitating timely and well-informed decision-making.