Pedigree Diagram Template
Map genetic traits to family members with a pedigree diagram.
Trusted by 65M+ users and leading companies


About the Pedigree Diagram Template
You can identify how traits and diseases are passed from one generation to the next using the pedigree diagram template. Pedigree Diagrams are useful for doctors, veterinarians, farmers, and anyone else working with genes or interested in genetics.
What is a pedigree diagram?
A pedigree diagram is an advanced version of a family tree, that is commonly used to diagram relationships within family members. It shows how genetic traits and diseases are passed from one generation to the next.
You can use a pedigree diagram to see which family members carry a certain trait, like a widow’s peak. Doctors use them to see how diseases are passed from parents to children. Farmers use it in husbandry to track traits in crops and animals.
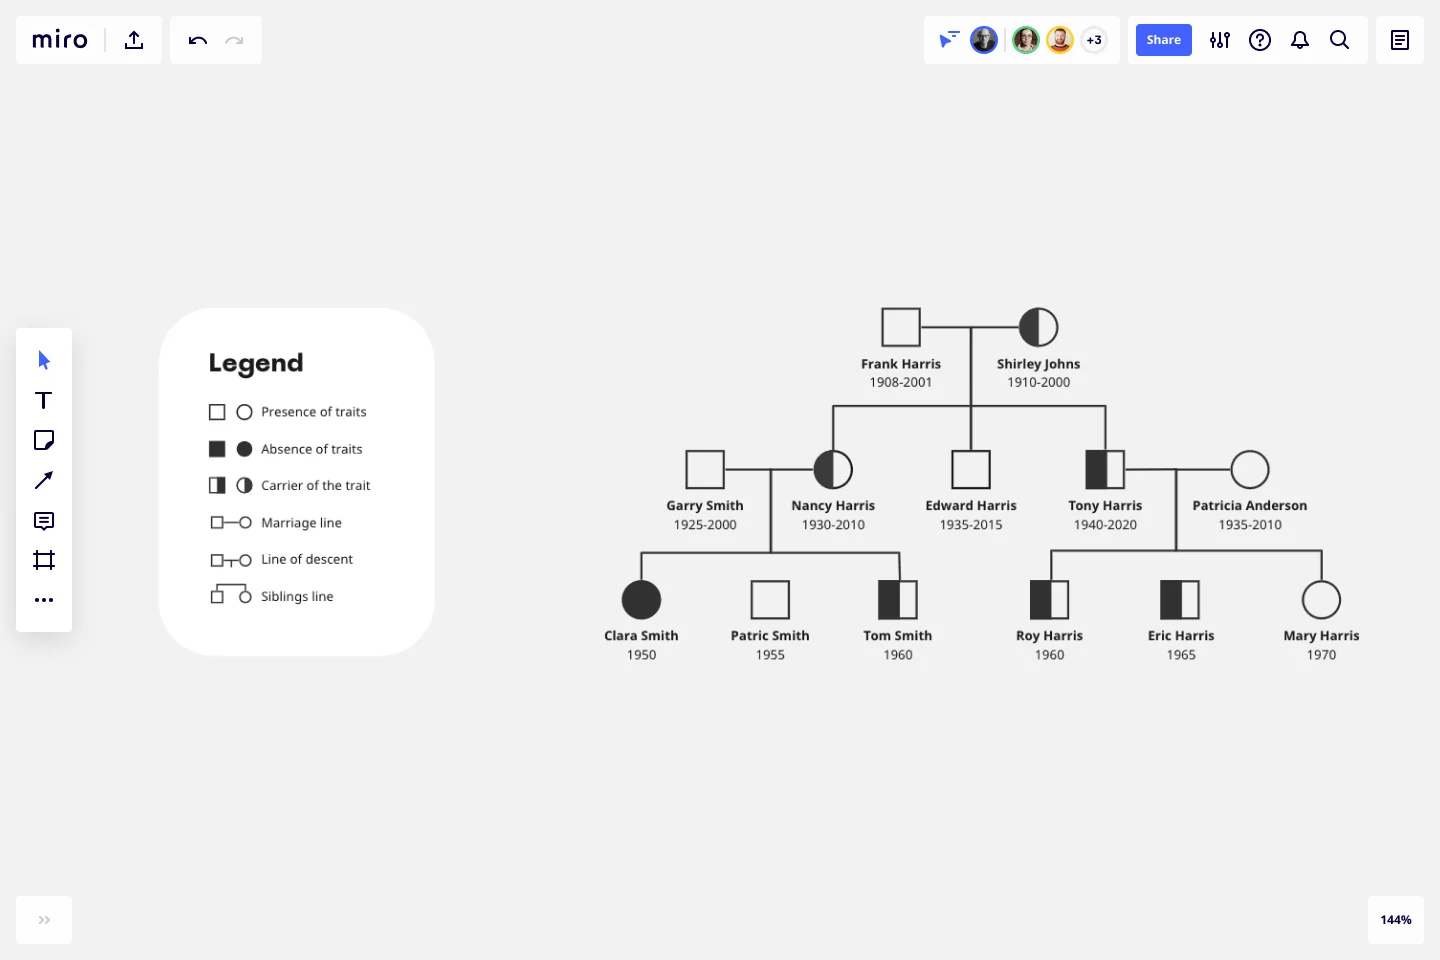
In a pedigree diagram, males are represented by squares; females by circles. Shaded symbols mean someone has a specific trait (e.g., dimples). Unshaded symbols mean an individual doesn’t have a specific trait.
Benefits of pedigree diagrams
Pedigree diagrams can help doctors identify and diagnose diseases.
For example, let’s say someone has a family history of heart disease. A pedigree diagram will tell us whether this individual is likely to have a heart condition. This can help doctors diagnose and treat patients faster, then provide better healthcare.
In science, pedigree diagrams can help understand how traits are inherited.
For example, dimples may pass from father to son in one family, and from mother to daughter in another. Blonde hair might pass from grandparents to grandchildren, but not from parents to children. Pedigree diagrams make patterns like these easy to identify.
Create your own pedigree diagram
Miro’s is the perfect starting point for a pedigree diagram. Get started by opening the template on this page and following the steps below.
Step 1:
Add individuals to your pedigree diagram. Go with as many as you can — or as many as are relevant. Place older generations at the top and younger ones below them.
Males are represented by squares. Females are represented by circles.
You can always use Miro to change symbols around later, so if you make a mistake, don’t worry. Just try to be as thorough as possible.
Step 2:
Connect individuals using lines of marriage and descent. A straight horizontal line represents the marriage between two individuals.
Descent is represented by diagonal and vertical lines that connect a couple from an older generation to a younger individual.
Step 3:
Add dates. This isn’t strictly necessary, but it can help keep track of individuals across generations.
Add dates of birth, death, and/or marriage lines to your pedigree diagram template.
Step 4:
Use symbols to show which family members have or don’t have a specific trait.
For example, let’s say your pedigree diagram shows widow’s peaks. Family members who don’t have a widow’s peak will be represented by unshaded symbols. Family members who do have a widow’s peak will be represented by a shaded symbol.
Once you’re ready to collaborate and receive feedback, use Miro to share your Pedigree diagrams. You may want to also create a family tree to share other details of your family.
Example of pedigree diagram
Let’s imagine the Smith family has a long history of diabetes. But, some members of the family develop the condition, while others don’t.
We can use a pedigree diagram to see the pattern of inheritance, i.e., how the disease is passed from parent to child.
This can help us predict whether a given Smith family member has diabetes or will develop it in the future.
How do you draw a Pedigree Diagram?
Open our Pedigree Diagram template. Map out a family tree using lines to show familial relationships. Once you’re done, identify individual genetic traits using Pedigree Diagram shapes and shading.
What do the symbols in a Pedigree Diagram mean?
A square represents a male; a circle indicates a female. Shaded shapes mean someone has a genetic trait. Unshaded shapes mean an individual doesn’t have a trait. A half-shaded shape means that someone carries a genetic trait without it being visible.
What is the purpose of a Pedigree Diagram?
A Pedigree Diagram is a family tree that shows how genes are passed from generation to generation. It can help us predict the likelihood of a child having a disease or trait, e.g., dimples or diabetes. It can also help us see how traits are passed from parents to children.
Is a circle male or female in Pedigree Diagrams?
In Pedigree Diagrams, a circle is always female. This is universal for all organisms, including trees and flowers. Males are represented by squares.
What do dark circles mean on a Pedigree Diagram?
A dark circle represents a female that has a visible genetic trait. For example, a woman who has her father’s blonde hair or her mother’s dimples might be represented by a dark circle.
Get started with this template right now.

Azure Architecture Diagram Template
Works best for:
Software Development, Diagrams
The Azure Architecture Diagram Template is a diagram that will help you visualize the combination of any data and build and deploy custom machine learning models at scale. Azure is Microsoft’s cloud computing platform, designed to provide cloud-based services such as remote storage, database hosting, and centralized account management. Use Azure Architecture Diagram template to build sophisticated, transformational apps.
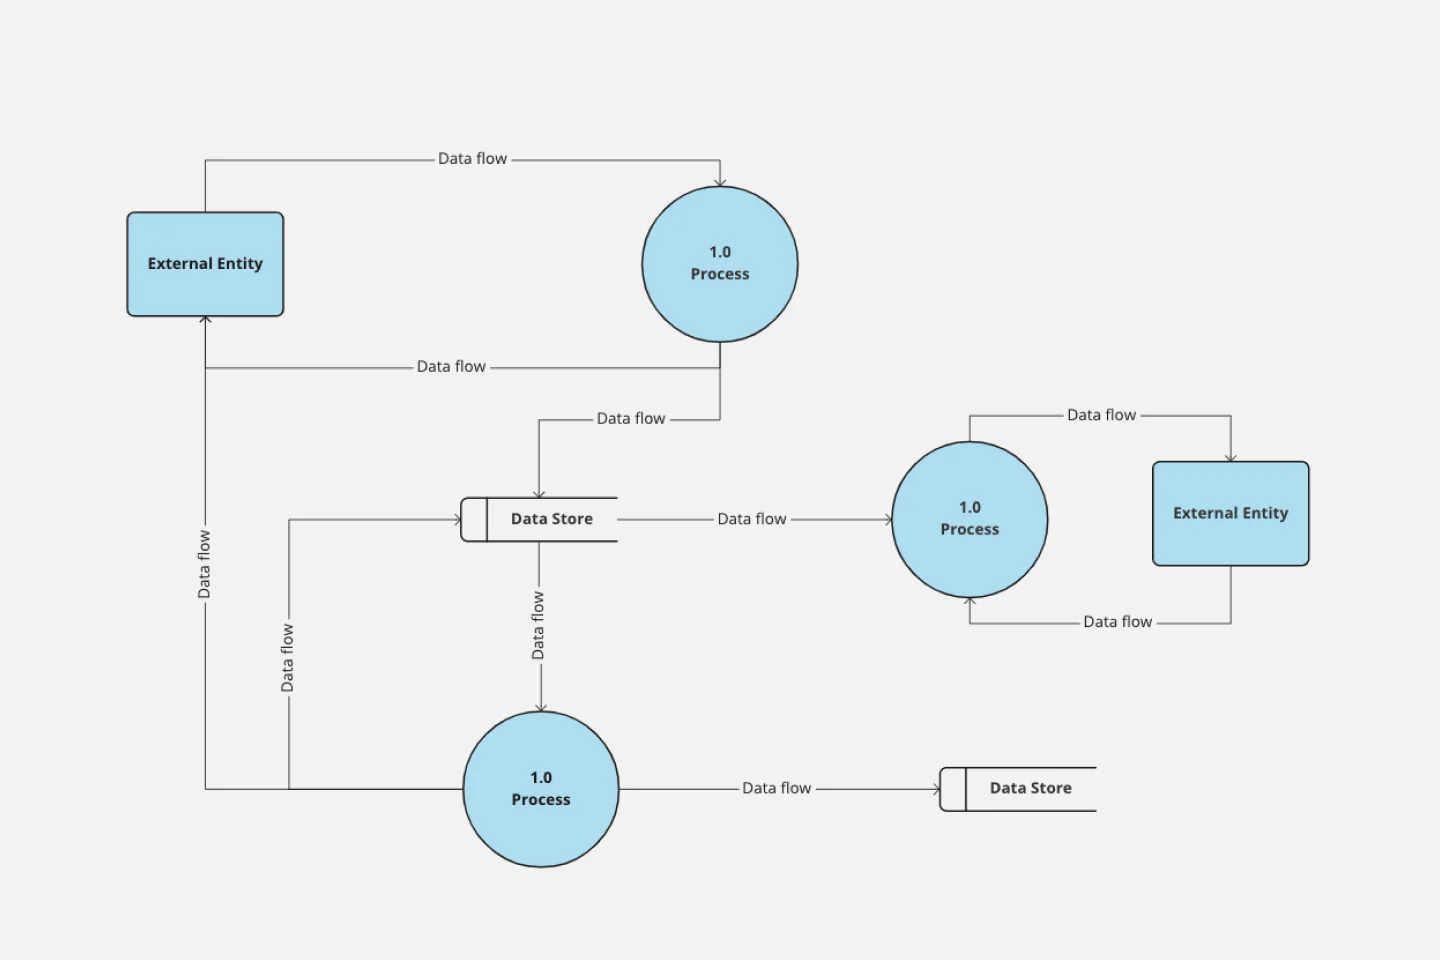
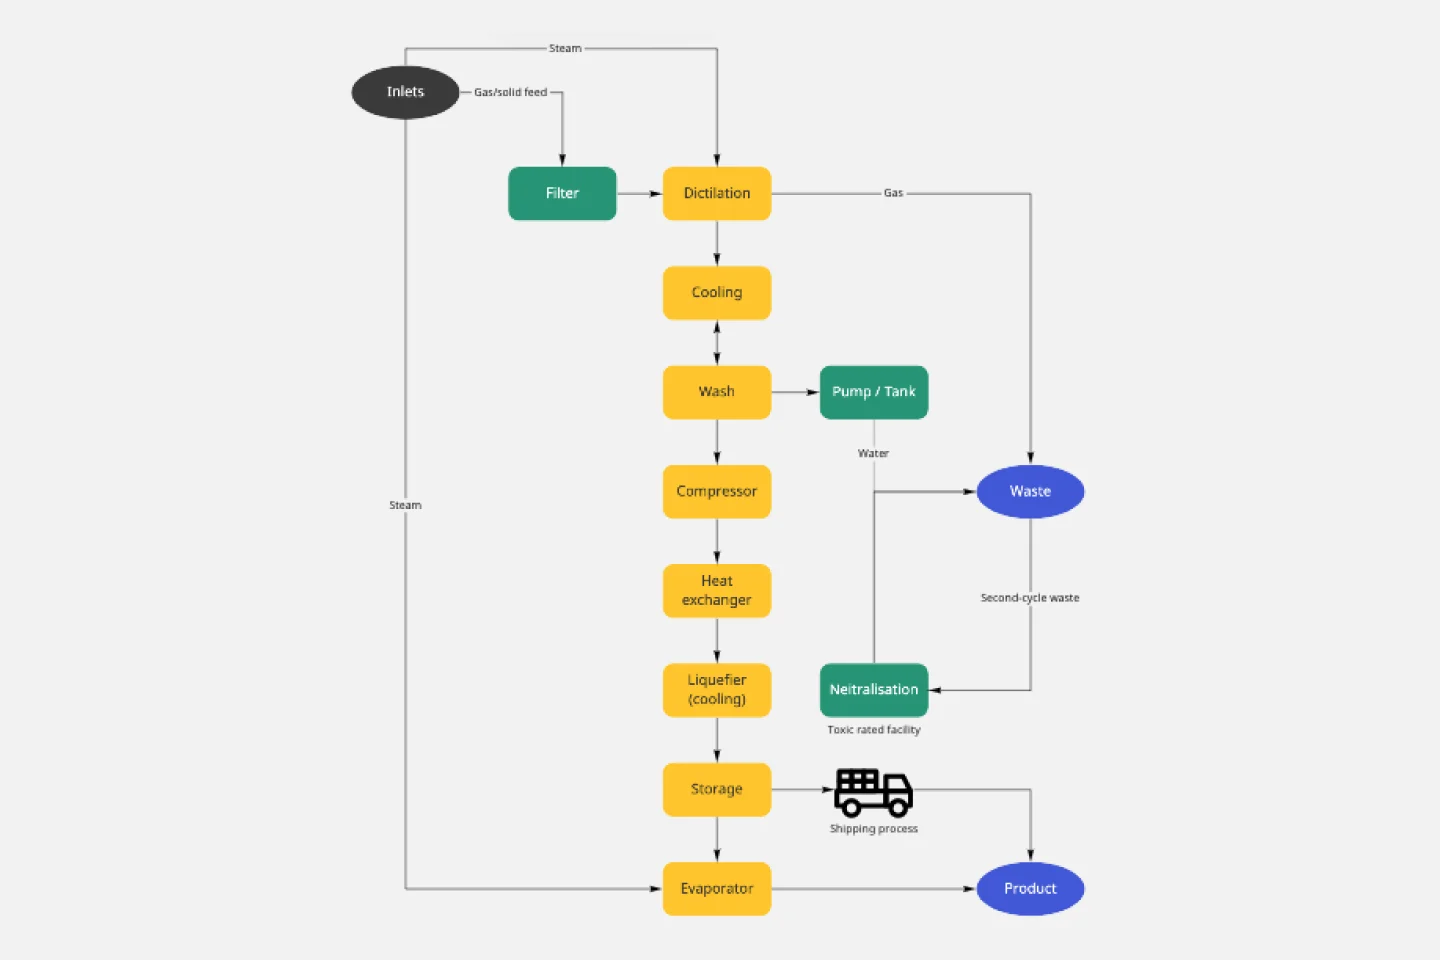
Data Flow Diagram Template
Works best for:
Flowcharts, Software Development, Diagrams
Any process can get pretty complex, especially when it has multiple components. Get a better grasp of your process through a data flow diagram (DFD). DFDs create a simple visual representation of all components in the flow of data and requirements in an entire system. They’re most often used by growth teams, data analysts, and product teams, and they’re created with one of three levels of complexity—0, 1, or 2. This template will help you easily build the best DFD for your process.
Web Diagram Template
Miro's Web Diagram Template simplifies complex project organization and promotes effective communication. It allows users to easily connect elements and gain a comprehensive understanding of complex relationships, making it a versatile and invaluable asset for diverse projects.
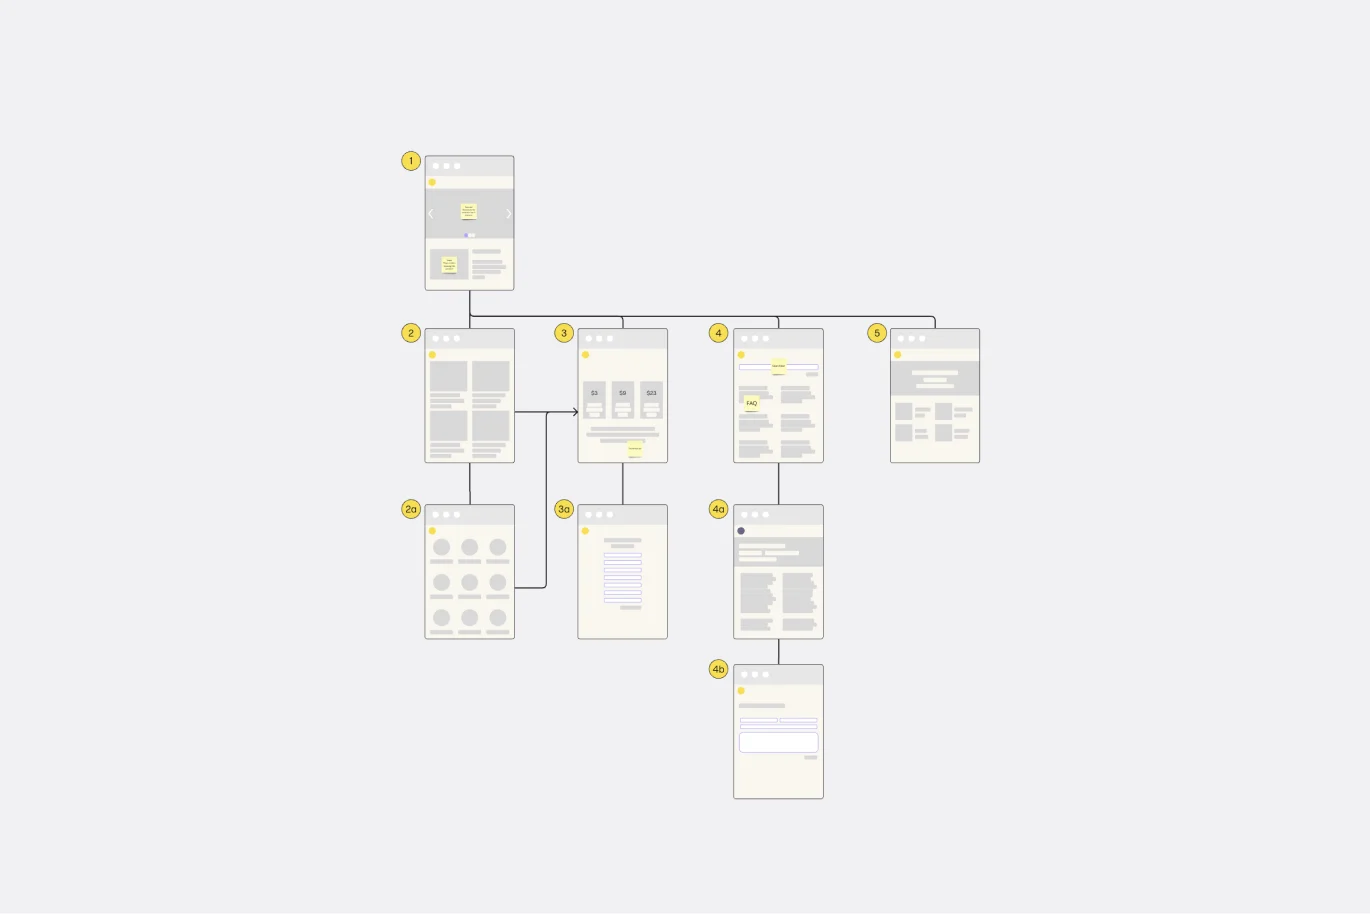
Website Flowchart Template
Works best for:
Flowcharts, Mapping, User Experience
A website flowchart, also known as a sitemap, maps out the structure and complexity of any current or future website. The flowchart can also help your team identify knowledge gaps for future content. When you’re building a website, you want to ensure that each piece of content gives users accurate research results based on keywords associated with your web content. Product, UX, and content teams can use flowcharts or sitemaps to understand everything contained in a website, and plan to add or restructure content to improve a website’s user experience.
Block Diagram Template
Works best for:
Mapping, Software Development, Diagrams
Use this template to illustrate technical systems. Blocks represent important objects in the system, and arrows demonstrate how the objects relate to each other. Perfect for engineers, workflow managers, or anyone trying to build a better process.
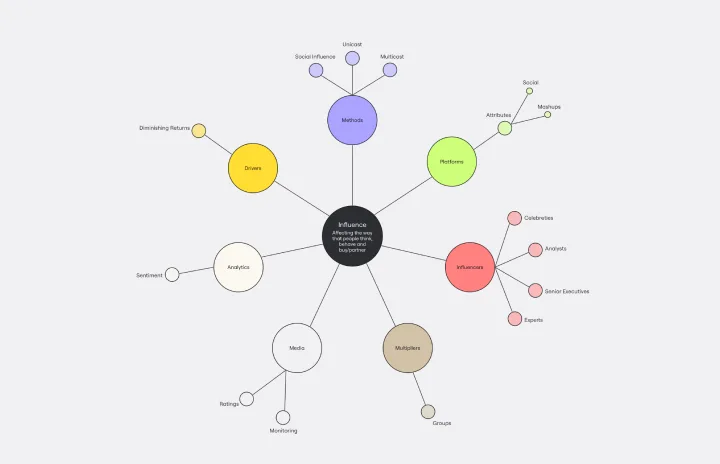
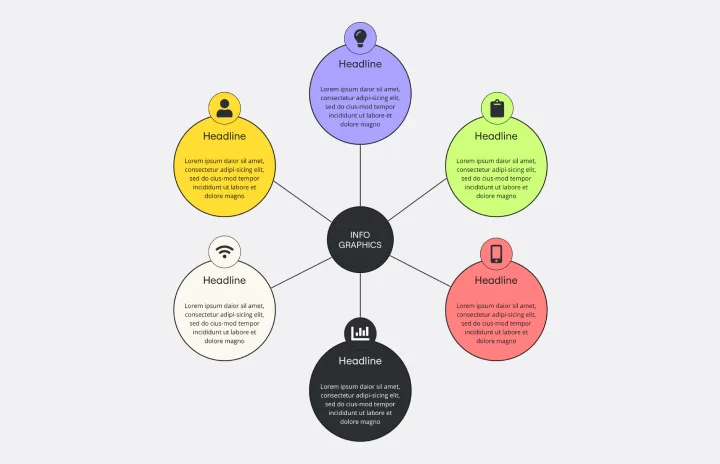
Cluster Diagram Template
Works best for:
Diagramming
The Cluster Diagram Template is a valuable tool for organizing and connecting ideas, concepts, and information in a visually compelling and coherent manner. The template's design centers on grouping related ideas around a core concept, creating a transparent and hierarchical structure. This clustering not only aids in breaking down complex information into manageable segments but also significantly enhances the process of idea generation and brainstorming. A structured yet flexible visual framework encourages deeper engagement and more precise understanding, making it an essential asset for teams and people looking to bring order to their creative and analytical processes. I have checked the text for any potential spelling, grammar, and punctuation errors, and it's good to go.