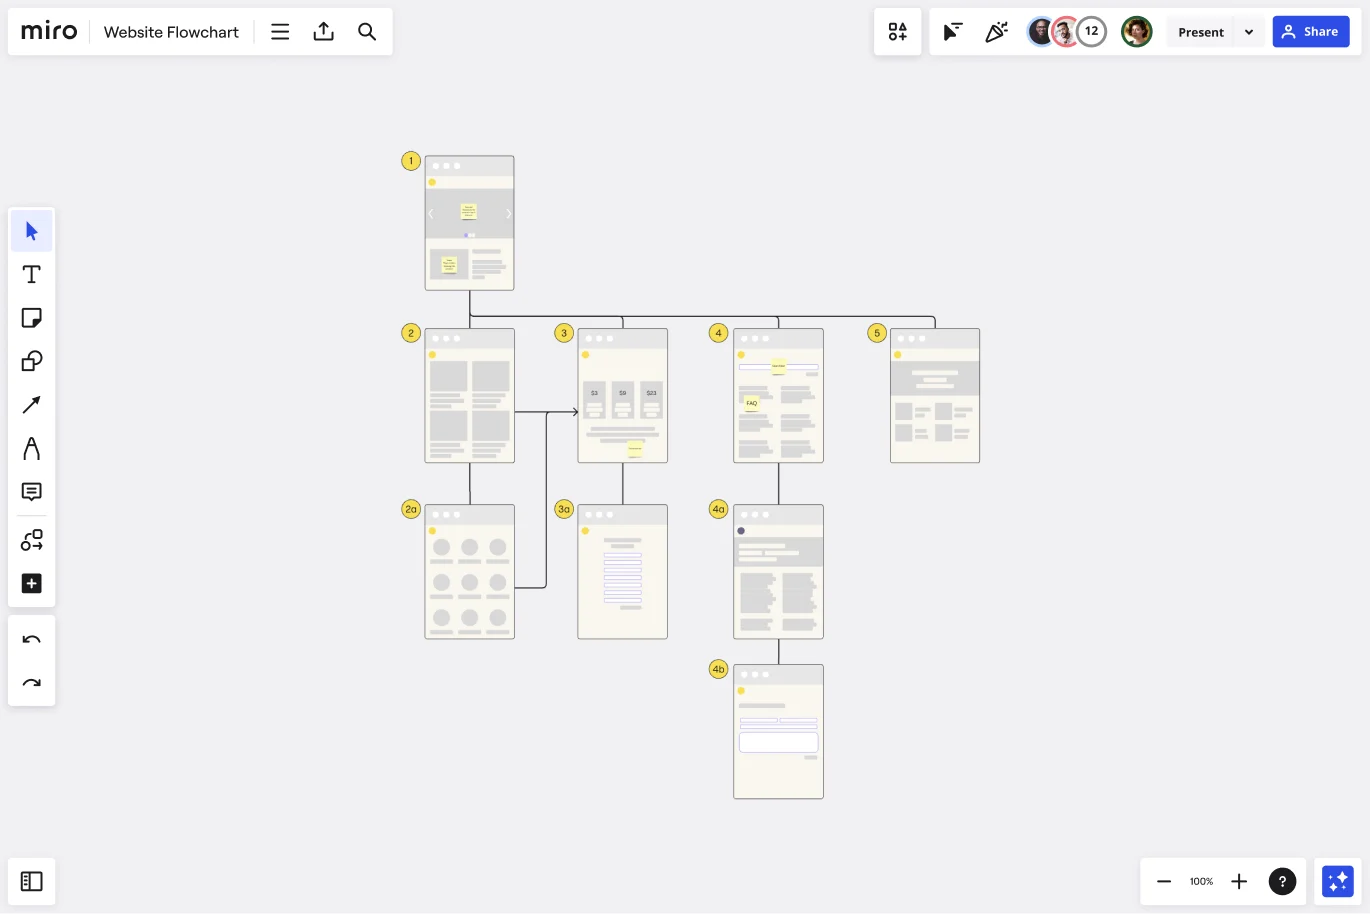
Website Flowchart Template
Organize and clarify your website content with the Website Flowchart Template. Build user-centric experiences and have customers always coming back.
Trusted by 65M+ users and leading companies


About the Website Flowchart Template
A website flowchart (also known as a sitemap) maps out the structure and complexity of your current or future website.
A well-structured sitemap or flowchart makes your website easily searchable. Each piece of content should ideally give users accurate search results, based on keywords connected to your web content.
Product, UX, and content teams use flowcharts or sitemaps to understand everything contained in a website, and plan to add or restructure content to improve a website’s user experience.
Keep reading to learn more about website flowcharts.
What is a website flowchart?
A website flowchart can be used as a planning tool to help organize and clarify existing content, and get rid of unnecessary or duplicate content. The flowchart also helps your team identify knowledge gaps for future content.
Website flowcharts help you stay focused on your user and your goals when working on website projects, from website launches, audits, or redesigns.
Ideally, your users shouldn’t be confused when navigating your website (whether it’s their first time or a returning visit), or interacting with any of your content. Website flowcharts help you spot areas of friction or dead-end points across user flows.
Create your own website flowchart
Making your own website flowchart is easy and Miro is the perfect flowchart creator. Get started by selecting the Website Flowchart Template, then take the following steps to make one of your own.
1. Clarify your website’s purpose and goals
Websites should be focused and easy to navigate. Ask your team to articulate your website’s high-level goals and purpose on sticky notes. These can be broken down into specific, color-coded goals for each webpage. Your sitemap should help you determine whether every page on your website truly reinforces your goals.
2. Add website wireframes and set your website flow
You can build your website flowchart based on a website wireframe or build a quick mock-up with the shapes and images from our library. Make sure what you build is showing your user experience accurately and indicates flow direction with arrows.
3. Identify duplicate content and flag it for review
Use the number labels on each webpage to map out the user flow or rank the relevance of each website from highest to lowest possible. Flag duplicate content with relevant symbols like emojis to mark potential conflicting information or pages that don’t convert.
4. Streamline your conversion funnel
After you’ve finished adding the necessary new pages to your sitemap, map out and combine any duplicate steps a user must take to complete a sign-up or purchase. The fewer steps, the sooner your potential user can convert. In this step, it’s also helpful to build a customer touchpoint map.
5. Share your sitemap cross-functionally
Lots of people are involved in website launches, audits, or redesigns: from web designers, project managers, and developers, to copywriters, and sales and marketing (at least!). To align everyone on the goals and progress of your website project, keep the flowchart visible and easily accessible to all.
Why use a website flowchart?
A sitemap can help your product, UX, or content teams:
Clarify content themes or focuses so the user understands your products and services
Reduce broken links across your website
Streamline the conversion funnel so the user takes fewer steps before converting
Maintain higher search engine rankings by planning regular content refreshes to maintain a competitive edge
Kickstart a new business or initiative, especially since sitemaps help content get discovered faster
Invite cross-functional input and collaborate, as the needs of the users and website or content architecture evolve
Use your website flowchart as a web design project tracker, too. Keep an eye on finalized website elements, what areas need development, and how much your team progresses.
How do you create a flowchart for a website?
There are many ways to create a website flowchart, but some of the best practices include conducting user research to understand your customer’s pain points, and collaborating with other teams such as design, product, and development to assess what’s feasible or not. Finally, test your prototypes, to be sure your website flowchart is good, user-friendly, and will reach your company’s goals.
Get started with this template right now.
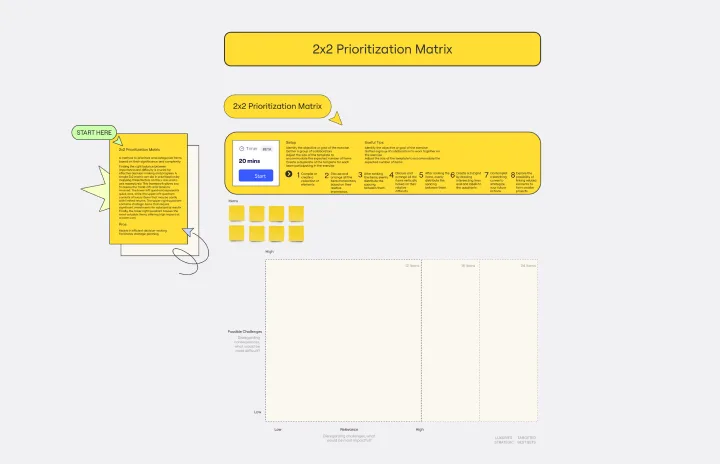
2x2 Prio Matrix Template
Works best for:
Design
Understanding the balance between importance and difficulty is crucial for effective decision-making and progress. To aid in prioritization, a simple 2x2 matrix can map these factors on the x-axis and y-axis, respectively. This framework allows you to assess the trade-offs and tensions involved. The lower left quadrant represents quick wins, while the upper left quadrant consists of luxury items that may be costly with limited returns. The upper right quadrant contains strategic items that require significant investments for substantial results. Finally, the lower right quadrant houses the most valuable items, offering high impact at a lower cost.
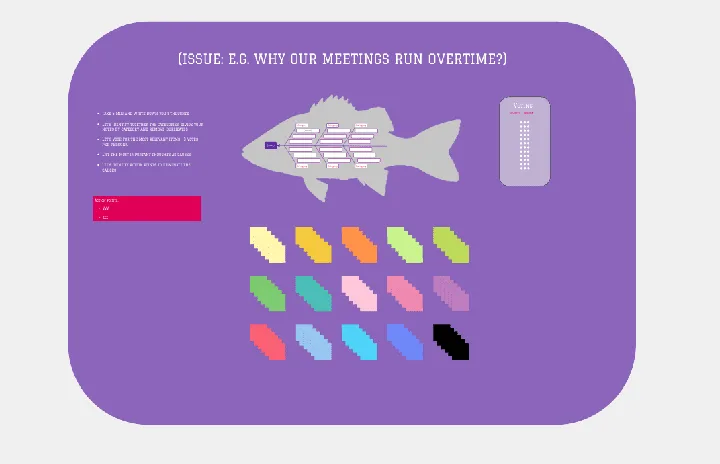
Fishbone Diagram by Hanna Havulinna
Works best for:
Diagramming
The Fishbone Diagram template, also known as the Ishikawa or Cause-and-Effect diagram, offers a visual tool for identifying and analyzing root causes of problems or issues. It provides a structured framework for categorizing potential causes into major categories such as people, process, environment, and equipment. This template enables teams to conduct root cause analysis systematically, facilitating problem-solving and decision-making. By promoting a structured approach to problem analysis, the Fishbone Diagram empowers teams to address issues effectively and implement corrective actions efficiently.
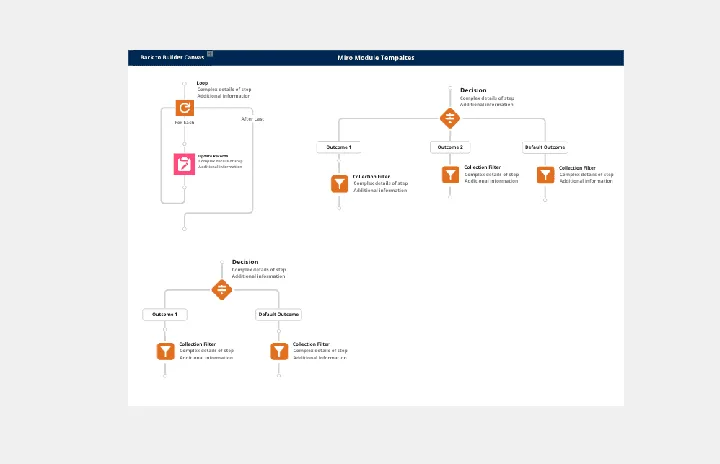
Salesforce Flow Builder
Works best for:
Flowcharts, Mapping, Diagrams
The Salesforce Flow Builder template offers a visual tool for designing and automating business processes within the Salesforce platform. It provides elements for creating flowcharts that represent process flows, decision logic, and data transformations. This template enables Salesforce administrators and developers to streamline workflows, improve productivity, and enhance user experiences. By promoting automation and efficiency in Salesforce process design, the Salesforce Flow Builder empowers organizations to leverage the full potential of the Salesforce platform and drive business success effectively.

2-Circle Venn Diagram Template
The 2 Circle Venn Diagram Template is a dynamic, intuitive tool designed to represent the logical relationships between two data sets visually. For teams, this template proves valuable in enabling efficient collaboration, clear communication, and shared understanding.
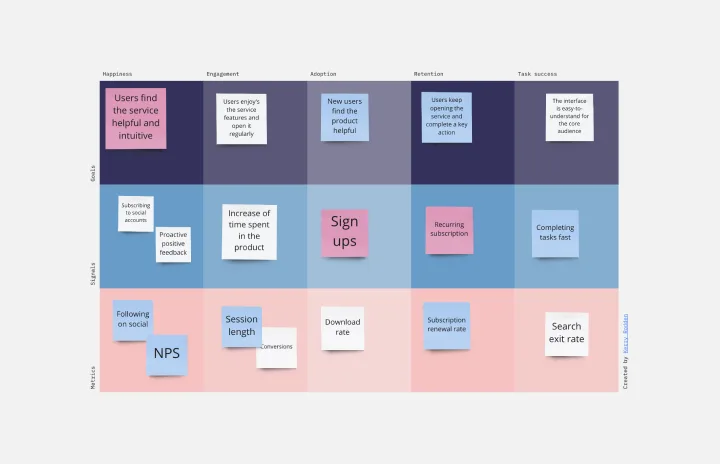
HEART Framework Template
Works best for:
Desk Research, Project Management, User Experience
Happiness, Engagement, Adoption, Retention, and Task Success. Those are the pillars of user experience — which is why they serve as the key metrics in the HEART framework. Developed by the research team at Google, this framework gives larger companies an accurate way to measure user experience at scale, which you can then reference throughout the product development lifecycle. While the HEART framework uses five metrics, you might not need all five for every project — choose the ones that will be most useful for your company and project.
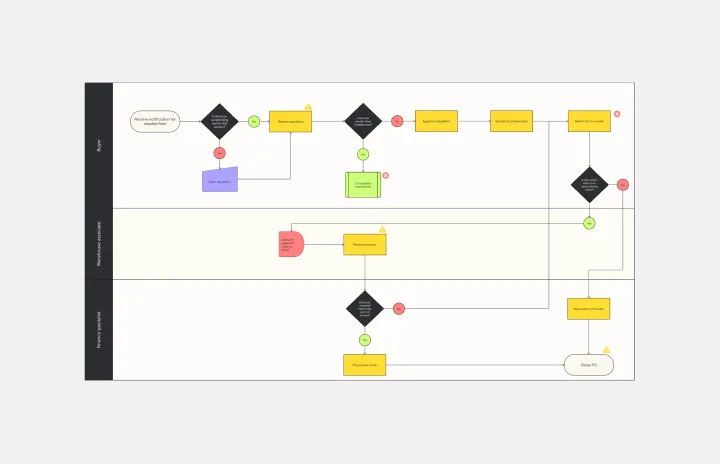
Current State vs. Future State Flowchart Template
Works best for:
Diagramming
The Current State vs Future State Flowchart Template is an essential tool for strategic planning, providing teams with a dynamic and visual roadmap for organizational transformation. One of its key benefits is streamlining collaboration by using swimlanes to allocate tasks to specific departments. This feature promotes accountability and transparent communication, ensuring everyone is aligned on their responsibilities. As a result, teams can navigate complex processes with ease, fostering a shared understanding of the current and future states, ultimately leading to efficient and collaborative decision-making.