DMAIC Analysis Template
Use the DMAIC process (or Six Sigma Map) to solve problems using a structured approach. The letters in the acronym represent the five phases that make up the process.
Trusted by 65M+ users and leading companies


About the DMAIC template
From software development to manufacturing, the DMAIC Template helps project teams improve their processes. While it’s part of the Six Sigma initiative (a method for improving the manufacturing process), it’s now widely adopted as a quality improvement procedure.
Using this five-step framework, you can identify and address inefficiencies in processes across your entire business. As a result, you’ll improve the quality of your deliverables and help your business get better results.
What is a DMAIC analysis?
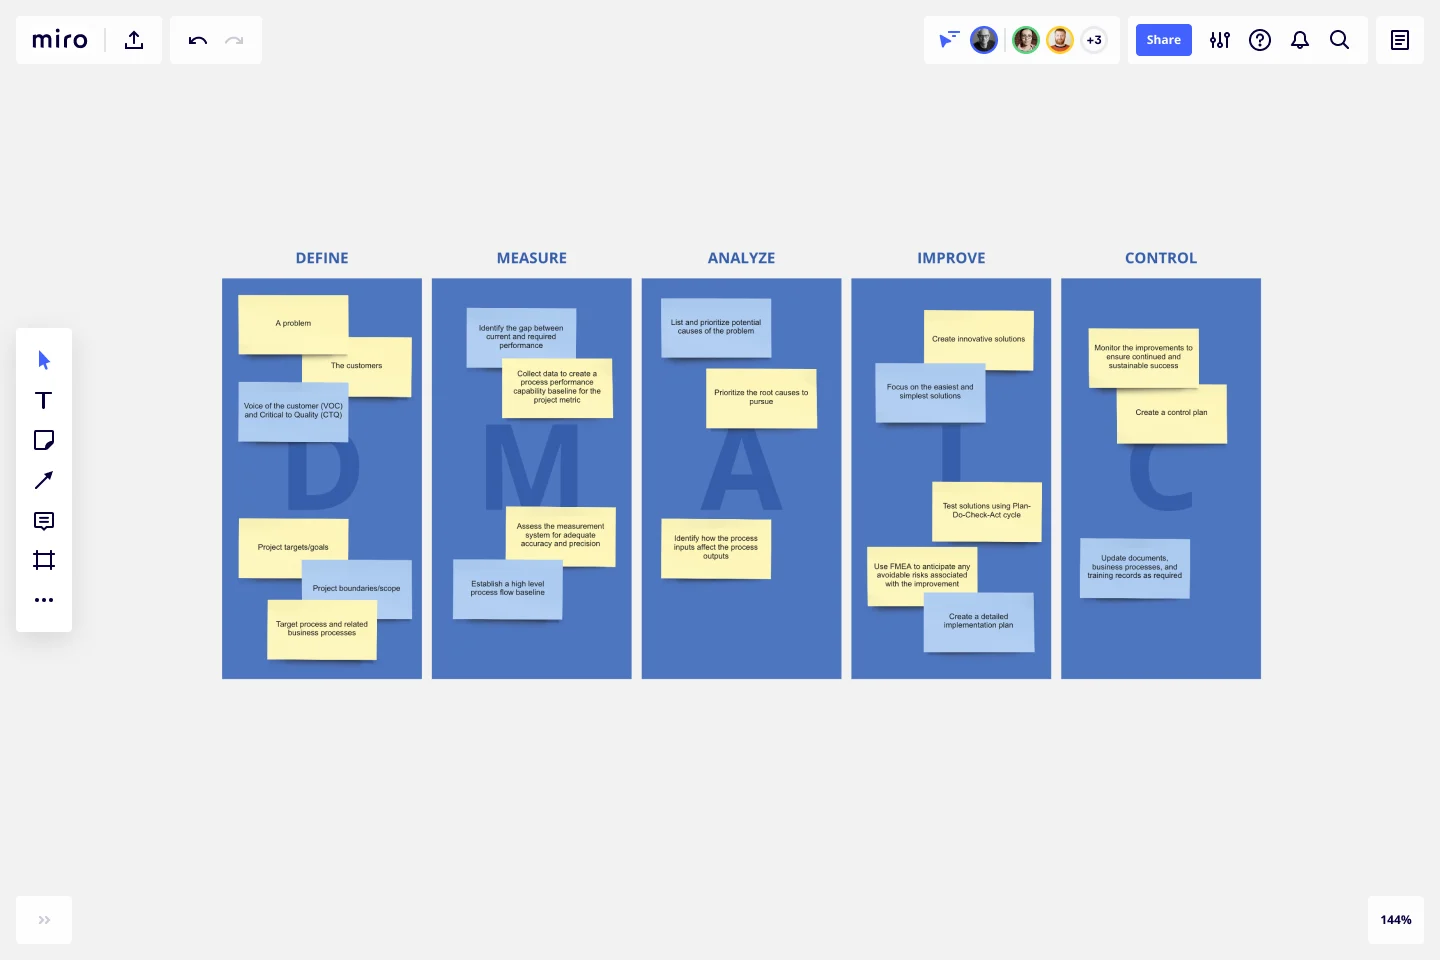
DMAIC is an acronym for Define, Measure, Analyze, Improve, and Control. Performing a DMAIC analysis allows businesses to do the following:
Improve existing processes
Identify new processes
Perform structured change management
A DMAIC analysis is a data-driven quality strategy. It strongly emphasizes measurement and analysis, helping companies identify process improvement initiatives based on real data. This makes sure that any changes have the most positive impact on the business.
The 5 factors of DMAIC
To better understand the DMAIC process, let’s outline the five main steps in more detail. To perform a successful DMAIC analysis, you must follow the process steps in this order.
1. Define: Start by defining your team’s project, problems, and goals. Be as specific as possible. The more specific you are, the easier it’ll be to solve each concrete problem and complete the project. You can use the SMART goals template to make sure your project goals are specific, and take a look at this Problem Framing Template to identify your challenges. You should also outline your project scope in a project charter to clearly display all the key project information.
2. Measure: During the Measure phase, you need to figure out how to measure the solution. What key metrics can you track? How will you know whether you have succeeded? You need these in place to track progress and measure success.
3. Analyze: With your measurements in place, it’s time to analyze the data. This will help you identify the root cause of your problem. Start by listing and prioritizing potential causes of the problem. Then, prioritize root causes (or key process inputs) and identify how they affect outputs. You can use process maps to analyze your existing processes better.
4. Improve: By the time you reach this step, you’ll probably already have a possible solution to your process. Now, it’s time to visualize how it’ll pan out. Review the solutions and anticipate how each of them will perform. If you find potential consequences, you might have to go back to the Measure or Analyze steps. If things look good, take the necessary steps to improve your process.
5. Control: After the Improve stage, you need to Control the process. Monitor the improvements and adjust as needed to ensure continued and sustainable success.
Although DMAIC may be sequential, it’s not always linear. For example, if you get to the Improve stage and realize that your solutions aren’t viable, you’ll have to backtrack to a previous stage.
This is where using a template can be helpful. You can easily track the process and visualize everything in one location. If you need to go back or make changes to the process, it’s easy to do.
Why use a DMAIC Template?
A DMAIC analysis is complex. There are a lot of moving parts to analyze and different solutions to contend with.
A DMAIC Template makes the process easier to manage. Here’s how:
Easily identify opportunities. The clear structure and format of a DMAIC Template make it easier to spot areas of improvement and opportunities for the future.
Standardize the process. Create consistency across the business by using the same template. This makes it easier for everyone in the business to perform a DMAIC analysis and fully understand the process.
Display information professionally. If you need to share your findings with key stakeholders or clients, using a professional and visually-appealing template gives them a good impression. It also helps them understand the analysis and visualize your plan of action.
Increase efficiency. Instead of creating a document from scratch, a ready-made template allows you to get straight into identifying areas for improvement. You’ll spend less time figuring out how to design the analysis and more time doing it.
Create a DMAIC analysis with Miro
Miro’s digital workspace is the perfect location for collaborative teams to plan and share new ideas. Using our DMAIC template, you can easily share your analysis and identify the best process improvements with your team.
Here’s how it works:
Step 1: Select this template. Get started by selecting this DMAIC template. It’s free to use, and you can easily customize it to your team’s specific needs. Drag and drop items, add new text, or upload your own files and visuals.
Step 2: Add the relevant information. Populate the template with all the information you have from your DMAIC analysis. You can add charts, images, and any other relevant information.
Step 3: Share the template with your team. Get your team involved in the process and share the template. They can access the template from anywhere and add visual notes with questions or feedback.
Step 4: Collaborate and make changes. If your team has any feedback, dedicate some time to discussing their thoughts. When you’re all on the same page, make any necessary changes to the analysis.
Step 5: Create a plan of action. With your DMAIC analysis in place, it’s time to create an action plan for the future. This will outline how you plan to make improvements to your processes.
Connect teams, optimize business processes, and scale your organization with Miro's process mapping tool.
Who should use DMAIC?
A Project Manager usually uses DMAIC to improve project processes. Ultimately, anyone that wants to improve their business processes can use it.
Get started with this template right now.
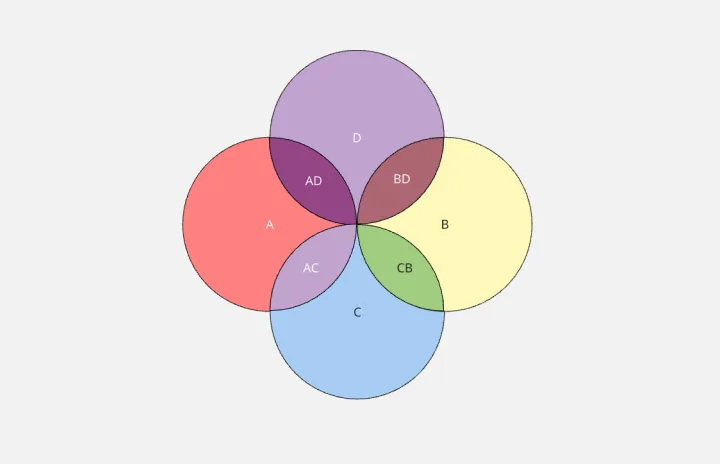
4-Circle Venn Diagram Template
Works best for:
Diagramming, Mapping, Brainstorming
The 4-Circle Venn Diagram Template has an easy, interactive, and dynamic way to visualize complex relationships between data sets. Empower your team's collaboration and communication with this powerful tool.
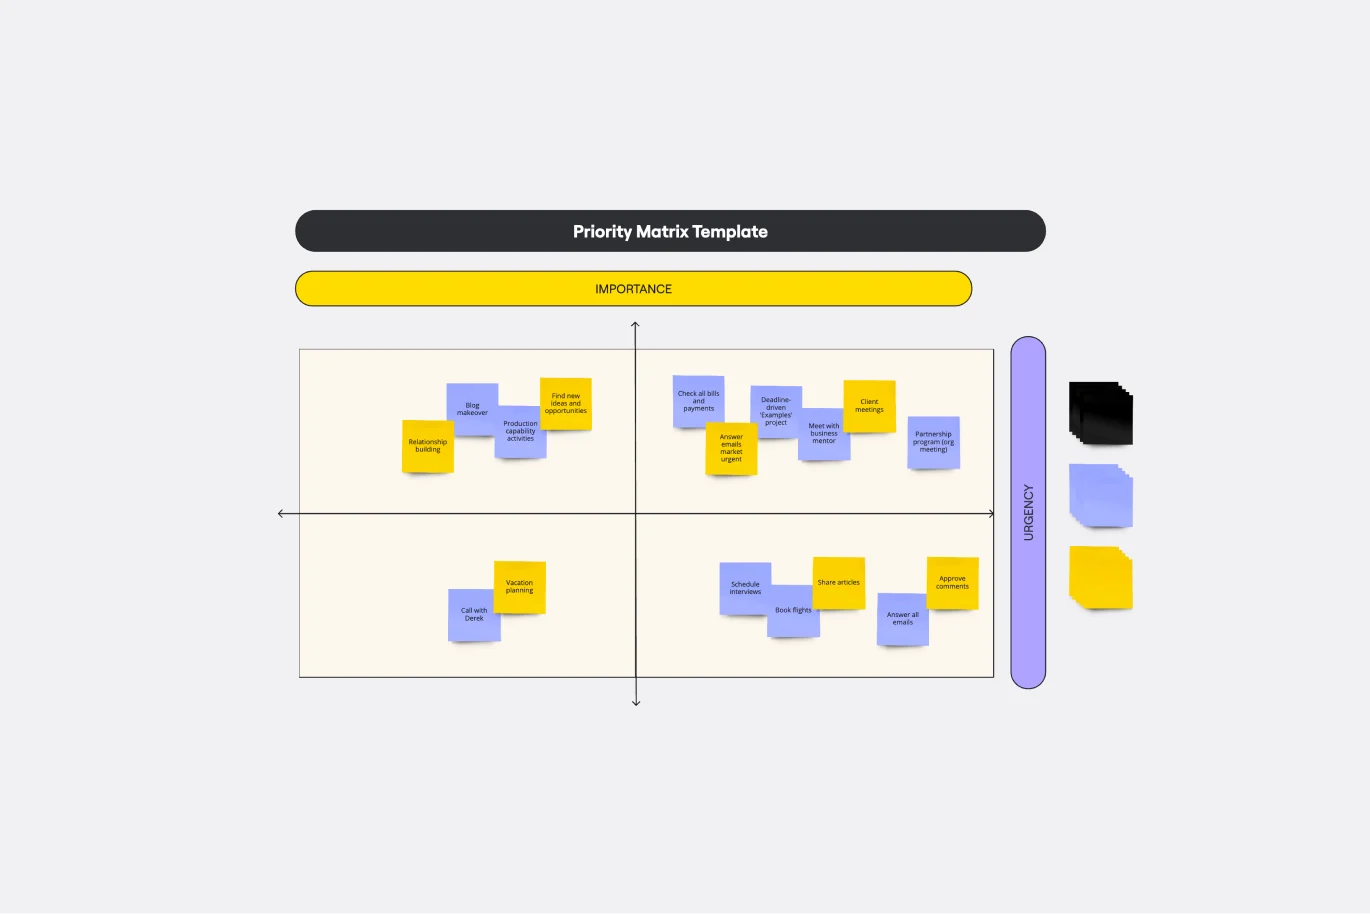
Priority Matrix Template
Works best for:
Business Management, Strategic Planning, Prioritization
If you need a little more than a basic to-do list, then you’d probably benefit from a Priority Matrix. The Priority Matrix template is designed to help you determine which tasks are critical so you can focus on the most urgent needs. In a 2x2 matrix, input your priorities based on whether they must be completed with high or low urgency and are of high or low importance. Applicable to project management and personal management alike, use the Priority Matrix template to improve business processes, create efficiency, remove blockers, and reduce operational waste.

Easter Egg Retrospective
Works best for:
Agile Methodology, Retrospectives, Meetings
The Easter Egg Retrospective template offers a themed approach to retrospectives, incorporating elements of the Easter holiday. It provides elements for reflecting on past iterations, hunting for hidden insights, and brainstorming improvements. This template enables teams to have fun while addressing serious topics, fostering creativity and collaboration. By promoting a playful yet productive atmosphere, the Easter Egg Retrospective empowers teams to uncover hidden gems, drive improvement, and strengthen team cohesion effectively.
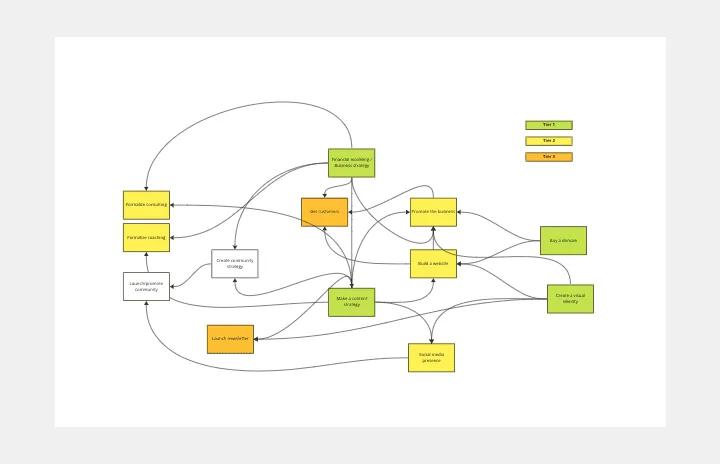
Interrelationship Diagram
Works best for:
Diagramming
The Interrelationship Diagram template is a visual tool for analyzing and illustrating complex relationships between variables or elements within a system. It provides a structured framework for mapping out connections, dependencies, and interactions. This template enables teams to visualize patterns, identify causal relationships, and uncover insights into system behavior. By promoting systems thinking and understanding of interdependencies, the Interrelationship Diagram empowers organizations to make informed decisions and drive effective solutions to complex problems.
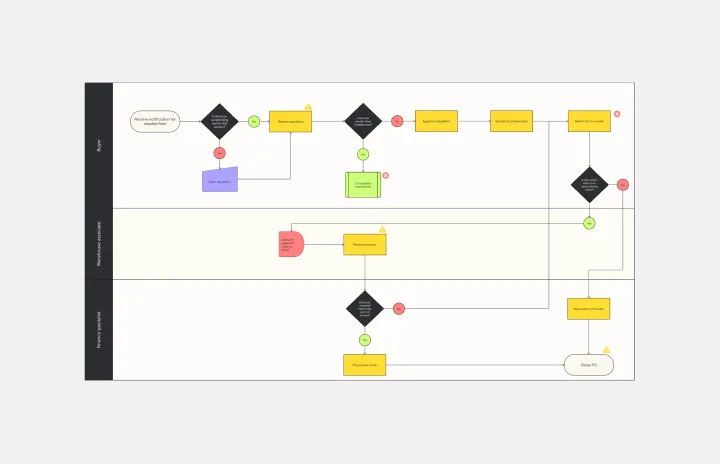
Current State vs. Future State Flowchart Template
Works best for:
Diagramming
The Current State vs Future State Flowchart Template is an essential tool for strategic planning, providing teams with a dynamic and visual roadmap for organizational transformation. One of its key benefits is streamlining collaboration by using swimlanes to allocate tasks to specific departments. This feature promotes accountability and transparent communication, ensuring everyone is aligned on their responsibilities. As a result, teams can navigate complex processes with ease, fostering a shared understanding of the current and future states, ultimately leading to efficient and collaborative decision-making.
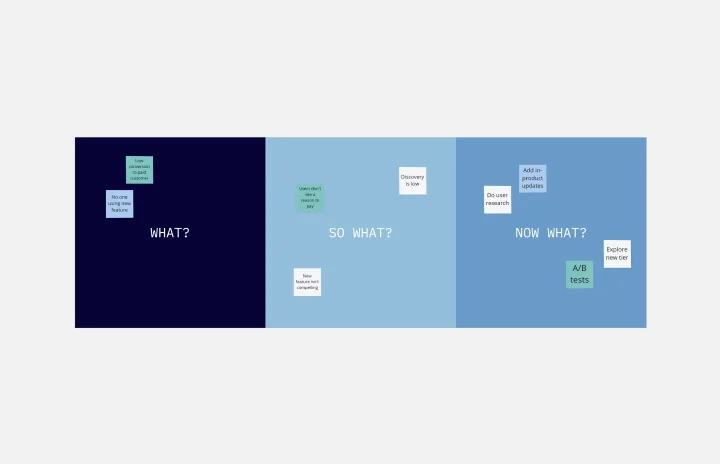
What? So What? Now What? Template
Works best for:
Agile Workflows, Retrospectives, Brainstorming
The What? So What? Now What? Framework empowers you to uncover gaps in your understanding and learn from others’ perspectives. You can use the What? So What? Now What? Template to guide yourself or a group through a reflection exercise. Begin by thinking of a specific event or situation. During each phase, ask guiding questions to help participants reflect on their thoughts and experience. Working with your team, you can then utilize the template to record your ideas and to guide the experience.