Kubernetes Architecture Diagram Template
Visualize the deployment of your applications with Kubernetes Architecture Diagram template and optimize your processes.
Trusted by 65M+ users and leading companies


About the Kubernetes Architecture Diagram Template
A Kubernetes Architecture Diagram template is where you can visually represent the deployment, scale, and management of containerized applications. You can use a Kubernetes Architecture Diagram template to manage apps and ensure there is no downtime in production.
This Kubernetes Architecture Diagram for K8 architecture helps you and your team manage the deployment of applications. This template can be used to organize applications and easily map out Kubernetes decentralized architecture.
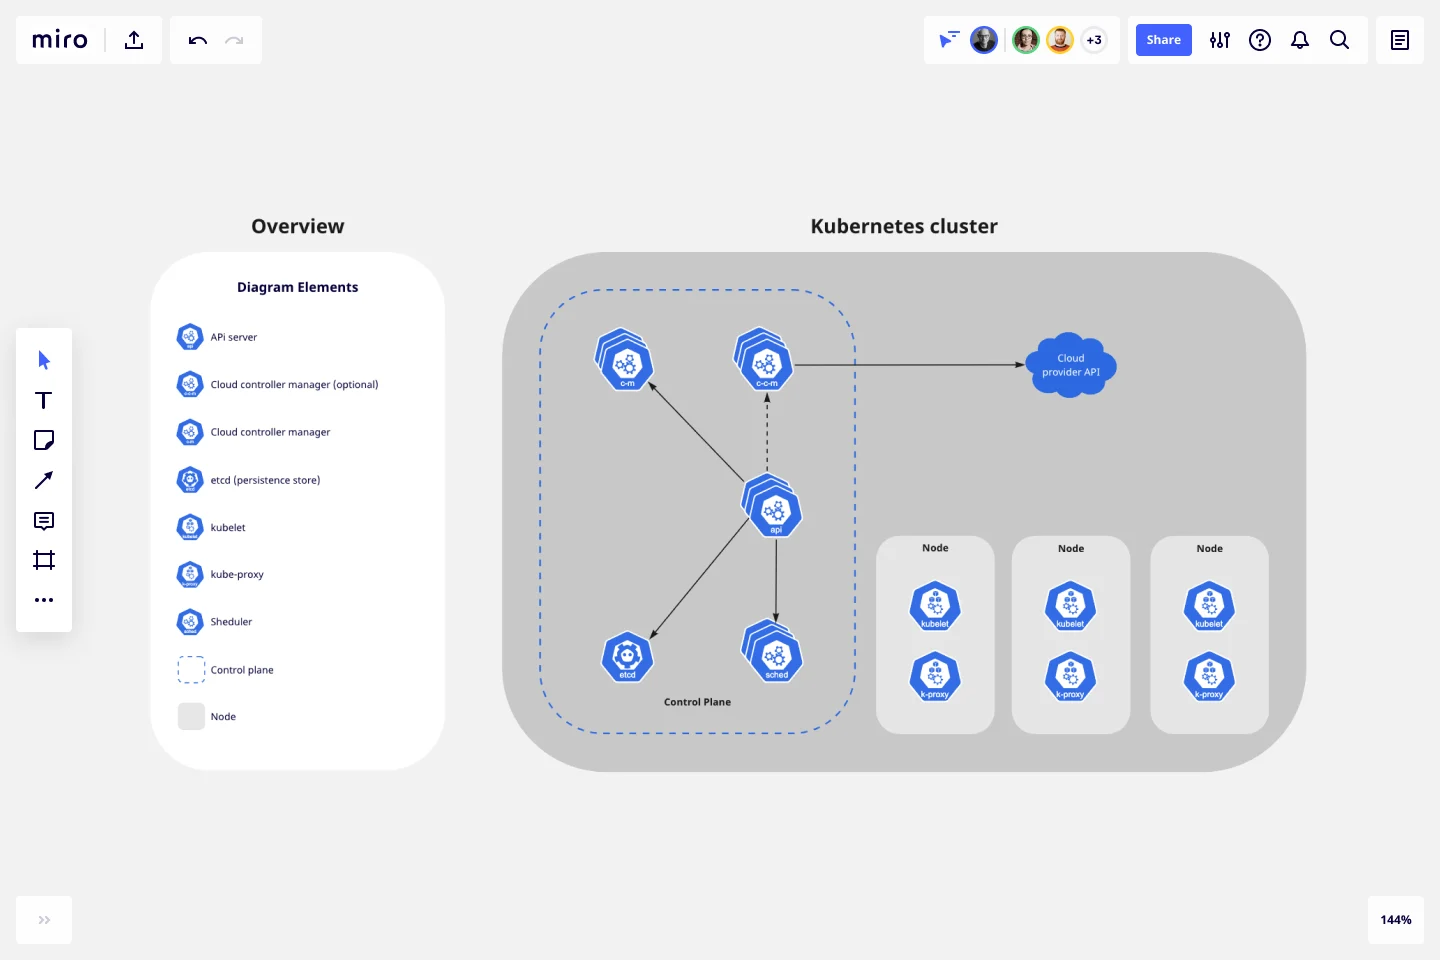
Kubernetes cluster architecture and components
When you deploy Kubernetes, you get a cluster which is a node that runs containerized applications.
Developers use containers because they provide extra benefits such as agile app creation, deployment, and continuous development and integration. Containers are coordinated automatically and monitored constantly, and the K8s architecture makes it easy to deploy and scale containerized applications.
The components of a Kubernetes Architecture Diagram template are:
Cloud controller manager: links your cluster to the cloud provider
Controller manager: makes global decisions about the cluster
Etcd (persistent store): backs store for all cluster data
Kubelet: runs each node in the cluster
Kube proxy: network proxy that runs in each node of the cluster
Scheduler: watches for newly created Pods with no assigned node, and selects a node for them to run on
Control place: runs controller processes
Node: provides Kubernetes runtime environment
How do I create a Kubernetes Architecture Diagram template?
A Kubernetes Architecture Diagram template allows you to visualize the deployment of apps.
To create a basic Kubernetes diagram with Miro, you can follow these steps:
Define your Kubernetes Architecture cluster.
List your Kubernetes components, using our set of Kubernetes Icons.
Organize your diagram, adding the components.
Add connection lines between the component shapes and set the arrows in the direction of the flow.
Format and customize your Kubernetes Architecture Diagram template.
In Miro, you can quickly build a Kubernetes Diagram from scratch using our design tools and icons set, or use our Kubernetes Architecture Diagram template and customize it as you see fit.
If you are interested in creating other network diagrams, Miro is the perfect network diagram tool with several available shape packs and templates to suit your needs.
How to create a Kubernetes diagram using this template?
In Miro you can create a Kubernetes Architecture Diagram using our template from our Templates Library or build your own diagram from scratch. Add Kubernetes icons by selecting our icons set on the left sidebar, connecting them with connector lines, and placing arrows in the flow direction. Miro’s collaborative whiteboard allows you to work together in real-time or asynchronously. Try it for yourself to see how it can work for you.
Why is it important to diagram Kubernetes architecture?
Developers create a Kubernetes Architecture Diagram to better manage and deploy application containers and continuously improve development, integration, and app deployment. Having a Kubernetes diagram helps to work across teams and to keep collaboration seamlessly when managing applications.
Get started with this template right now.
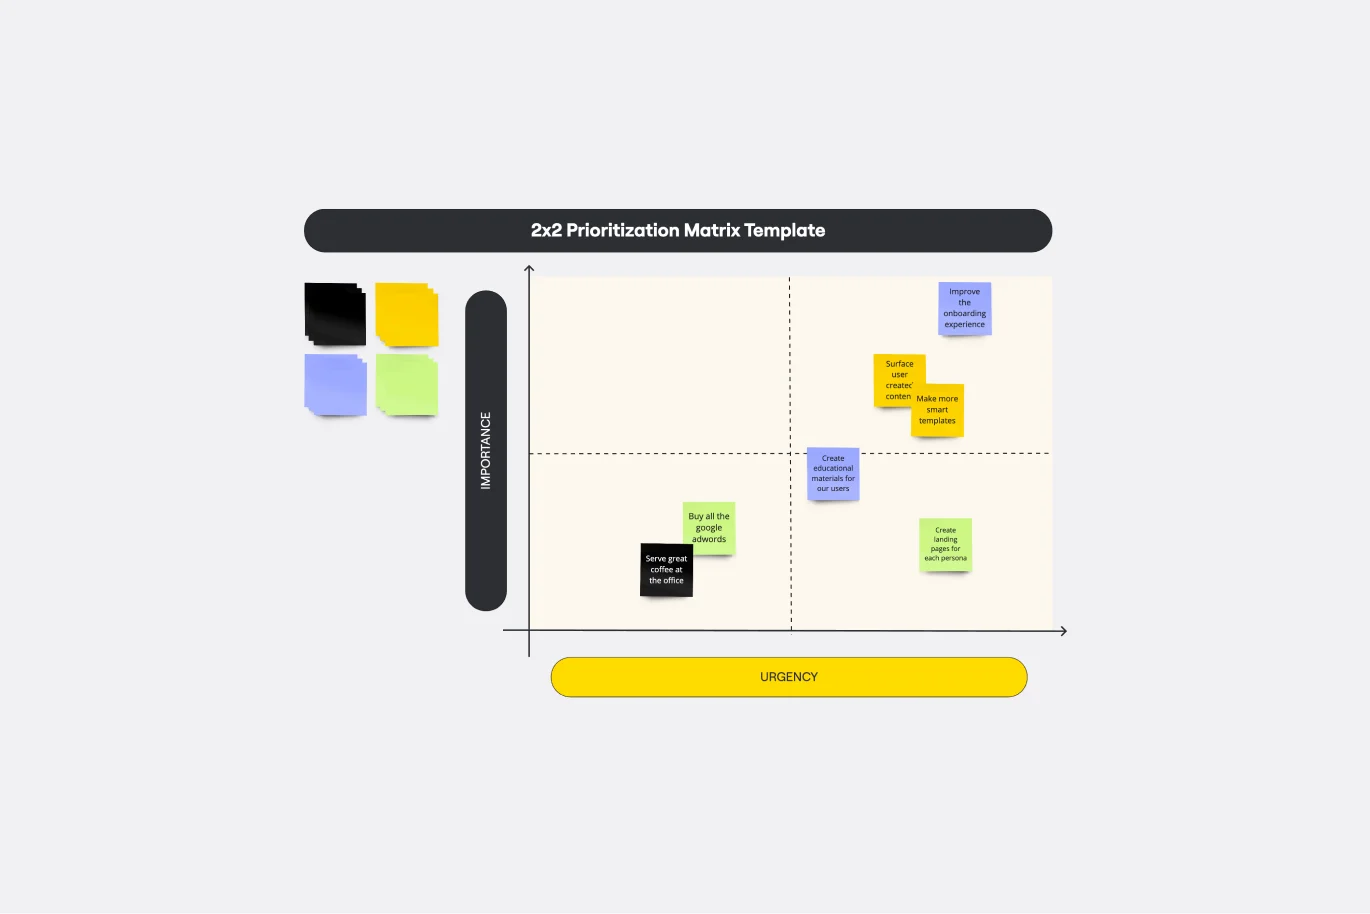
2x2 Prioritization Matrix Template
Works best for:
Operations, Strategic Planning, Prioritization
Ready to set boundaries, prioritize your to-dos, and determine just what features, fixes, and upgrades to tackle next? The 2x2 prioritization matrix is a great place to start. Based on the lean prioritization approach, this template empowers teams with a quick, efficient way to know what's realistic to accomplish and what’s crucial to separate for success (versus what’s simply nice to have). And guess what—making your own 2x2 prioritization matrix is easy.
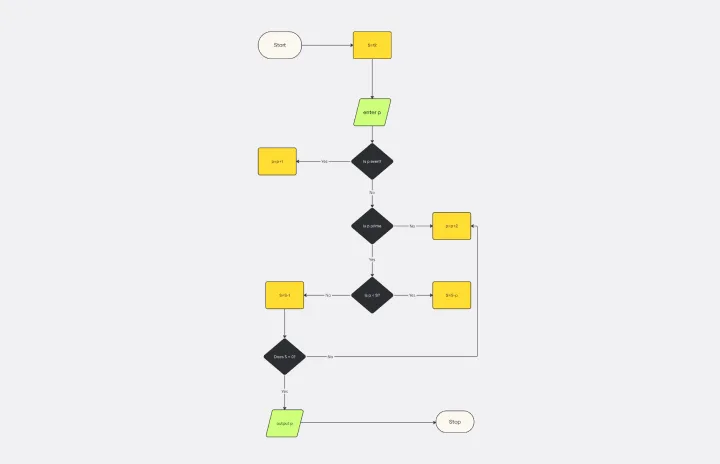
Algorithm Flowchart Template
Works best for:
Diagramming, Flowcharts
The Algorithm Flowchart Template is a useful tool for simplifying the process of creating and understanding complex algorithms. Its pre-structured format makes it easy to lay out each operation and decision point in a clear and easily understandable visual format. This is particularly helpful for explaining intricate processes to team members who may not be as technically proficient in the subject matter. With each step clearly defined within its designated shape, the flowchart promotes clarity and makes it easy to identify the logical flow at a glance. This clarity is the template's most significant advantage, reducing cognitive load and enabling a more inclusive and straightforward approach to discussing and refining algorithmic solutions.
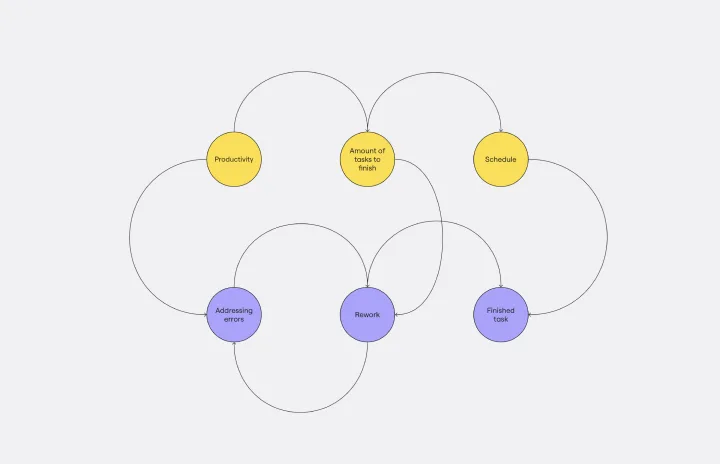
Causal Loop Diagram Template
Works best for:
Diagramming
The Causal Loop Diagram Template offers a structured framework to visualize the intricate interconnections within any system. Its standout benefit is the ability to provide a holistic perspective, ensuring that users don't just see isolated issues but understand the entire web of relationships, ultimately leading to more informed and strategic decision-making.

Azure Architecture Diagram Template
Works best for:
Software Development, Diagrams
The Azure Architecture Diagram Template is a diagram that will help you visualize the combination of any data and build and deploy custom machine learning models at scale. Azure is Microsoft’s cloud computing platform, designed to provide cloud-based services such as remote storage, database hosting, and centralized account management. Use Azure Architecture Diagram template to build sophisticated, transformational apps.
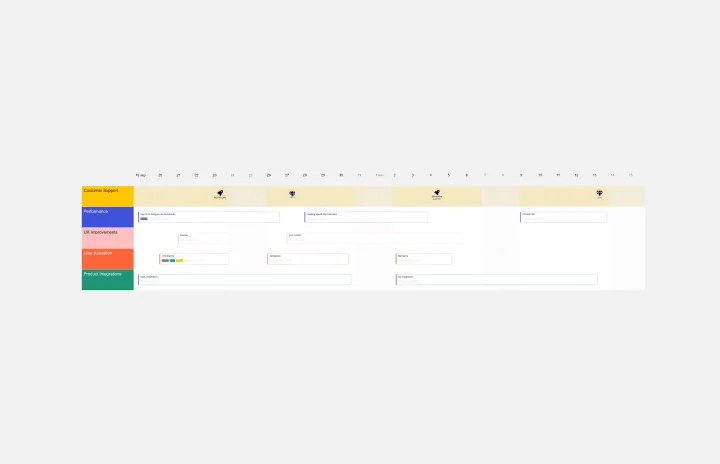
Product Development Roadmap Template
Works best for:
Product Management, Software Development, Roadmaps
Product development roadmaps cover everything your team needs to achieve when delivering a product from concept to market launch. Your product development roadmap is also a team alignment tool that offers guidance and leadership to help your team focus on balancing product innovation and meeting your customer’s needs. Investing time in creating a roadmap focused on your product development phases helps your team communicate a vision to business leaders, designers, developers, project managers, marketers, and anyone else who influences meeting team goals.
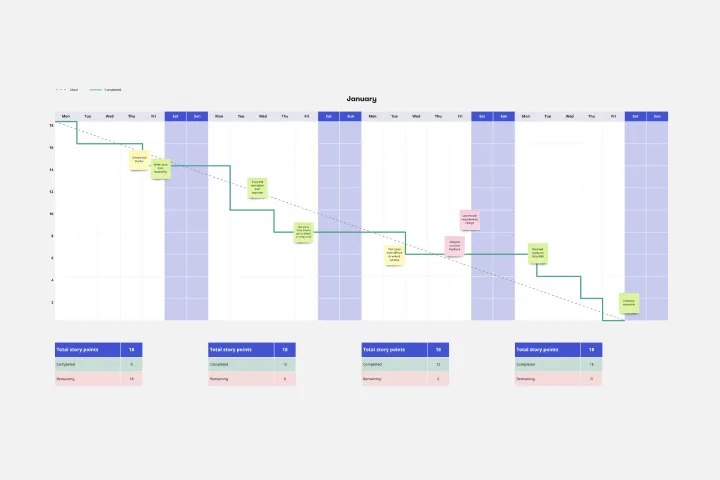
Burndown Chart Template
Works best for:
Project Management, Agile Workflows, Mapping
Whoa whoa whoa, pace yourself! That means knowing how much work is left—and, based on the delivery date, how much time you’ll have for each task. Perfect for project managers, Burndown Charts create a clear visualization of a team’s remaining work to help get it done on time and on budget. These charts have other big benefits, too. They encourage transparency and help individual team members be aware of their work pace so they can adjust or maintain it.