BPMN Template
Manage operations at ease with the BPMN template. Bring agility to your team and improve communication, showing your business process graphically.
Trusted by 65M+ users and leading companies


About the BPMN Template
BPMN, or Business Process Modeling Notation, is a method that project managers, business analysts, and other professionals can use to visualize end-to-end operations of a business process. BPMN diagrams use a standardized notation to represent processes, leading to better alignment and shared understanding.
Using a BPMN template can be your starting point when diagramming your organization’s business processes. You can also use Miro's BPMN tool to diagram from scratch if that is better suited to your needs.
What is the BPMN Template?
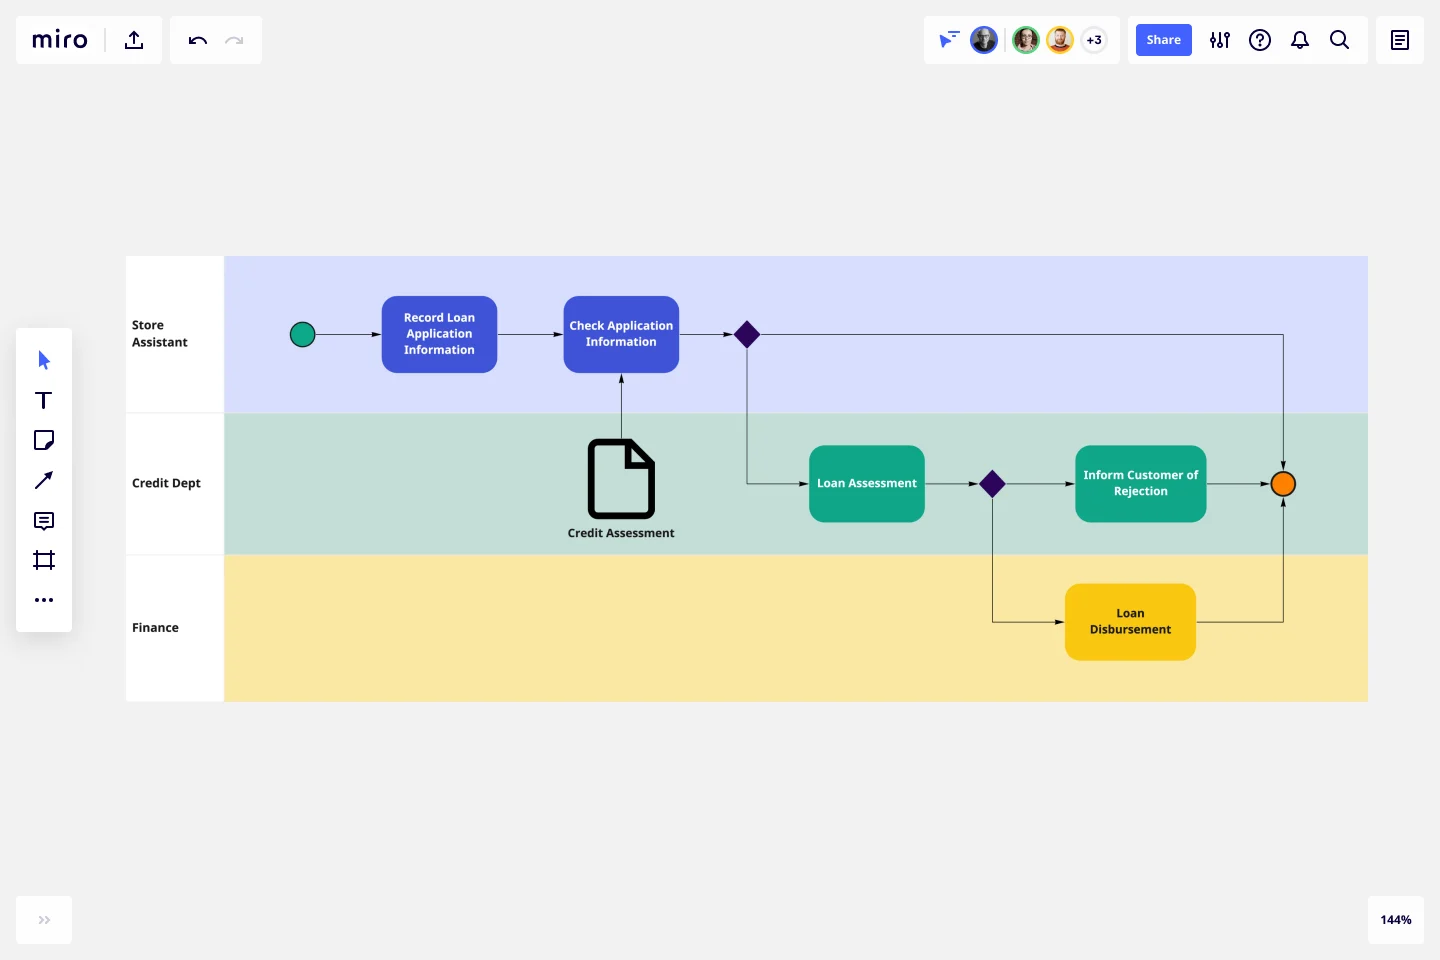
The BPMN template graphically shows your business process using standardized notations. This can be anything from recruitment to sales management.
The BPMN diagram template helps you build an overview of all the necessary steps needed to complete a business process and avoid miscommunication between teams and stakeholders. For that reason, it’s an excellent tool to bring agility to your team and move your projects forward.
When to use the BPMN Template
You can use the BPMN template to easily organize and keep track of your business process, keep everyone in the loop, and avoid misunderstandings.
Project managers can use the BPMN template to keep track of the process flow and identify any bottlenecks or unnecessary steps. Business analysts can use the template to create a BPMN diagram to track performance and identify opportunities. Many other professionals also use it to easily manage their business and keep their team’s efficiency high.
How to use the BPMN Template
You can use our BPMN template and edit it according to your organization’s needs. No matter the type of business or process you are mapping, there are some common considerations for all BPMN diagrams.
Here are some fundamentals found in the BPMN template:
1. Swimlanes for each participant or department
The template is set up using swimlanes, which can be used to represent different departments or teams. That way, you quickly see which functions are involved in each step and what they are accountable for.
2. Symbols and objects to identify flows
Objects in the BPMN template can signal flows, events, or activities. For example, rectangles represent actions or activities in the flow. Diamonds show that the flow can go in several directions. Circles represent the beginning, end, or change in the process.
3. Connection between the objects
Use arrows to connect the flow objects. Solid arrow lines represent a sequence (the order in which actions need to be taken). Dashed line arrows represent information shared between departments. Dotted line arrows show that a note is associated with a particular event or step.
4. Add artifacts
You can add extra information in case you need more details in one step or action. The artifacts can be about data or annotations about any given process step.
The advantages of using a BPMN template are that you can communicate with technical and non-technical stakeholders. Using a standard notation makes it easy to convey information to various teams implementing your business process.
Because the BPMN process flow diagram is easy to understand, project managers and business analysts can use this template to manage cross-functional teams and departments.
How do I create a BPMN diagram?
Creating a BPMN diagram in Miro is easy. You can start using the BPMN template and edit to customize it according to your needs. Before starting working on your BPMN diagram, be sure that you have determined the purpose of your diagram. What do you want to achieve with this business process? Secondly, make a list of all the steps and assign roles/departments to actions. After your process is defined, you can implement and track it. The BPMN diagram is where you can see any bottlenecks or unnecessary steps or departments involved. Make it a living document, a source of information that you can always consult and edit if necessary.
What is a BPMN diagram used for?
Many professionals use the BPMN diagram to track and monitor business processes effectively, get an overview the whole flow, avoid miscommunication across departments, and quickly identify any constraints or processes bottlenecks.
Get started with this template right now.
Kaizen Report Template
Works best for:
Agile Methodology, Operations, Documentation
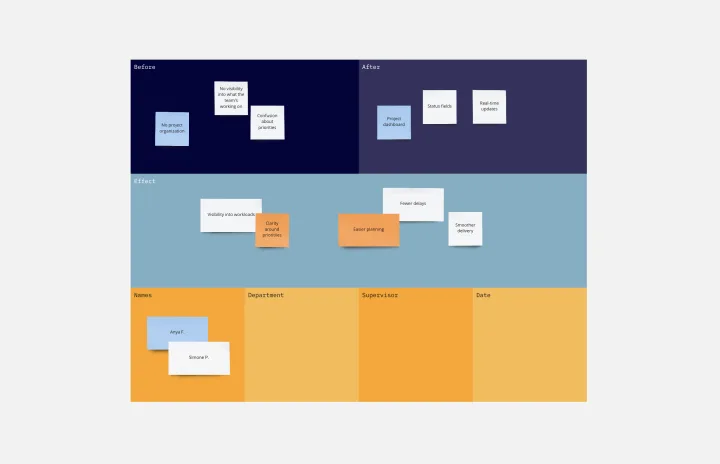
What makes a great company great? They know that greatness needs to be fostered and maintained — meaning they never stop working to improve. If you’re one of those companies (or aspire to be), a kaizen report is an ideal tool. It creates a simple visual guide to continuous improvement activities on a team, departmental, and organizational level. Using a kaizen report approach, every employee in an organization audits their own processes and understands what they might have overlooked, making this a powerful tool for increasing accountability at all levels.
AWS Architecture Diagram Template
Works best for:
Software Development, Diagrams
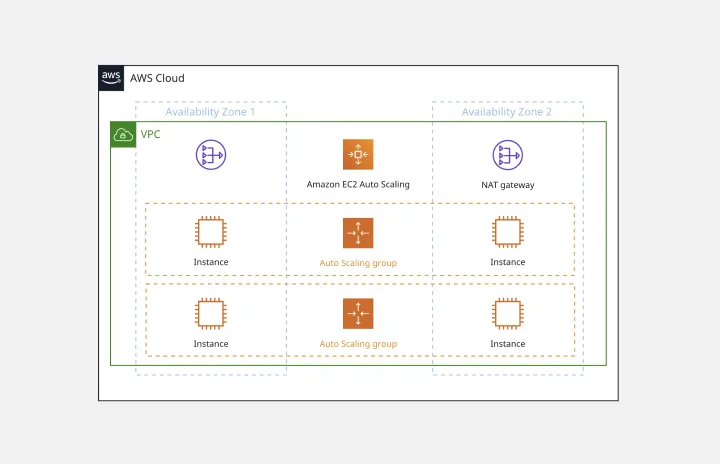
The AWS Architecture Diagram is a visual representation of the AWS framework, and it also translates the best practices when using Amazon Web Services architecture. You can now have an overview of your AWS architecture with Miro’s AWS Architecture Diagram Template, track your cloud solutions easily, and optimize processes like never before.
Cost-Benefit Analysis Template
Works best for:
Leadership, Decision Making, Strategic Planning
With so many day-to-day decisions to make—and each one feeling high-stakes—it’s easy for all the choices to weigh a business or organization down. You need a systematic way to analyze the risks and rewards. A cost benefit analysis gives you the clarity you need to make smart decisions. This template will let you conduct a CBA to help your team assess the pros and cons of new projects or business proposals—and ultimately help your company preserve your precious time, money, and social capital.
Euler Diagram Template
Works best for:
Business Management, Operations, Diagrams
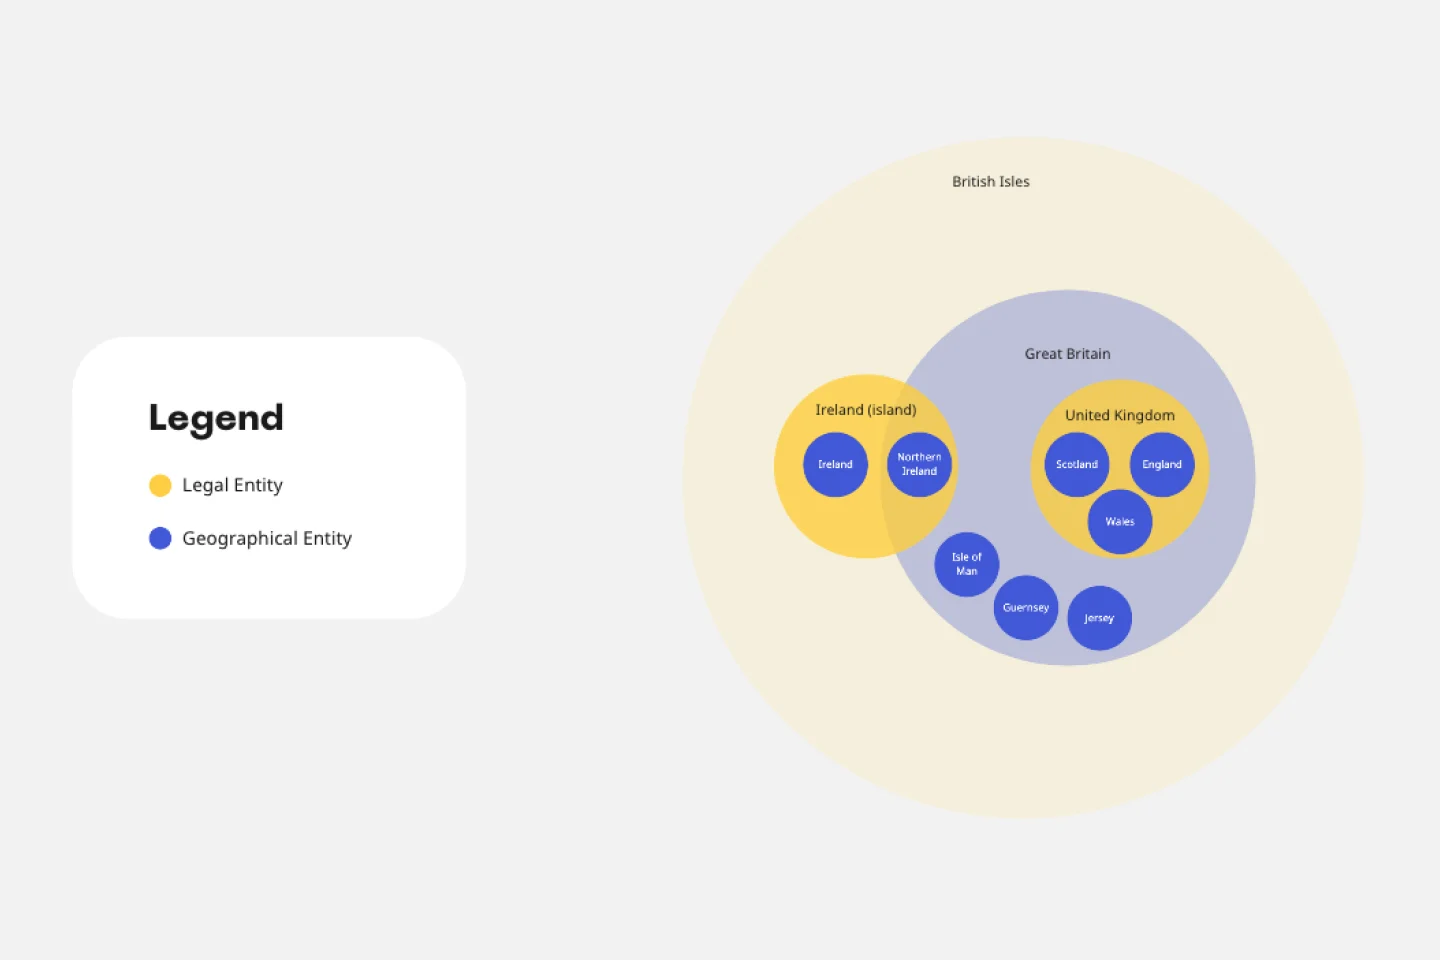
Euler diagrams are valuable for showing different relationships between subjects by representing them with circles or "cells." Euler diagrams are frequently used in IT systems to show how objects relate to one another and how they interact. However, you can use them for any sort of explanation that needs to show connections.
VRIO Analysis Template
Works best for:
Diagramming, Strategy
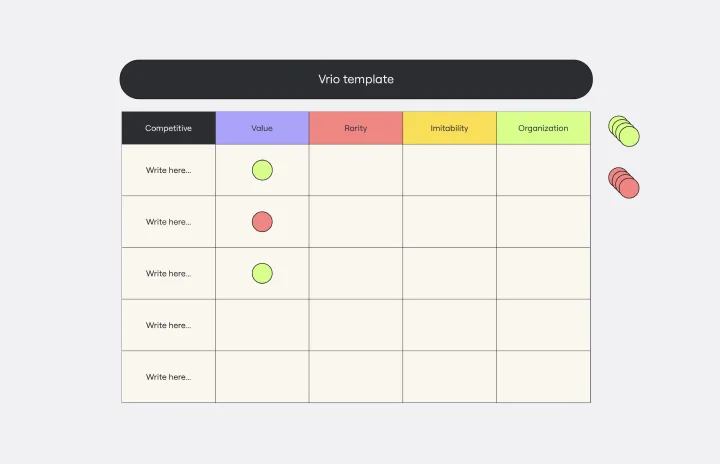
The VRIO Analysis Template is a framework that helps businesses evaluate their resources and capabilities for competitive advantage. It categorizes resources into four areas: Value, Rarity, Imitability, and Organization. This provides a comprehensive view of an organization's strengths and potential weaknesses. The template has the key benefit of offering quick visual insights. Decision-makers can immediately identify and focus on resources that are valuable, rare, hard to imitate, and well-organized. This ensures a sustainable competitive edge and saves time by avoiding lengthy textual analyses.
Card Sorting Template
Works best for:
Desk Research, UX Design, Brainstorming
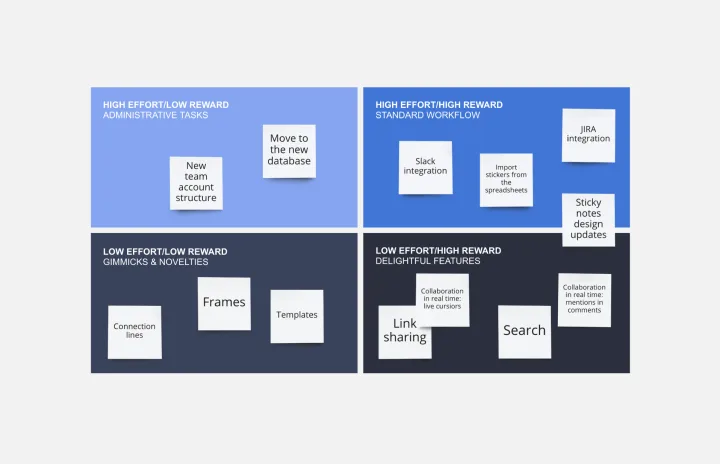
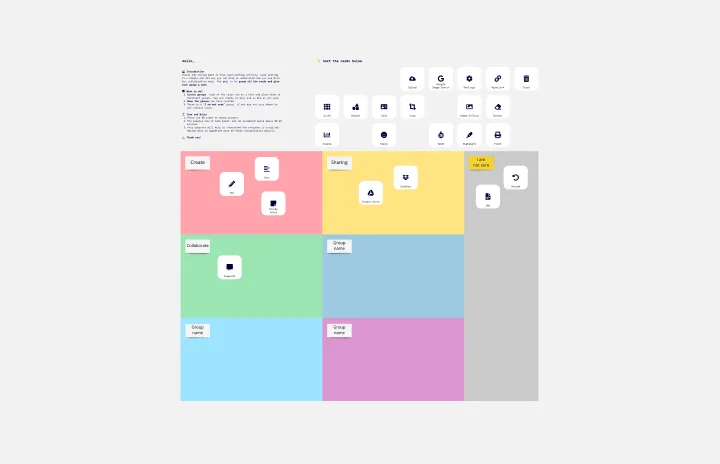
Card sorting is a brainstorming technique typically used by design teams but applicable to any brainstorm or team. The method is designed to facilitate more efficient and creative brainstorms. In a card sorting exercise, you and your team create groups out of content, objects, or ideas. You begin by labeling a deck of cards with information related to the topic of the brainstorm. Working as a group or individuals, you then sort the cards in a way that makes sense to you, then label each group with a short description. Card sorting allows you to form unexpected but meaningful connections between ideas.