4-Circle Venn Diagram Template
Use the 4-Circle Venn Diagram Template to visualize complex relationships between data sets. Empower your team's collaboration and communication with this powerful tool today.
Trusted by 65M+ users and leading companies


About the 4-Circle Venn Diagram Template
The 4-Circle Venn Diagram Template is a powerful visual tool to help you effectively map out and explore different aspects of your concepts, ideas, or problems. Simplify complex information, create clear intersections, and foster better understanding by creating a 4-Circle Venn diagram. Whether you are brainstorming, analyzing data, or seeking overlaps between multiple elements, our 4-Circle Venn Diagram Template has got you covered.
What's a 4-Circle Venn Diagram Template?
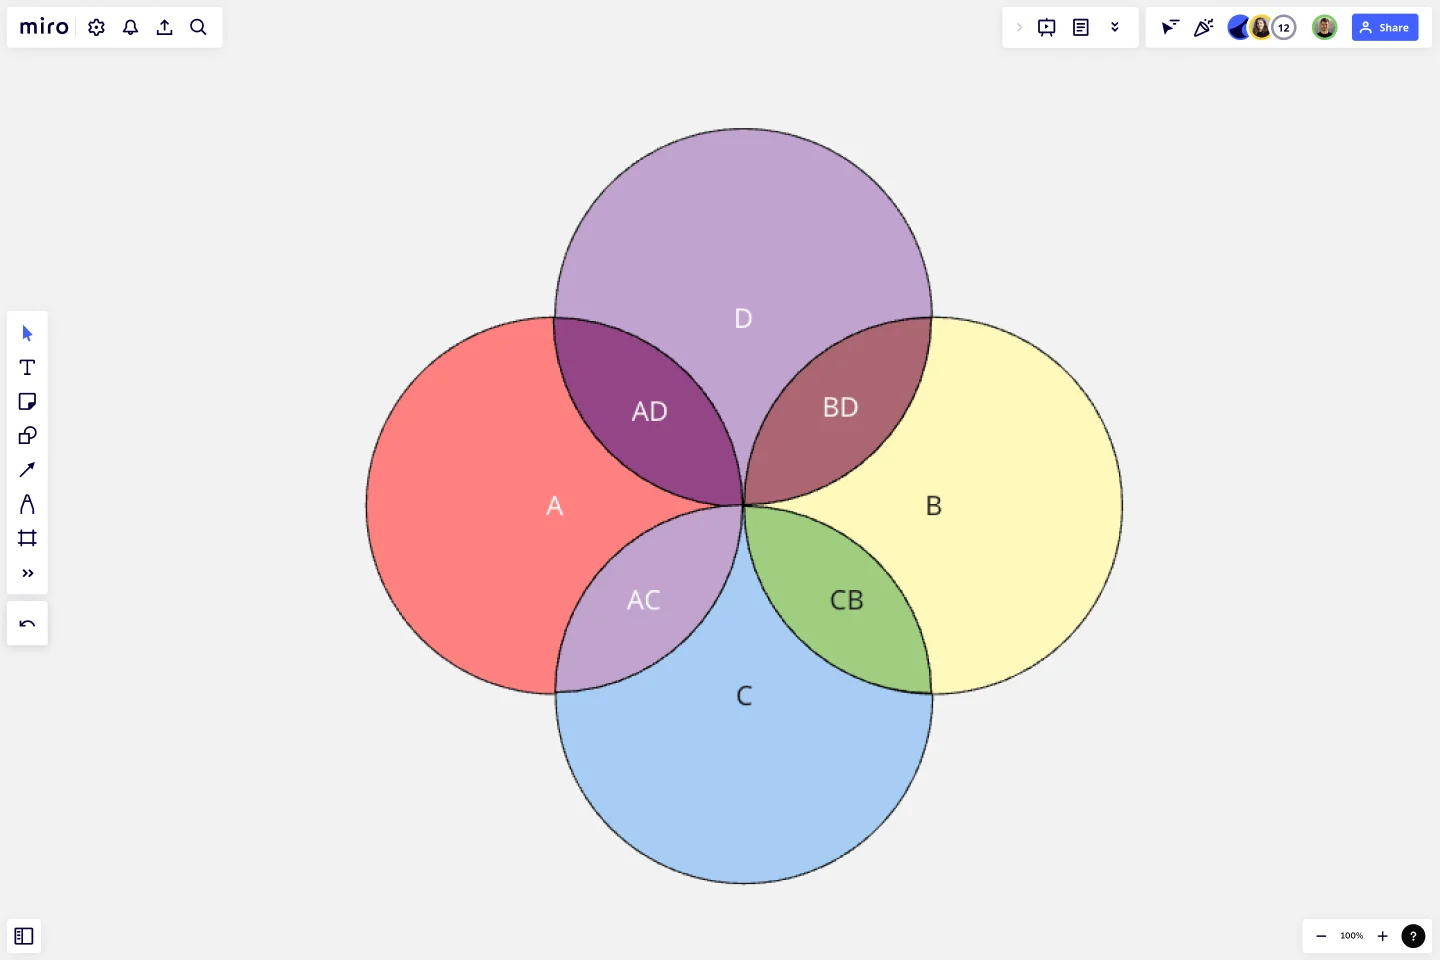
A 4-Circle Venn Diagram Template is a visual representation showcasing the relationships between four different data sets. Each circle in the diagram represents a unique set, and the areas where they intersect signify commonalities. This dynamic tool allows for easy comparison and contrast of information, making it a powerful aid in decision-making processes, problem-solving, data visualization, and more.
How to use a 4-Circle Venn Diagram Template in Miro
Step 1: Select the 4-Circle Venn Diagram Template. It will automatically load on your board.
Step 2: Customize your Venn diagram by clicking on each circle to edit the text. Input your specific sets of data into each circle.
Step 3: To show intersections and commonalities between your data sets, drag and adjust your circles so that they overlap in the necessary areas.
Step 4: Invite team members to collaborate by sharing the board with them. They can join in real-time to add comments, feedback, and ideas directly onto the Venn diagram.
Remember, with Miro, all changes are automatically saved, so you can return and change your diagram anytime. Enjoy creating a visual representation of your data that's both clear and engaging.
Miro is the perfect Venn diagram maker with a range of available templates and the ability to customize everything, from the number of circles to labeling and colors. Create professional Venn diagrams that will help you explain complex topics with confidence.
Can I customize the 4 Circle Venn Diagram Template in Miro?
Absolutely! Miro's templates are fully customizable. You can change your circles' colors, sizes, fonts, and arrangement. This allows for a truly tailored and personalized visualization experience.
Can multiple team members work on the Venn diagram simultaneously?
Yes, Miro's platform supports real-time collaboration. This means multiple team members can work on the Venn diagram simultaneously, making it perfect for brainstorming sessions or collaborative meetings.
Can I save and share my 4 Circle Venn Diagram?
Yes, you can easily save your work on your Miro board. To share it with others, simply use the share button to generate a link, or export your diagram as an image or PDF.
How can I use the 4 Circle Venn Diagram in a presentation?
Miro's 4 Circle Venn Diagram Template can easily be integrated into presentations. Use the frame tool to create a slide with your Venn Diagram, then present directly from Miro or export your frame as an image to insert into a presentation deck.
Get started with this template right now.

Force Field Analysis Template
Works best for:
Diagramming, Strategic Planning
A Force Field Analysis Template is a powerful tool that helps teams identify and analyze the forces supporting or hindering progress toward a specific change or goal. This template provides a visual space where you can brainstorm and plot out 'driving forces' that push objectives forward and 'restraining forces' that prevent advancement, all on a single, intuitive board. One of the primary benefits of utilizing the Force Field Analysis template is that it fosters a shared understanding among team members. By visually mapping out and discussing each force, teams can prioritize efforts, build consensus on the central issues to tackle, and collaboratively devise strategic plans to strengthen positive influences while reducing negative ones.
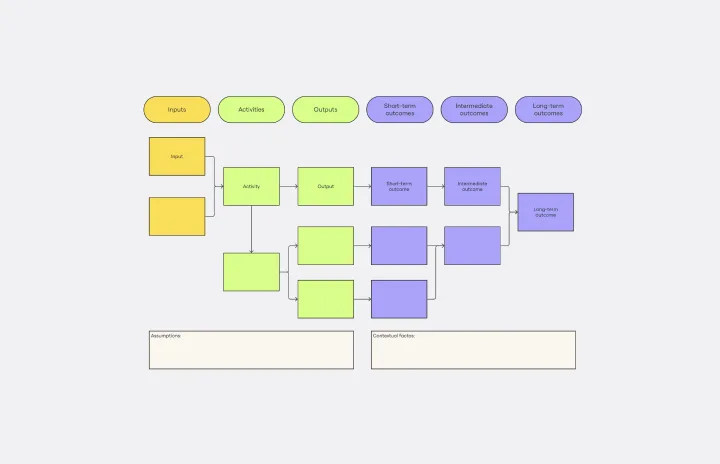
Logic Model Template
Works best for:
Diagramming
The logic model template is a strategic visual tool designed to delineate the relationship between a program's inputs, activities, outputs, and outcomes. By providing a clear and comprehensive map of the project lifecycle, stakeholders can swiftly grasp the intricate connections within a given initiative. One standout benefit of this template is its ability to enhance clarity: by visually representing the transformation of resources into anticipated results, teams can ensure more efficient and targeted use of their resources, thus maximizing the potential for success in their endeavors.
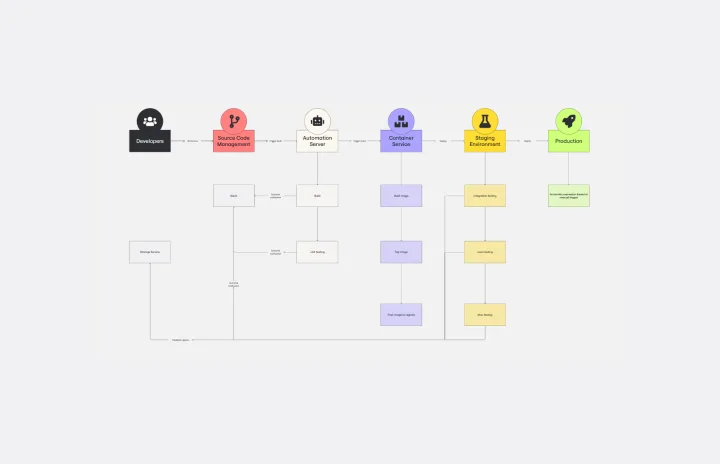
CI/CD Pipeline Diagram Template
Works best for:
Diagramming, Development
The CI/CD template is a well-designed roadmap for software deployment that enables a smooth and automated flow from development to production. This strategic layout includes critical elements such as source code management, automation servers, container orchestration, staging environments, and the final deployment to production. One of the key benefits of using such a template is that it builds a robust deployment pipeline, which significantly reduces manual intervention and human error. By visualizing each step and integrating automation throughout, teams can achieve faster deployment cycles, ensuring that new features, updates, and fixes are delivered to users promptly and reliably. This enhanced pace does not compromise quality, as the template inherently supports continuous testing and quality assurance, ensuring that each update is quick but also secure and stable before it is delivered to the end user.
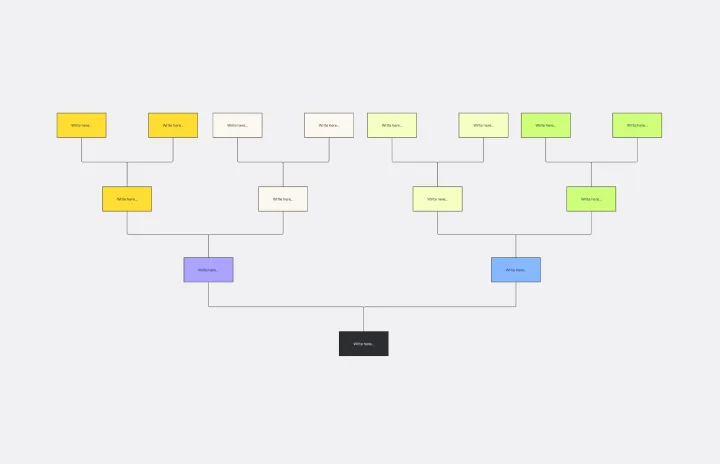
Tree Diagram Template
Works best for:
Diagramming
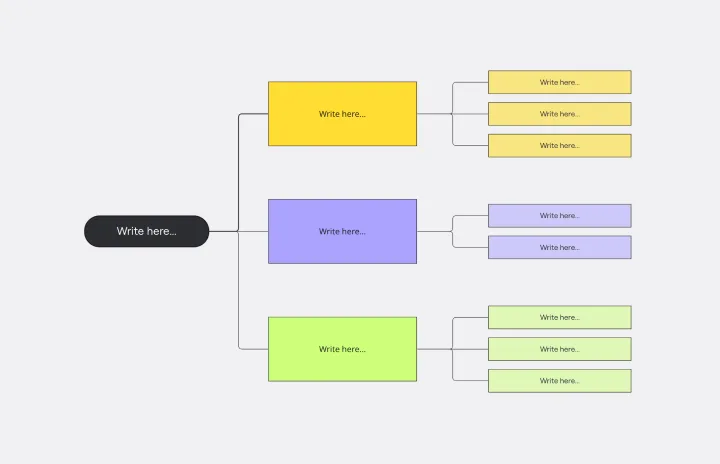
The tree diagram template helps you organize and present complex information. One of its key benefits is its ability to provide unparalleled visual clarity. It enables you to simplify complicated ideas into a structured, hierarchical format, making it easier to understand and communicate. This template enhances brainstorming sessions, project planning, and decision-making processes by mapping out relationships and dependencies clearly and effortlessly. You can now say goodbye to information overload and immerse yourself in a visual journey that simplifies complexity with the tree diagram template.
Brace Map Template
Works best for:
Diagramming, Planning
Transform your brainstorming and planning tasks with Miro's Brace Map Template. This powerful visual thinking tool clarifies complex concepts by creating a visual hierarchy that organizes each element precisely. The central idea connects seamlessly to sub-elements through intuitive braces, providing an easily understandable framework. This clarity enhances individual understanding and fosters collaborative efforts, allowing teams to navigate complex ideas with precision and coherence. The Brace Map Template will enable you to organize your thoughts efficiently and solve complexities visually.
DMAIC Analysis Template
Works best for:
Agile Methodology, Design Thinking, Operations
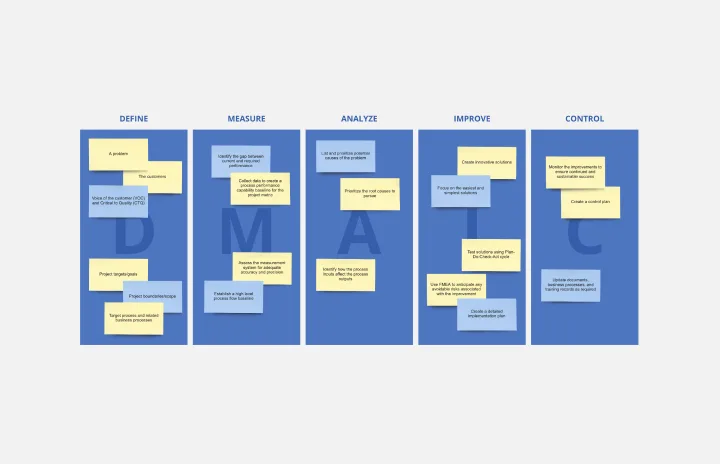
Processes might not seem like the funnest thing to dive into and examine, but wow can it pay off—a more efficient process can lead to serious cost savings and a better product. That’s what DMAIC analysis does. Developed as part of the Six Sigma initiative, DMAIC is a data-driven quality strategy for streamlining processes and resolving issues. The technique is broken into five fundamental steps that are followed in order: Define, Measure, Analyze, Improve, and Control.