CI/CD Pipeline Diagram Template
Build a deployment pipeline and manage delivery easily with the CI/CD diagram template.
Trusted by 65M+ users and leading companies


About the CI/CD Diagram Template
Efficiency and reliability are crucial in software development, and the CI/CD template helps achieve both. It is a visual guide that facilitates the integration of Continuous Integration and Continuous Delivery practices into project management. The template streamlines the development process from writing code to deploying it to production.
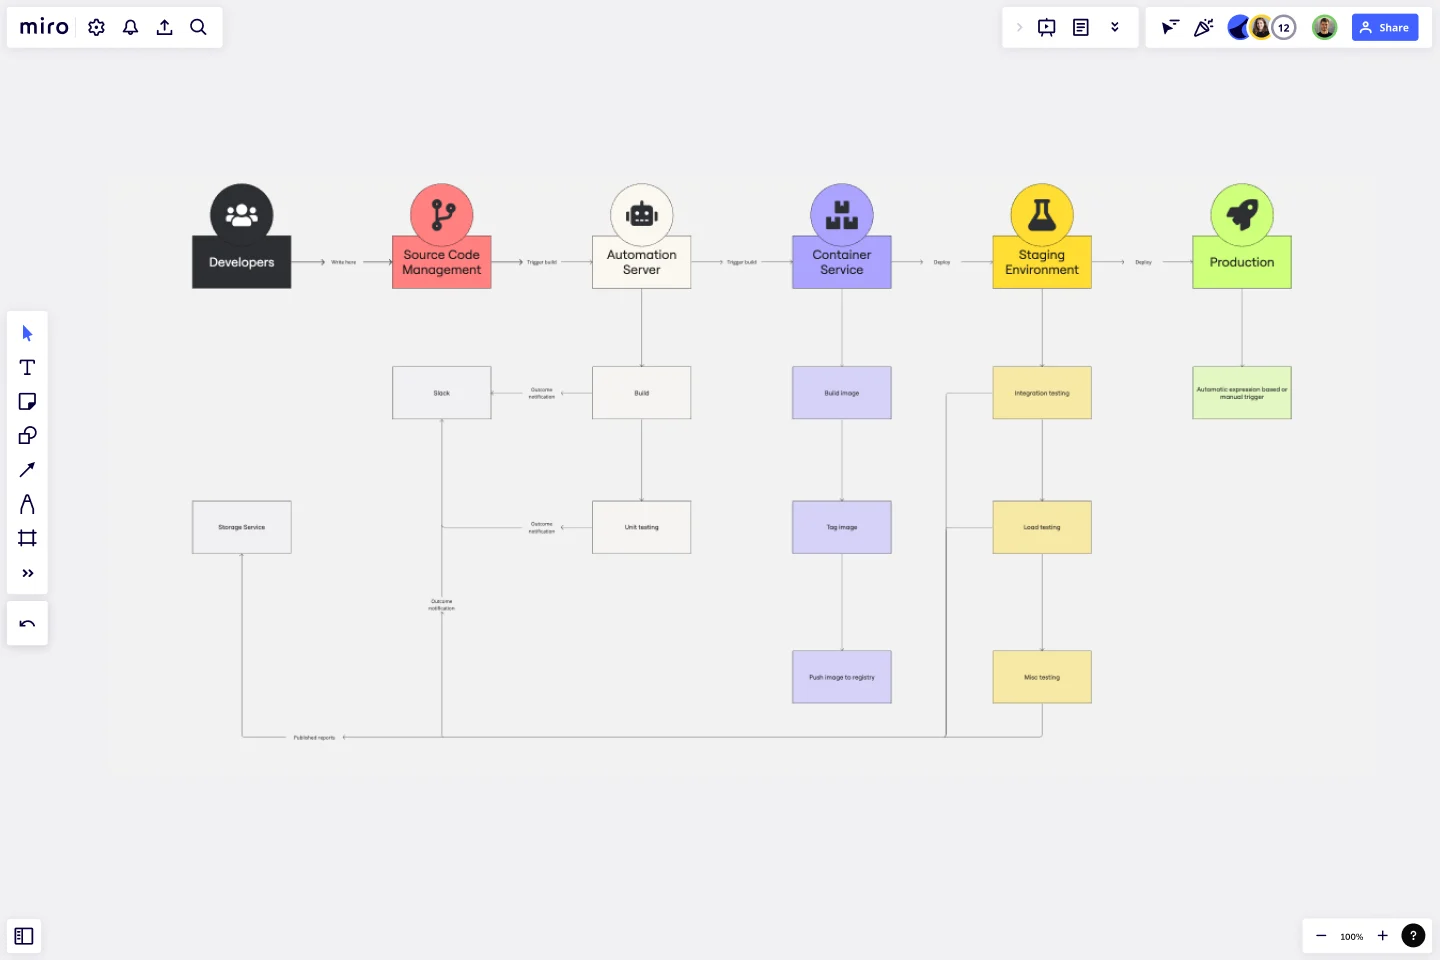
This diagram outlines each phase of the CI/CD pipeline. It provides a clear structure for the sequence of events in the automation process, including code commits, unit tests, integration tests, and deployment. Each stage has designated areas where users can plot specific actions, such as automated builds or deployment schedules. By interacting with each segment, one can trace the path from code conception to delivery, ensuring transparency and manageability at every process step.
Each area in the template not only defines a specific stage in the CI/CD process but also serves as a conduit for collaboration, allowing team members to assign tasks, share updates, and maintain the integrity and continuity of the software delivery pipeline.
Source Code Management:
Repository for maintaining code versions and history (e.g., Git repositories).
Integration with hooks/triggers to notify the CI/CD pipeline of changes.
Branching strategies and merge policies are documented here.
Access control and review process for code contributions are outlined.
Automation Server:
Central system that orchestrates the build process and executes the pipeline.
Manages task scheduling, executes automated tests, and reports outcomes.
Configurations for building jobs and dependencies between them are handled here.
Often includes a dashboard or interface for monitoring build statuses and history.
Container Server:
Infrastructure for running and managing containers (e.g., Docker, Kubernetes).
Details containerization of the application for consistent deployment environments.
Describes image repositories and management for versioning of containerized services.
Specifies orchestration requirements, scaling policies, and health checks.
Staging Environment:
A mirror of the production environment used for final testing before release.
Deployment strategies such as blue-green deployments or canary releases are outlined.
Performance testing, security scanning, and user acceptance testing criteria are specified.
Mechanisms for monitoring and logging are established for pre-production vetting.
Production:
The live environment where the application is available to end-users.
Includes details on infrastructure management, scaling, load balancing, and disaster recovery.
Security measures, compliance standards, and real-time monitoring tools are documented.
Continuous Deployment strategies for pushing changes to users with minimal downtime are detailed.
How to use the CI/CD diagram template in Miro
To harness the full potential of the CI/CD template, follow these simple steps:
Customization: Click to edit text and drag-and-drop elements to tailor the template to your project's unique pipeline structure.
Expand the Framework: Effortlessly add more shapes and connector lines using the automated diagramming features to scale the pipeline to your needs.
Integrate Artifacts: Drag any artifact onto your board to contextualize each stage—documentation, code snippets, or test results.
Why should you use a CI/CD template?
The benefits of employing a CI/CD diagram template are considerable:
Clarity in process: It provides a visual representation of the development pipeline, making complex processes understandable at a glance.
Enhanced collaboration: Teams can work together more effectively with a common visual language and understanding of the workflow.
Time efficiency: Streamlines the development process by providing a clear roadmap from development to deployment, reducing time-to-market.
Error reduction: By visualizing each step, teams can identify and address potential issues early, minimizing the risk of errors in the production environment.
Continuous improvement: A CI/CD template enables ongoing optimization of development practices by making it easy to identify bottlenecks or redundant steps.
If you prefer to start from scratch, Miro's diagramming tool is intuitive and comes with a wide range of diagramming shapes in Miro's extensive library, so you'll find just what you need.
Can the CI/CD template handle multiple project pipelines?
Absolutely. The template can be replicated or adjusted to accommodate as many project pipelines as needed.
Is the CI/CD template suitable for teams new to CI/CD practices?
Yes, it's designed to be user-friendly, making it an excellent tool for teams of any experience level to visualize and understand CI/CD workflows.
How can I track changes made to the CI/CD template?
Changes are logged, and version history can be reviewed to track the evolution of the pipeline diagram over time.
Can I integrate third-party tools into the CI/CD template?
While the template itself is a visual representation, it can be used with various third-party tools by adding links or notes to specific parts of the template, creating a dynamic and integrated project environment.
Get started with this template right now.
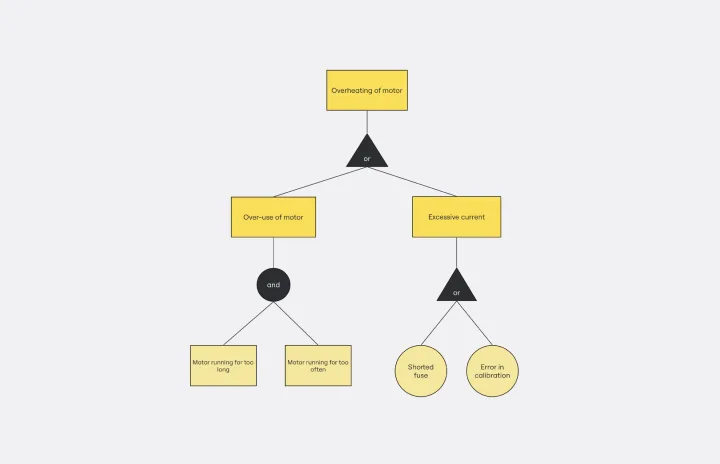
Fault Tree Analysis Template
Works best for:
Diagramming
The Fault Tree Analysis Template visually breaks down potential system malfunctions, highlighting complex causal relationships between faults. One of its standout benefits is its ability to enhance clarity in complex scenarios, allowing professionals to swiftly pinpoint root causes and prioritize interventions, ensuring a more streamlined approach to problem-solving.
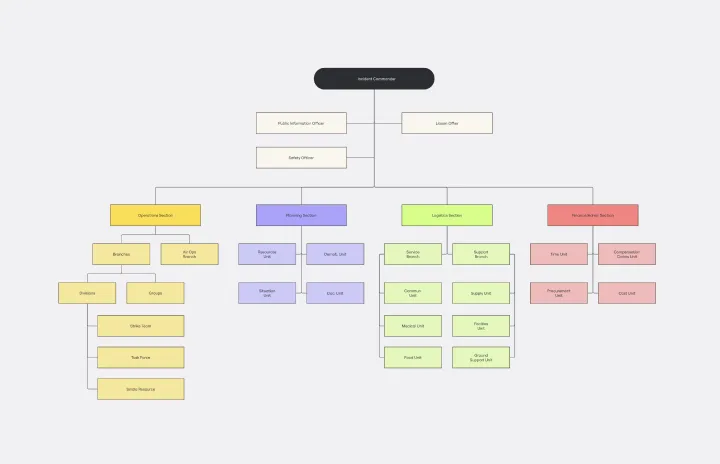
ICS Org Chart Template
Works best for:
Diagramming
Our carefully crafted ICS Org Chart Template is an invaluable tool designed to clearly represent the hierarchical structure of the Incident Command System (ICS). It simplifies the complex web of roles, responsibilities, and chains of command within the ICS, providing a structured blueprint for both experienced professionals and those new to the system. The template's most notable benefit is its ability to foster immediate understanding, bridging the gap between intricate organizational structures and the teams navigating them. Teams that use this template can ensure that everyone is aligned, understands their role, and collaborates efficiently, thereby reducing potential bottlenecks and misunderstandings.
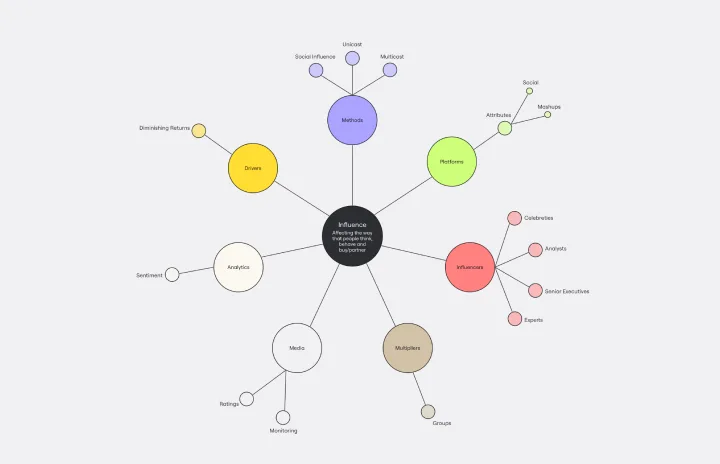
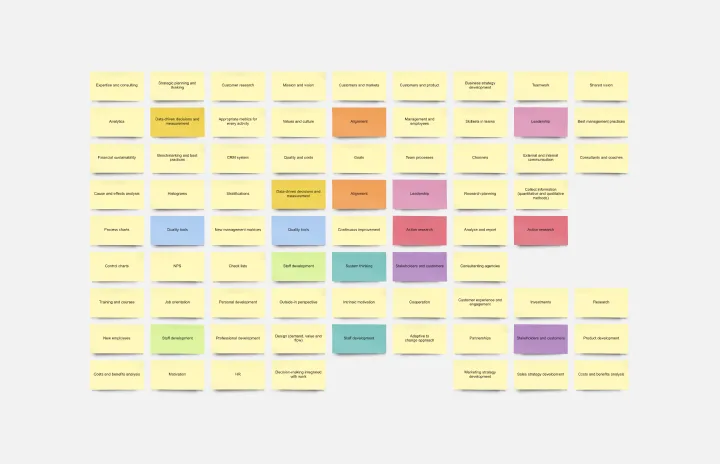
Cluster Diagram Template
Works best for:
Diagramming
The Cluster Diagram Template is a valuable tool for organizing and connecting ideas, concepts, and information in a visually compelling and coherent manner. The template's design centers on grouping related ideas around a core concept, creating a transparent and hierarchical structure. This clustering not only aids in breaking down complex information into manageable segments but also significantly enhances the process of idea generation and brainstorming. A structured yet flexible visual framework encourages deeper engagement and more precise understanding, making it an essential asset for teams and people looking to bring order to their creative and analytical processes. I have checked the text for any potential spelling, grammar, and punctuation errors, and it's good to go.
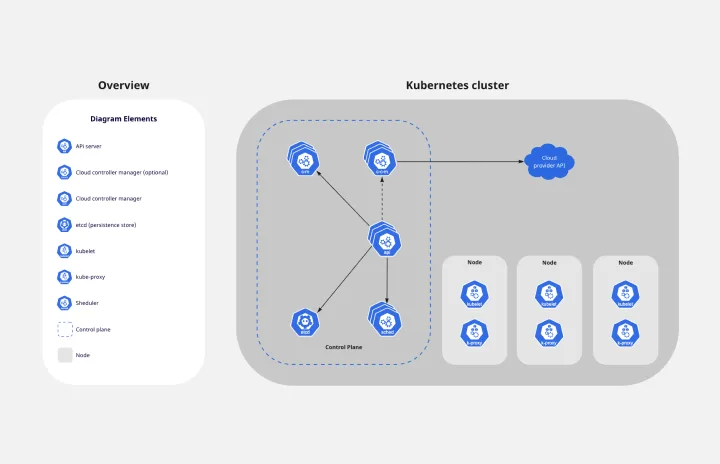
Kubernetes Architecture Diagram Template
Works best for:
Software Development, Diagrams
Use the Kubernetes Architecture Diagram template to manage your containerized applications better and bring your apps’ deployment, management, and scalability to the next level. This template helps you lower the downtime in production and allows you to have a more agile app production. Improve the deployment of your apps by visualizing every step of the process with the Kubernetes Architecture template. Try it out, and see if it works for you and your team.
Lotus Diagram Template
Works best for:
UX Design, Ideation, Diagrams
Even creative thinkers occasionally need help getting their creative juices flowing. That's where a lotus diagram comes in. It'll empower you to run smoother, more effective brainstorming sessions. This creative-thinking technique explores ideas by putting the main idea at the diagram center and ancillary concepts in the surrounding boxes. This template gives you an easy way to create Lotus Diagrams for brainstorms, as well as an infinite canvas for the endless ideas generated.
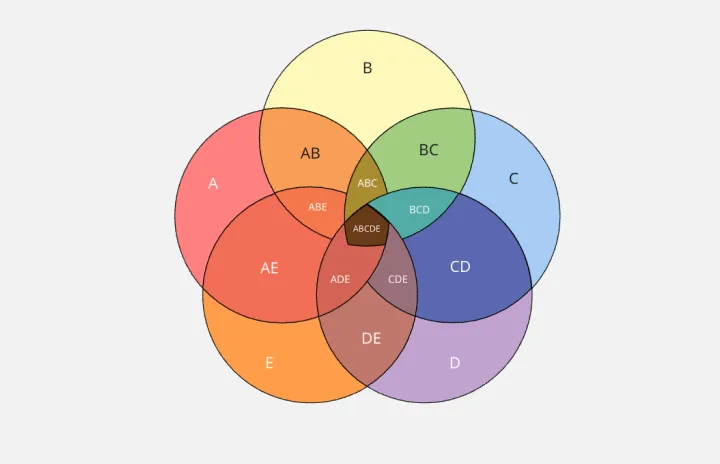
5-Circle Venn Diagram Template
Works best for:
Diagramming, Mapping, Brainstorming
Discover how Miro's 5 Circle Venn Diagram Template can simplify complex decision-making processes. Learn how to create, customize, and share your diagrams for effective visual collaboration. Transform brainstorming sessions with real time, remote teamwork.