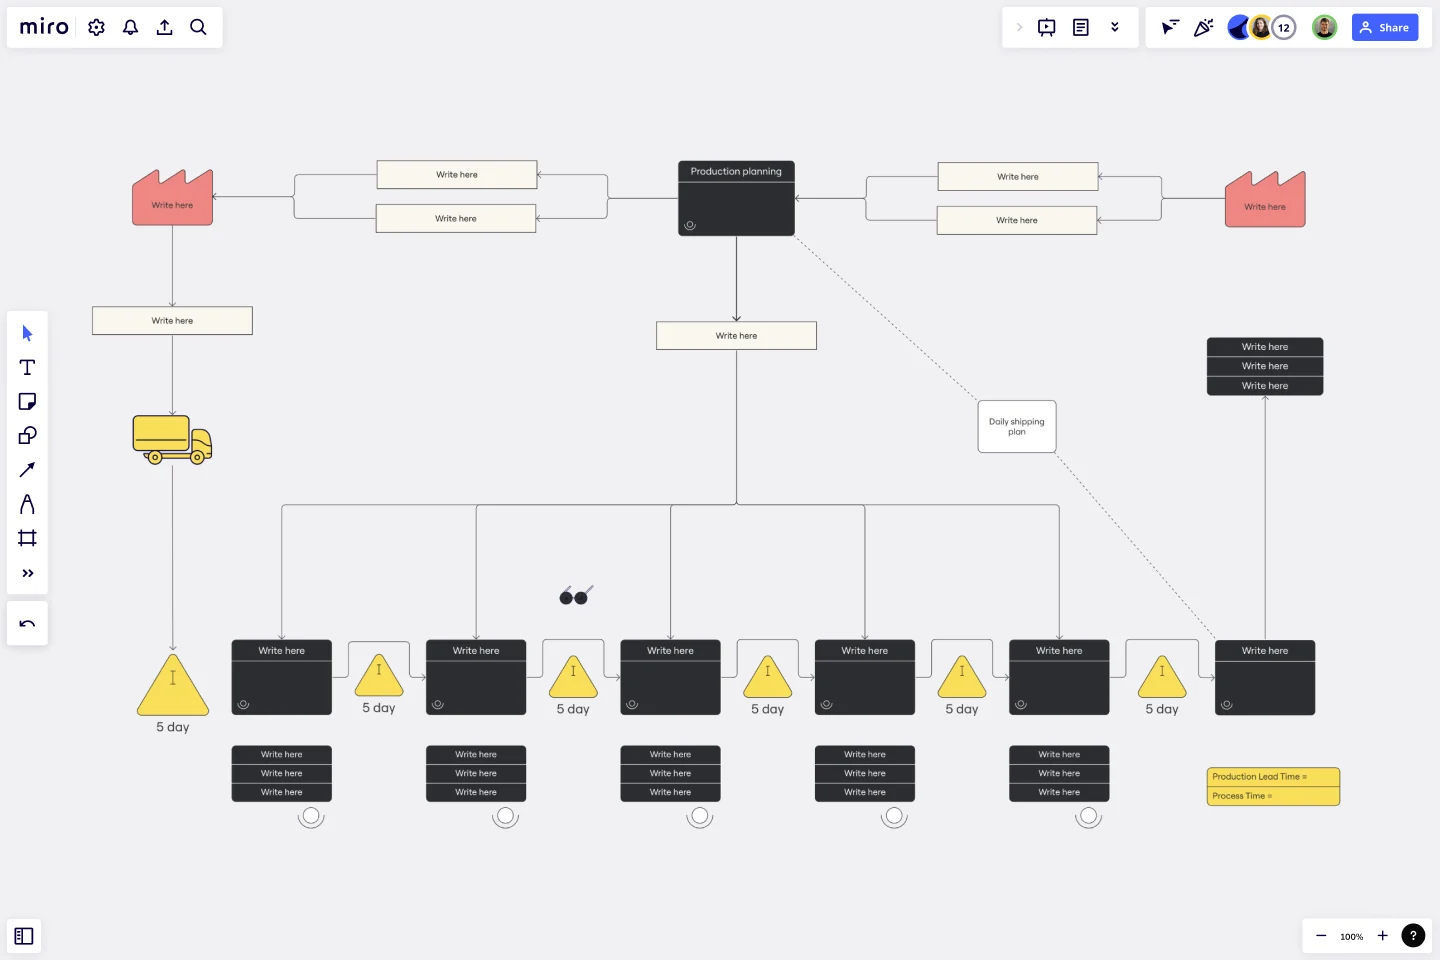
Value Stream Mapping Template
Define and optimize the various steps of delivering a product using lean methodology with the value stream mappping template.
Trusted by 65M+ users and leading companies


About the Value Stream Mapping Template
To optimize repeatable processes, it is important to understand them thoroughly. Our value stream mapping template can help you create a map easily.
Toyota developed this framework as part of its lean manufacturing methodology. By following their "just-in-time" strategy, Toyota only delivers enough finished cars to meet customer demand, avoiding losses due to storage and holding patterns. However, this approach requires continuous improvement, and a clear value stream analysis is essential.
The value stream map template promotes communication and collaboration to improve cross-functional processes. With this template, you can identify obstacles that hinder your production process, regardless of your industry.
How to use the value stream mapping template
Start by opening the value stream mapping template by clicking the "use template" button at the top of this page. Invite your team to collaborate on the template, then follow these steps:
1. Determine your scope
Figure out the start and endpoints of your value stream. When do you start adding value to the raw materials, and when do you hand the finished product off, either to a customer or another business?
2. Add objects for each step
What steps do you take to prepare a single product or feature for the customer? Create a box for each one. It might help to think of each team as its own step.
3. Add the flow of materials between each object
Add an arrow between each step. Label each arrow with the resources that must be transferred for the next step to be possible.
4. Add information flows
Add arrows of a different color to show which steps must communicate with each other to complete the process. Include flows that don’t match the resource flows, such as sending regular updates to a central management team.
5. Show how long each step takes
Add a timeline and base it on your real-world cycle time data. This is how you’ll be able to shed light on which steps and transitions are wasting time and resources.
6. Revise as needed
Remember, lean management demands continuous improvement. Once you’ve drawn your map, don’t be afraid to iterate. How does your timeline look? What process steps have you mapped out? Is your lead time too long? Are you seeing test failures? Identify any steps in the process that do not add value to the customer.
For more details on how to create a value stream map, you can see our in-depth guide, which can also help if you're planning on facilitating a value stream mapping workshop.
What are the benefits of using a VSM template?
Value stream mapping is a critical component of any business strategy. Here are a few things a value stream mapping tool can help you with.
Foster collaboration
Value stream maps make it easy to identify gaps in communication between teams and across functions. Once you’ve identified these gaps, you can brainstorm ideas for fostering communication and knowledge-sharing.
Reduce waste
Most of the waste in your production process occurs during handoffs between teams. When a project changes hands from Team A to Team B, it’s crucial to make sure all of Team A’s knowledge, experience, tools, and resources go with it.
If anything falls through the cracks, Team B has to waste time reinventing the wheel. That costs your company precious time and resources.
Value stream analysis allows you to overcome this obstacle by clarifying which handoffs are causing waste and why. With value stream mapping, you can reduce downtime from team transitions, making a Toyota-style lean strategy more feasible.
Focus on the customer
At all stages of production, your focus should be on the customer. But when there are so many teams and moving parts to think about, that focus can be hard to maintain.
The value stream mapping exercise forces you to evaluate whether each step in the process is adding value from the customer’s standpoint. This laser focus maintains your competitive advantage the only way it’s possible to do so sustainably: by producing the most value for your customers in the leanest way possible.
What factors should you keep in mind when creating a value stream map?
1. Business value
Which aspect of the product has the highest business value? Answer that question before you start building your map.
2. Responsibility
Who is mapping the value stream? It’s important to assign this task to an experienced team who can see the current state map and future state maps from start to finish.
3. Identifying the problem
What problem are you solving? Looking at the current state map, what are the deficiencies in the process flow? How can you improve future states?
Think about this question from the customer’s perspective. What have you been hearing from your customers? Do they think the price of your product is too high or the quality is low? Make sure everyone is on the same page about your problem before you start mapping.
4. Setting tangible objectives
What is the scope? Make sure you know what problems you can’t solve or don’t need to solve right away. That will help you create a clear, effective map with no extraneous parts.
Using process mapping software can be a game changer when you need to connect teams, optimize business processes, and scale your organization.
How do you create a value stream map?
To create a value stream map, you need to first articulate a clear objective for the processes that you want to improve. Then, break the process into its constituent steps, including both the flow of materials and information, gather data on these processes, and then look for inefficiencies that can be rectified.
How often should I update my value stream mapping template?
It is essential to revisit and update your value stream map regularly. This will help to ensure that it reflects any changes in processes and evolving business needs.
Can I share the value stream mapping template with external collaborators?
You can easily share your Miro board with external collaborators via a link. This will provide them with a transparent view of your value stream.
Are there any limitations on the number of process steps I can include in the template?
No, there are no limitations on the number of process steps you can include in the template. The template is scalable, allowing you to map as many process steps as needed for a comprehensive analysis.
How can I involve my team in the value stream mapping process?
You can foster team collaboration by inviting members to the Miro board. This will encourage input, feedback, and a shared understanding of the processes involved.
Get started with this template right now.

Driver Diagram Template
Works best for:
Diagramming
The driver diagram template is a strategic visual tool that helps teams map out their primary objectives and break them down into actionable components. It presents goals, drivers, and specific change ideas in a coherent and interconnected format, ensuring clarity of objective. By doing so, every team member is aligned towards a common endpoint, fostering unified efforts. The visual nature of the template simplifies complex objectives, making it easier for teams to stay on track and measure their progress effectively.
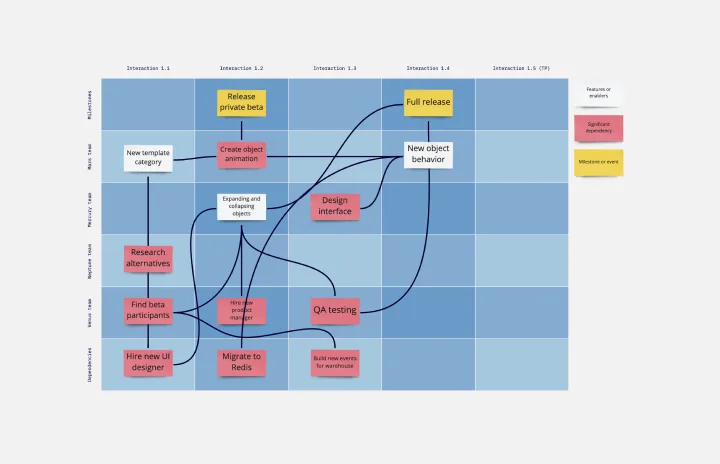
SAFe Program Template
Works best for:
Agile Methodology, Diagrams, Agile Workflows
Many organizations use the Agile model, but even companies that don’t rigorously adhere to all Agile standards have adopted Agile tools and methods like Program Increment (PI) Planning. Even if you’re not participating in a formal PI session, a program board can be a great way to establish communication across teams and stakeholders, align development objectives with business goals, clarify dependencies, and foster cross-functional collaboration. The board provides much-needed structure to planning sessions, yet is adaptable enough to accommodate brainstorming and alignment meetings.

Azure Demand Forecasting Template
Works best for:
Software Development, Diagrams
The Azure Demand Forecasting diagram will show the architecture of a demand forecast, making it easier for you to predict data consumption, costs, and forecast results. Azure is Microsoft’s cloud computing platform, designed to provide cloud-based services such as remote storage, database hosting, and centralized account management. Azure also offers new capabilities like AI and the Internet of Things (IoT).
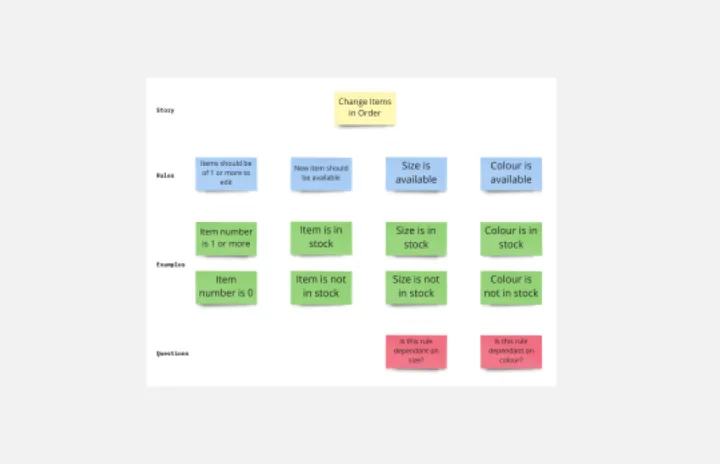
Example Mapping Template
Works best for:
Product Management, Mapping, Diagrams
To update your product in valuable ways—to recognize problem areas, add features, and make needed improvements—you have to walk in your users’ shoes. Example mapping (or user story mapping) can give you that perspective by helping cross-functional teams identify how users behave in different situations. These user stories are ideal for helping organizations form a development plan for Sprint planning or define the minimum amount of features needed to be valuable to customers.

3-Circle Venn Diagram
Works best for:
Education, Diagrams, Brainstorming
Venn diagrams have been a staple of business meetings and presentations since the 1800s, and there’s a good reason why. Venn diagrams provide a clear, effective way to visually showcase relationships between datasets. They serve as a helpful visual aid in brainstorming sessions, meetings, and presentations. You start by drawing a circle containing one concept, and then draw an overlapping circle containing another concept. In the space where the circles overlap, you can make note of the concepts’ similarities. In the space where they do not, you can make note of their differences.
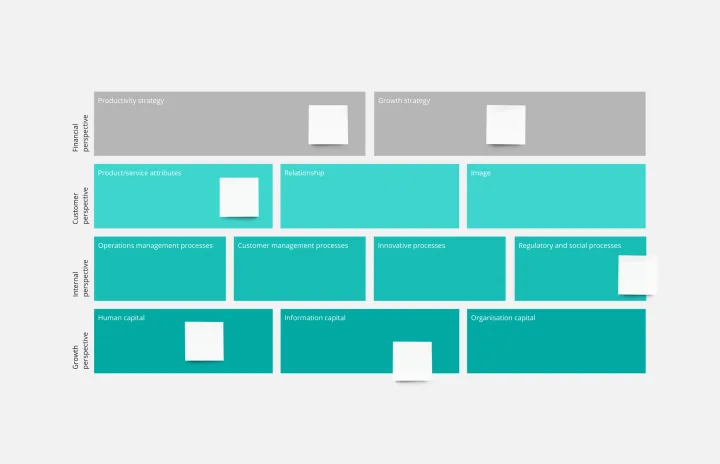
Strategy Map Template
Works best for:
Leadership, Strategic Planning, Mapping
How do your individual or team goals relate to an organization’s overall strategy? A Strategy Map is a stylized picture of your organization’s strategy and objectives. It’s powerful because it provides a clear visual guide to how these various elements work together. Strategy Maps can help align various different team goals with the overall strategy and mission. With the Strategy Map in place, teams can create set actionable, relevant KPIs. Strategy mapping is often considered part of the balanced scorecard (BSC) methodology, which is a strategic planning tool for setting overall team goals.