Flowchart Template
Say goodbye to bottlenecks — map out any process seamlessly using Miro’s easy-to-use flowchart template.
Trusted by 65M+ users and leading companies


About the Flowchart Template
A flowchart is a visual tool for representing processes. It typically consists of symbols and shapes that represent the various steps of a process, as well as connection lines to depict the flow between them. While you can easily build your own flowchart from scratch, Miro’s flowchart template saves you time by providing you with a ready-to-use chart. All you have to do is open it, fill it in, and further customize it to make it your own. We’ll show you how in the next section.
How to use Miro’s flowchart template
To get started, scroll to the top of this page and click on the blue “Use template” button. That’ll open the flowchart template on a blank Miro board, allowing you to start filling it in. Once you’re there, here are five steps to make the most of our flowchart template.
1. Decide on a process to visualize
Before you can start filling the flowchart template in, make sure you’re clear on what process you’re trying to visualize. If you’re collaborating on the flowchart template with others, be sure to invite them to edit your Miro board with you.
2. Get familiar with the flowchart template
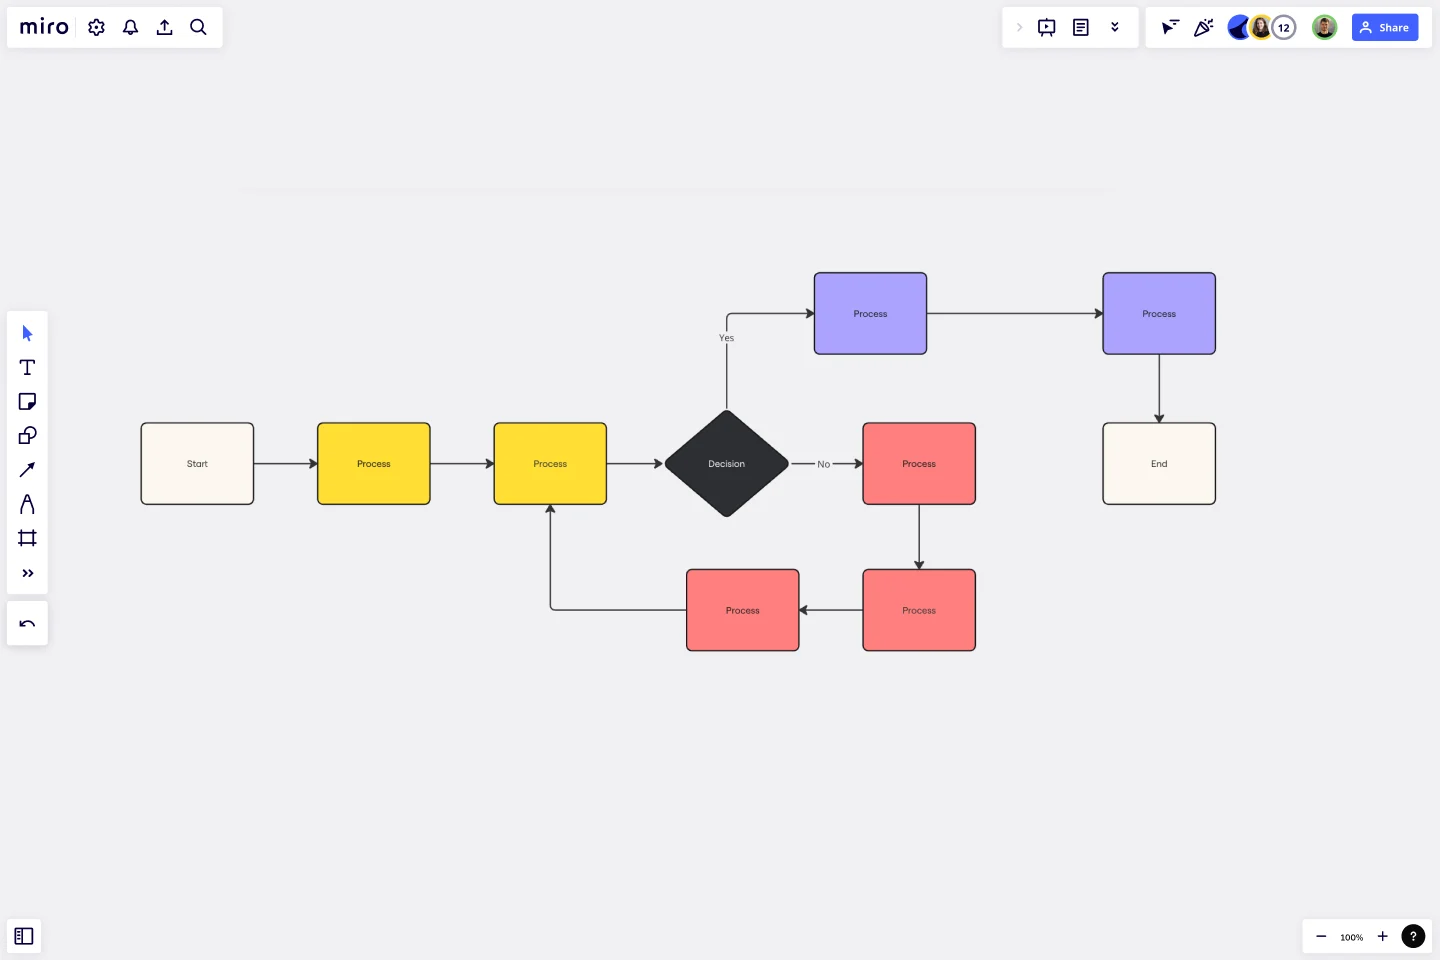
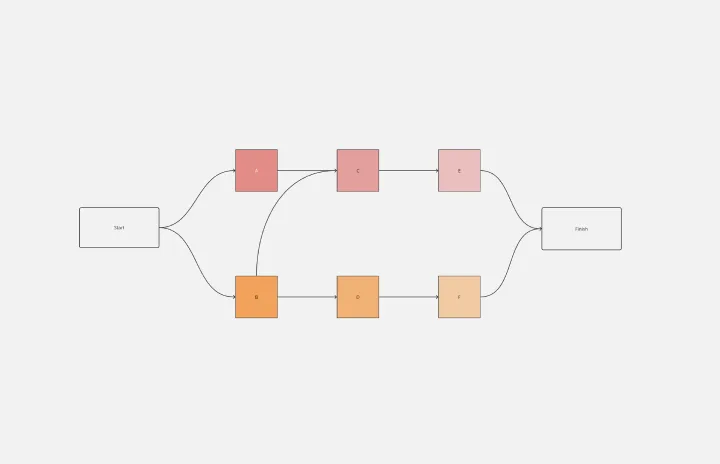
The flowchart template comes with pre-made shapes containing text boxes. The black rectangles with rounded corners represent the starting and ending points of your flowchart. The rectangles with sharp corners represent the different actions you could take, while the diamond represents a decision you need to make as a result of those actions. As your reader moves through your flowchart, the arrows between the shapes are meant to help them identify the next step in the process.
3. Fill in the flowchart template
Let’s say you’re visualizing the steps someone could take when they wake up in the morning. Fill in the first yellow rectangle with “wake up.” In the orange diamond, write down a question this person might have to answer in order to decide what to do after waking up, such as “Is it a weekday?”
From there, you’ll see two arrows labeled “yes” and “no,” each leading to a follow-up action you could take based on your answer to the previous question. If the answer is yes – meaning it is a weekday – the connecting pink rectangle should identify the next step, such as “get out of bed.” Repeat this for the remaining pink rectangle. You could write, “Go back to bed,” as a result of it not being a weekday.
In the final black rectangles with rounded corners, write down what the outcome of each path is. For example, you could write “Get ready for work” as the outcome of getting out of bed and “Sleep in” as the outcome of going back to bed.
4. Add more symbols and arrows
Need more shapes and arrows to visualize your process? No problem — editing the flowchart template is easy. Simply click on any shape to reveal the blue dots around it, and click on the one where you’d like to add a new pathway. From there, you can easily change the shape’s color or even move it around to place it exactly where you want it on the flowchart template.
5. Customize your flowchart template
Done filling in your flowchart template? Time to customize the look and feel — whether you want to align your flowchart with your brand style or simply have fun. Highlight any element of your flowchart to edit it, and use the pop-up menu to customize everything from line thickness to font types. You can even change your Miro board’s background color.
Benefits of using Miro’s flowchart template
There are several benefits of making an online flowchart. On top of saving you time from having to build a flowchart from scratch, using Miro’s template lets you easily customize it using built-in diagramming tools. Need a few extra hands? Invite collaborators to fill in and customize your flowchart template in real time, even if you aren’t all in the same room. Want to share your flowchart template for feedback before finalizing it? Invite others to view and comment on your Miro board, and have them easily tag you in messages so you never miss a beat.
When you’re ready to seal your flowchart template and make it official with your team, simply export your Miro board so you can send it as an email or instant message attachment.
Is Miro’s flowchart template free?
Yes, Miro’s flowchart template is 100% free to use. Simply scroll to the top of the page and click on the blue “use template” button to get started.
Can I create my own custom flowchart template?
Absolutely, Miro's intuitive interface makes it easy to design your own flowchart template and share it with others. Feel free to experiment with shapes, colors, and lines to mirror your individual style or company's branding guidelines. Save your custom template for future projects, providing an efficient starting point each time.
When to use a flowchart template?
Most project managers use the flowchart template from the start. This helps align teams early on and quickly and helps them avoid having to explain processes multiple times down the line. But using a flowchart template isn’t limited to new projects. Think about any existing processes or workflows that your teammates aren’t always on the same page about. A flowchart would help maintain one source of truth, and using a template saves you time from having to create an elaborate visualization from scratch — allowing you to stay focused on work.
Get started with this template right now.
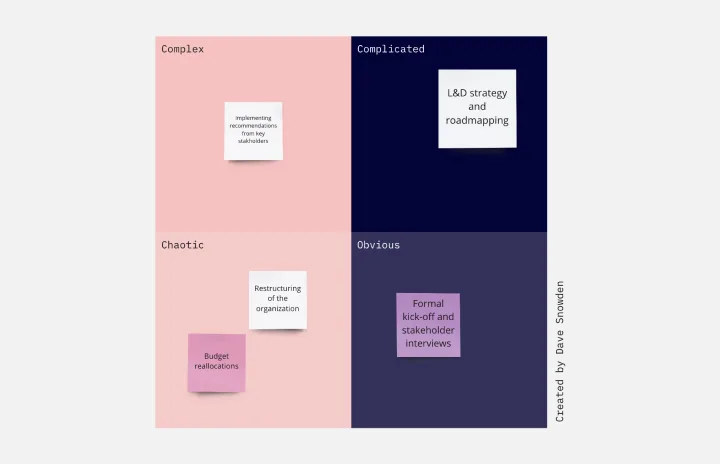
Cynefin Framework Template
Works best for:
Leadership, Decision Making, Prioritization
Companies face a range of complex problems. At times, these problems leave the decision makers unsure where to even begin or what questions to ask. The Cynefin Framework, developed by Dave Snowden at IBM in 1999, can help you navigate those problems and find the appropriate response. Many organizations use this powerful, flexible framework to aid them during product development, marketing plans, and organizational strategy, or when faced with a crisis. This template is also ideal for training new hires on how to react to such an event.
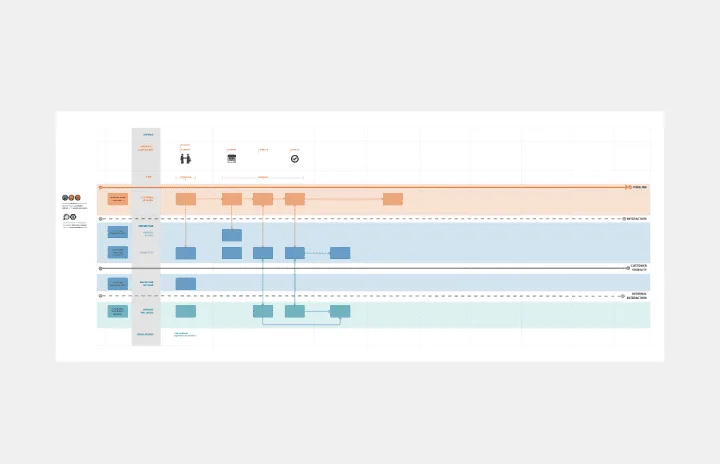
Service Blueprint
Works best for:
Diagramming
The Service Blueprint template is a visual tool for designing and optimizing service experiences. It provides a structured framework for mapping customer journeys, identifying touchpoints, and aligning internal processes. This template enables teams to visualize the entire service ecosystem, uncover pain points, and innovate solutions to enhance customer satisfaction. By promoting customer-centricity and collaboration, the Service Blueprint empowers organizations to deliver exceptional service experiences and drive sustainable growth.

Production Flowchart Template
Works best for:
Flowcharts
The Production Flowchart Template is a well-crafted tool that clearly represents a production process from start to finish. It breaks down complex procedures into easy-to-understand segments, making it easier for stakeholders to grasp the entire process. One of the key benefits of using this template is that it helps to clarify complex production pathways. By mapping out operations visually, teams can identify potential bottlenecks or inefficiencies, facilitating timely and well-informed decision-making.
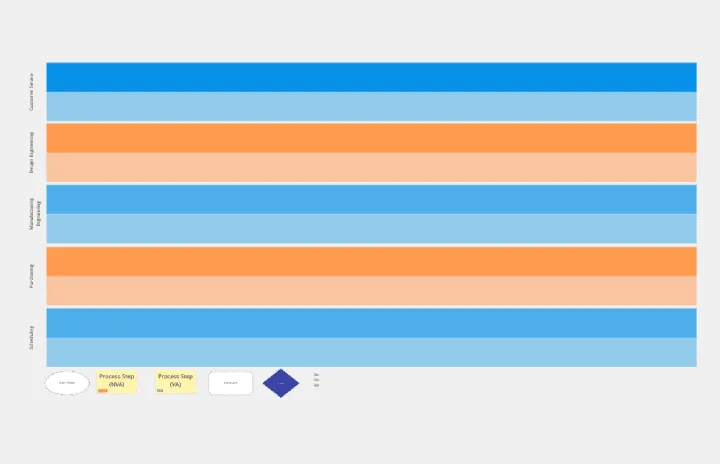
Swim Lane Diagram with Data
Works best for:
Flowchart, Mapping, Diagrams
The Swim Lane Diagram with Data template is a visual tool for illustrating processes or workflows with swimlanes that contain additional data or information. It provides elements for documenting process steps, timelines, and performance metrics within each swimlane. This template enables teams to analyze process efficiency, identify bottlenecks, and make data-driven decisions for process improvement. By combining visual clarity with data insights, the Swim Lane Diagram with Data empowers organizations to optimize workflows and drive continuous improvement effectively.

PI Planning Template
Works best for:
Agile Methodology, Strategic Planning, Software Development
PI planning stands for “program increment planning.” Part of a Scaled Agile Framework (SAFe), PI Planning helps teams strategize toward a shared vision. In a typical PI planning session, teams get together to review a program backlog, align cross-functionally, and decide on the next steps. Many teams carry out a PI planning event every 8 to 12 weeks, but you can customize your planning schedule to fit your needs. Use PI planning to break down features, identify risks, find dependencies, and decide which stories you’re going to develop.
Precedence Diagram
Works best for:
Diagramming, Mapping
The Precedence Diagram Template offers a visual tool that maps out project activities and their interrelated sequences. This diagram empowers teams to recognize and anticipate workflow structures by illustrating the connections and dependencies among tasks.