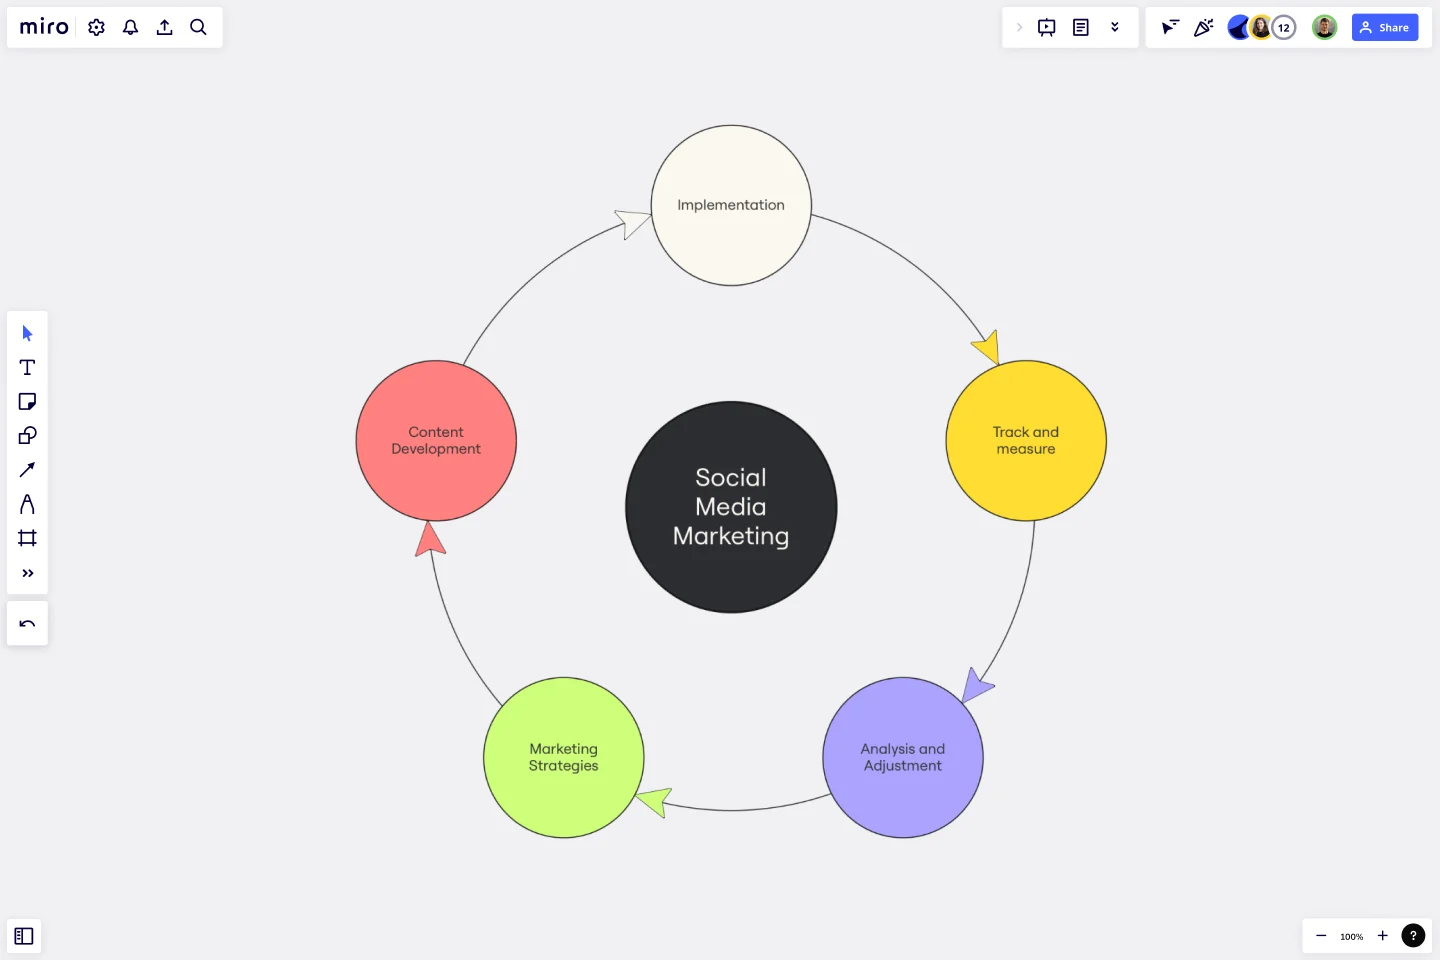
Cycle Diagram Template
Effortlessly represent complex cycles, enhance presentations, and collaborate seamlessly using the cycle diagram template.
Trusted by 65M+ users and leading companies


About the Cycle Diagram Template
The cycle diagram template helps you streamline visual communication by mapping project cycles, illustrating process flows, or visualizing interconnected concepts. With this template, you can create compelling and insightful diagrams that will help you communicate your ideas more effectively.
Understanding the cycle diagram template
Cycle diagrams are a great way to visually represent processes, relationships, or events in an organized manner. They provide a structure that easily depicts the continuous flow and interdependence of elements within a system. You can simplify complex concepts using cycle diagrams, making it an invaluable asset for anyone seeking clarity in their visual storytelling.
How to use the cycle diagram template in Miro
Customize with ease: Effortlessly edit the template by adding, removing, or rearranging elements with just a few clicks.
Automated diagramming: Leverage Miro's automated diagram maker to expand and enhance your cycle diagram. Connect elements seamlessly, allowing the diagram to evolve dynamically as your ideas take shape.
Contextual artifacts: Elevate your diagram by incorporating additional artifacts from your Miro board. Whether it's notes, images, or data, provide context that enriches the understanding of your audience.
Why should you use a cycle diagram template?
Clarity and understanding: The template promotes clarity, enabling you to communicate complex processes with simplicity.
Efficiency in visualization: Quickly map out cyclical relationships and processes, saving time and effort in creating visually impactful diagrams.
Collaborative advantage: Enhance collaboration by creating a shared visual language that fosters clear communication among team members.
Versatility: The template adapts to various contexts, making it suitable for project management, strategic planning, or educational purposes.
Professional Presentation: Elevate your presentations and reports with professionally crafted cycle diagrams that resonate with your audience.
Can I change the colors and styles of the cycle diagram template?
Achieve your desired look by customizing the template with ease. Adjust colors, fonts, and styles by selecting shapes and editing in the context menu bar.
Can I export the cycle diagram to other formats?
Yes, Miro allows you to export your cycle diagram in various formats, ensuring compatibility with your preferred tools and platforms.
Get started with this template right now.
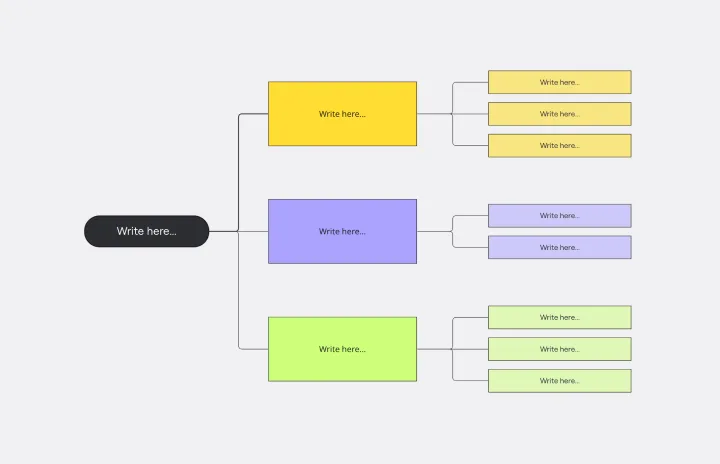
Brace Map Template
Works best for:
Diagramming, Planning
Transform your brainstorming and planning tasks with Miro's Brace Map Template. This powerful visual thinking tool clarifies complex concepts by creating a visual hierarchy that organizes each element precisely. The central idea connects seamlessly to sub-elements through intuitive braces, providing an easily understandable framework. This clarity enhances individual understanding and fosters collaborative efforts, allowing teams to navigate complex ideas with precision and coherence. The Brace Map Template will enable you to organize your thoughts efficiently and solve complexities visually.
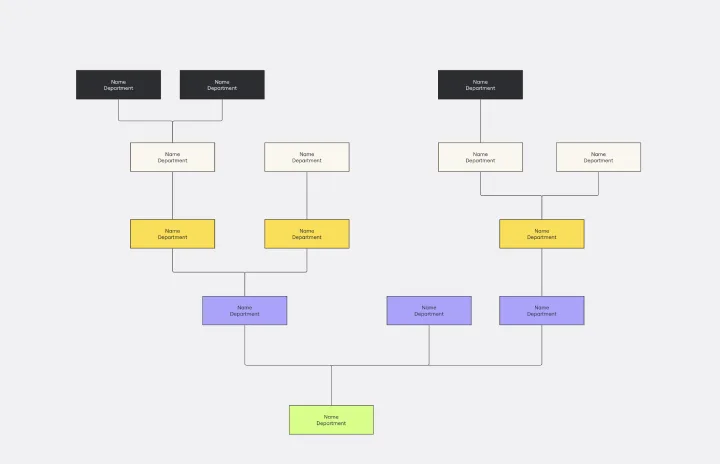
Inverted Org Chart Template
Works best for:
Diagramming, Org Charts, Organizational Design
The Inverted Org Chart Template is a tool that reimagines the traditional hierarchical model by placing frontline employees at the top of the organizational structure. This innovative approach highlights the crucial role played by those who interact with customers directly, ensuring that their insights and contributions are not only recognized but also celebrated. One of the key advantages of this template is that it fosters a feedback-driven environment. Prioritizing frontline workers promotes a culture where valuable insights from the ground can quickly reach the top of the hierarchy, streamlining decision-making processes and ensuring that strategies are based on real-world experiences.
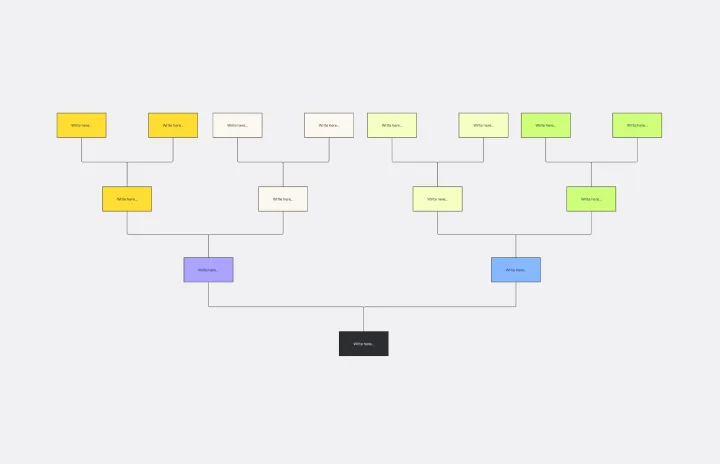
Tree Diagram Template
Works best for:
Diagramming
The tree diagram template helps you organize and present complex information. One of its key benefits is its ability to provide unparalleled visual clarity. It enables you to simplify complicated ideas into a structured, hierarchical format, making it easier to understand and communicate. This template enhances brainstorming sessions, project planning, and decision-making processes by mapping out relationships and dependencies clearly and effortlessly. You can now say goodbye to information overload and immerse yourself in a visual journey that simplifies complexity with the tree diagram template.

Onion Diagram Template
Works best for:
Diagramming, Mapping and Diagramming
The Onion Diagram Template is a distinct tool designed to visually represent layers of a specific concept, system, or process, akin to the layers of an onion. Each concentric layer of the diagram provides insights into a different aspect or phase of the topic at hand, moving from the core foundational element outwards to more peripheral components. One of the prime benefits of this template is its ability to offer hierarchical clarity. Users can immediately discern the importance, sequence, or interrelation of different elements within a system, facilitating enhanced comprehension and efficient decision-making.
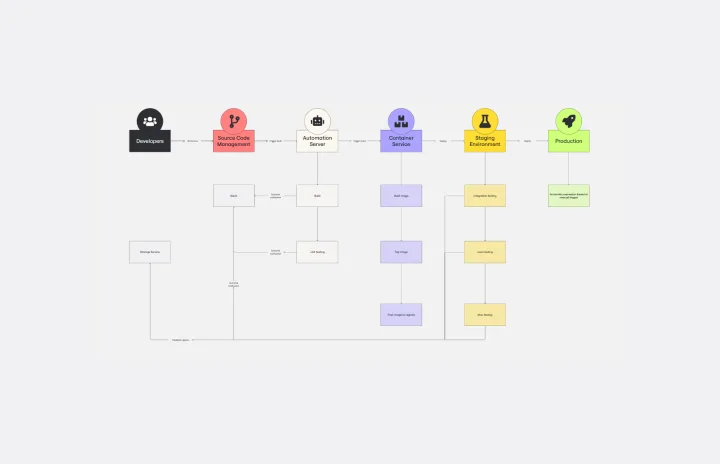
CI/CD Pipeline Diagram Template
Works best for:
Diagramming, Development
The CI/CD template is a well-designed roadmap for software deployment that enables a smooth and automated flow from development to production. This strategic layout includes critical elements such as source code management, automation servers, container orchestration, staging environments, and the final deployment to production. One of the key benefits of using such a template is that it builds a robust deployment pipeline, which significantly reduces manual intervention and human error. By visualizing each step and integrating automation throughout, teams can achieve faster deployment cycles, ensuring that new features, updates, and fixes are delivered to users promptly and reliably. This enhanced pace does not compromise quality, as the template inherently supports continuous testing and quality assurance, ensuring that each update is quick but also secure and stable before it is delivered to the end user.

Driver Diagram Template
Works best for:
Diagramming
The driver diagram template is a strategic visual tool that helps teams map out their primary objectives and break them down into actionable components. It presents goals, drivers, and specific change ideas in a coherent and interconnected format, ensuring clarity of objective. By doing so, every team member is aligned towards a common endpoint, fostering unified efforts. The visual nature of the template simplifies complex objectives, making it easier for teams to stay on track and measure their progress effectively.