Modèles de diagrammes
Vérifiez toutes les étapes essentielles à votre processus de création des diagrammes et obtenez un aperçu complet des opérations grâce à notre collection de modèles de diagrammes. Encouragez votre équipe à agir et à atteindre les résultats attendus pour votre projet.
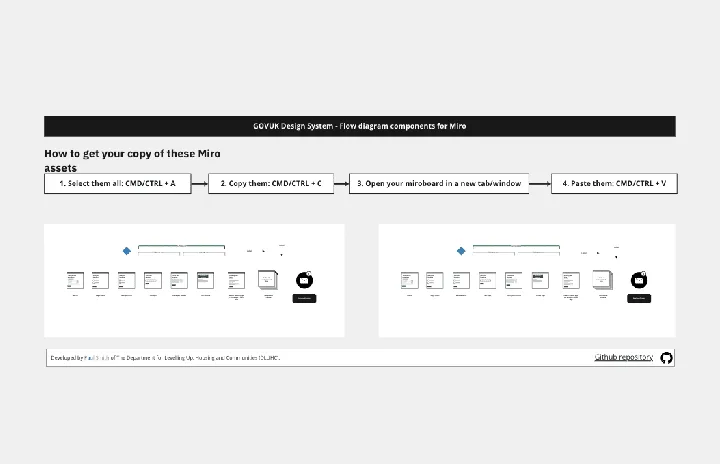
Flow Diagrams
Idéal pour:
Diagramming
The Flow Diagrams template offers a versatile tool for visualizing processes, workflows, and systems. It provides a range of shapes and connectors for creating flowcharts, process maps, and data flow diagrams. This template enables teams to represent complex systems and processes in a clear and structured manner, facilitating communication and decision-making. By promoting visual clarity and understanding, Flow Diagrams empower teams to analyze and optimize processes effectively, driving efficiency and productivity.
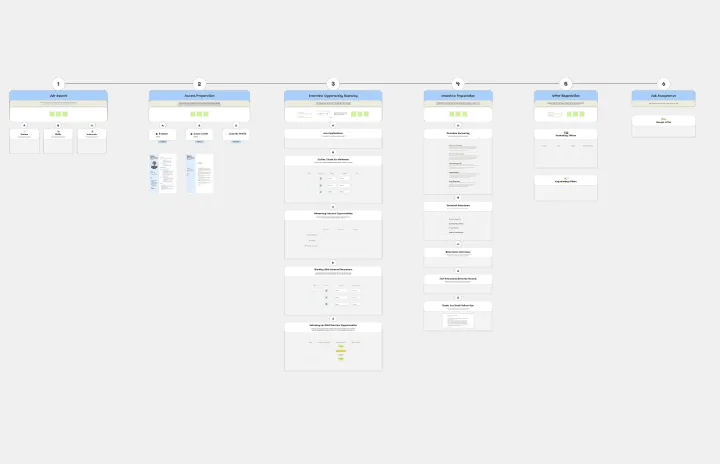
Job Search Process Diagram
Idéal pour:
Diagramming
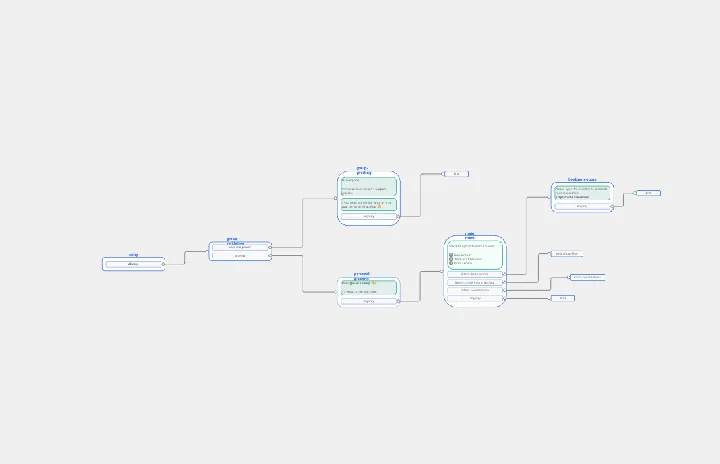
The Job Search Process Diagram template offers a visual tool for mapping out the steps and stages involved in the job search process. It provides a structured framework for organizing tasks, tracking progress, and managing resources. This template enables job seekers to streamline their job search efforts, stay organized, and increase their chances of success. By promoting clarity and efficiency, the Job Search Process Diagram empowers individuals to navigate the job market effectively and achieve their career goals.
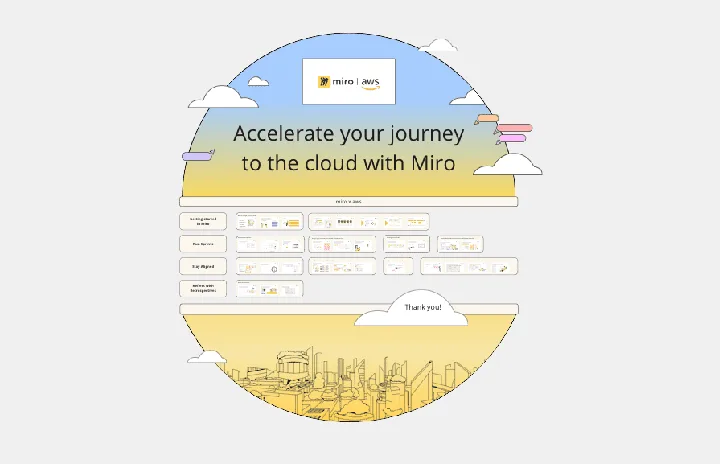
Miro x AWS: Accelerate your cloud journey
Idéal pour:
Diagramming
The Miro x AWS: Accelerate your cloud journey template offers a visual framework for planning and executing cloud migration and optimization projects using Amazon Web Services (AWS). It provides elements for mapping out cloud architectures, migration strategies, and cost optimization initiatives. This template enables teams to collaborate effectively, align on objectives, and accelerate their cloud journey with AWS services. By promoting collaboration and alignment, the Miro x AWS template empowers organizations to leverage AWS cloud technologies efficiently and achieve their business objectives effectively.
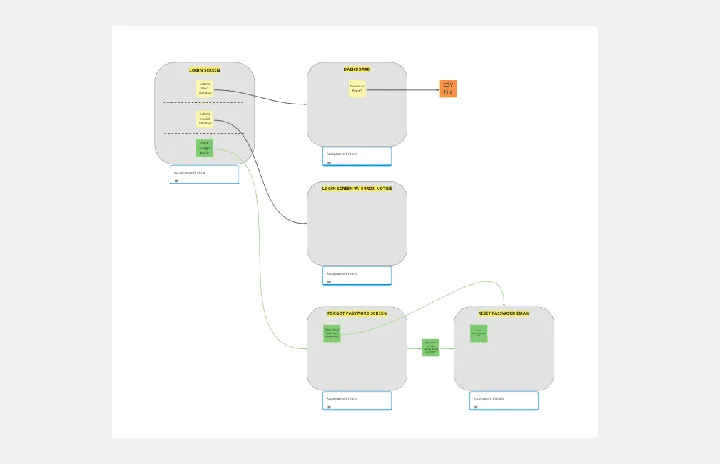
Breadboard (UI Flow Diagram)
Idéal pour:
Diagramming
The Breadboard (UI Flow Diagram) template offers a visual framework for designing and prototyping user interfaces (UIs) using the breadboard method. It provides elements for arranging UI components and defining user interactions. This template enables designers and developers to create interactive UI prototypes quickly and iteratively, facilitating user testing and feedback. By promoting rapid prototyping and experimentation, the Breadboard (UI Flow Diagram) empowers teams to design intuitive and user-friendly digital experiences effectively.
Affinity Diagram by UserPeek
Idéal pour:
Diagramming
The Affinity Diagram template is a visual tool for organizing and categorizing ideas, data, or issues into related groups. It provides a structured framework for conducting group brainstorming and affinity grouping activities. This template enables teams to synthesize information, identify patterns, and generate insights collaboratively. By promoting creativity and collaboration, the Affinity Diagram empowers teams to organize and prioritize information effectively, driving decision-making and problem-solving processes efficiently.
Interrelationship Diagram
Idéal pour:
Diagramming
The Interrelationship Diagram template is a visual tool for analyzing and illustrating complex relationships between variables or elements within a system. It provides a structured framework for mapping out connections, dependencies, and interactions. This template enables teams to visualize patterns, identify causal relationships, and uncover insights into system behavior. By promoting systems thinking and understanding of interdependencies, the Interrelationship Diagram empowers organizations to make informed decisions and drive effective solutions to complex problems.
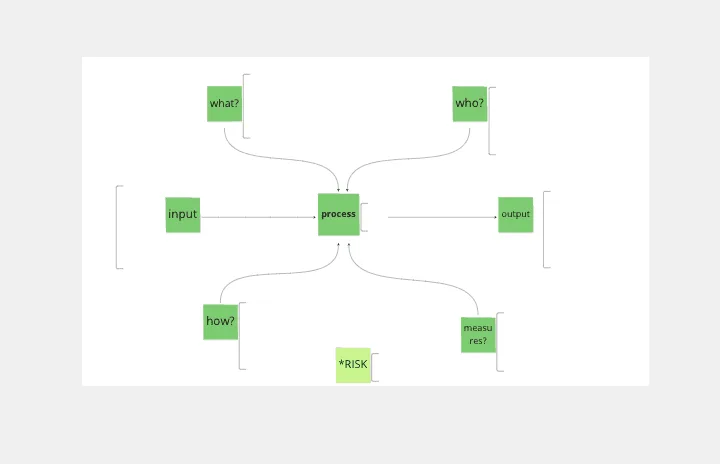
Turtle Diagram for BA
Idéal pour:
Diagramming
The Turtle Diagram for BA template offers a visual framework for defining and auditing business processes according to ISO 9001 standards. It provides elements for documenting process inputs, outputs, activities, and controls. This template enables organizations to ensure compliance, identify process improvements, and enhance quality management practices. By promoting systematic process documentation and auditability, the Turtle Diagram for BA empowers organizations to achieve and maintain ISO 9001 certification, demonstrating commitment to quality and continuous improvement.
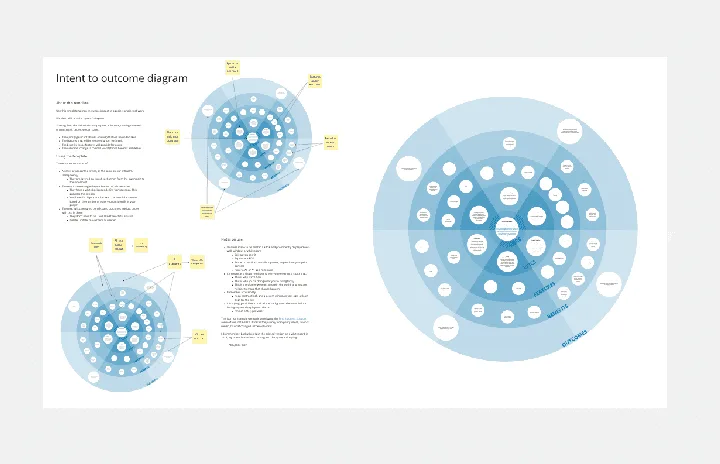
Intent to Outcome Diagram
Idéal pour:
Diagramming
The Intent to Outcome Diagram template is a visual tool for mapping out the relationship between desired outcomes and the actions required to achieve them. It provides a structured framework for defining intentions, outcomes, and key activities. This template enables teams to align on goals, track progress, and identify areas for improvement. By promoting clarity and alignment, the Intent to Outcome Diagram empowers organizations to set strategic direction and drive results effectively.
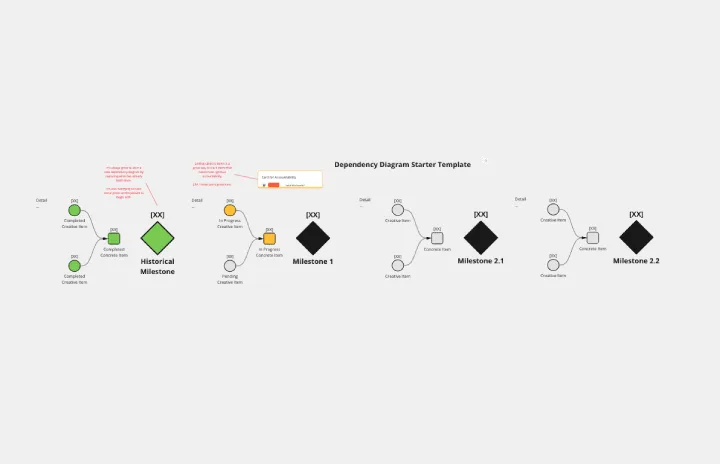
Dependency Diagrams Educational Board
Idéal pour:
Diagramming
The Dependency Diagrams Educational Board template provides a visual tool for teaching and learning about dependency relationships between components in systems. It offers a structured framework for illustrating dependencies, connections, and interactions within a system or process. This template enables educators to explain complex concepts effectively and engage learners in interactive activities. By promoting visual learning and understanding of dependencies, Dependency Diagrams empower students to grasp fundamental principles of systems thinking and analysis.
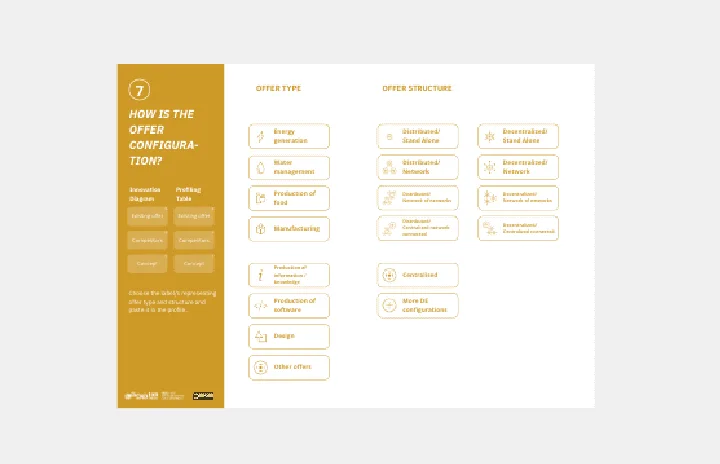
Innovation Diagram_S.PSS
Idéal pour:
Diagramming
The Innovation Diagram_S.PSS template offers a visual framework for mapping out the innovation process using the S.PSS (Service Product System Strategy) approach. It provides elements for defining service components, product features, and system interactions. This template enables teams to visualize and communicate their innovation strategy, facilitating alignment and collaboration across stakeholders. By promoting systematic innovation and holistic thinking, the Innovation Diagram_S.PSS empowers organizations to drive sustainable growth and competitive advantage through service and product innovation.
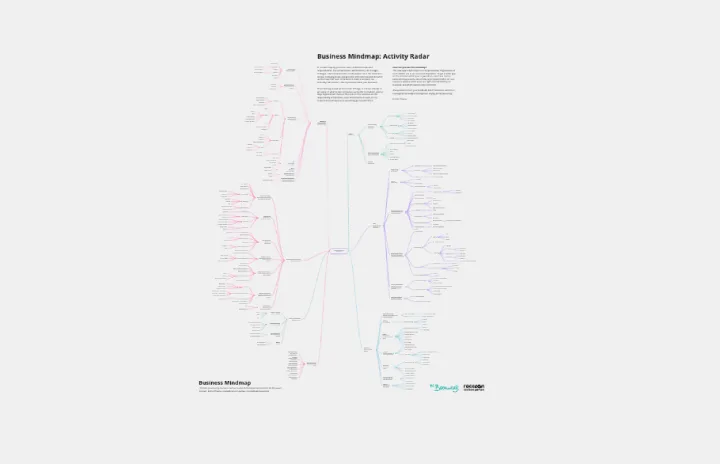
Business Mindmap
Idéal pour:
Diagramming
The Business Mindmap template is a visual tool for brainstorming, organizing, and presenting business ideas and concepts. It provides a structured framework for capturing and connecting thoughts, insights, and action items. This template enables teams to explore business strategies, analyze market trends, and develop innovative solutions. By promoting creativity and collaboration, the Business Mindmap empowers teams to generate and communicate actionable business plans effectively.

Causal Loop Diagrams (1.0)
Idéal pour:
Diagramming
The Causal Loop Diagrams (1.0) template offers a visual tool for modeling complex systems and understanding the feedback loops that drive behavior. It provides a structured framework for identifying causal relationships, reinforcing loops, and balancing feedback within a system. This template enables teams to analyze system dynamics, anticipate unintended consequences, and formulate effective strategies for intervention. By promoting systems thinking and understanding of interdependencies, Causal Loop Diagrams empower organizations to navigate complexity and drive sustainable change.
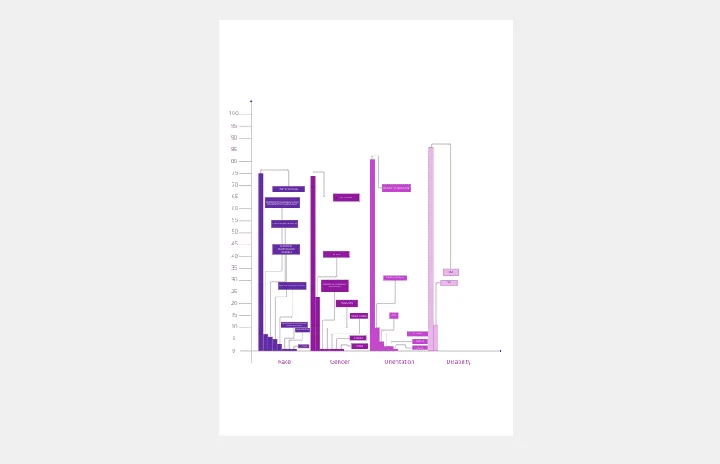
Bar Chart / Diagram Combined
Idéal pour:
Diagramming
The Bar Chart / Diagram Combined template offers a versatile tool for creating visualizations that combine bar charts with other diagrammatic elements. It provides elements for representing data trends, relationships, and comparisons effectively. This template enables teams to create customized visualizations that communicate complex information in a clear and compelling manner. By promoting visual clarity and insight, the Bar Chart / Diagram Combined template empowers teams to make data-driven decisions and communicate findings with impact.
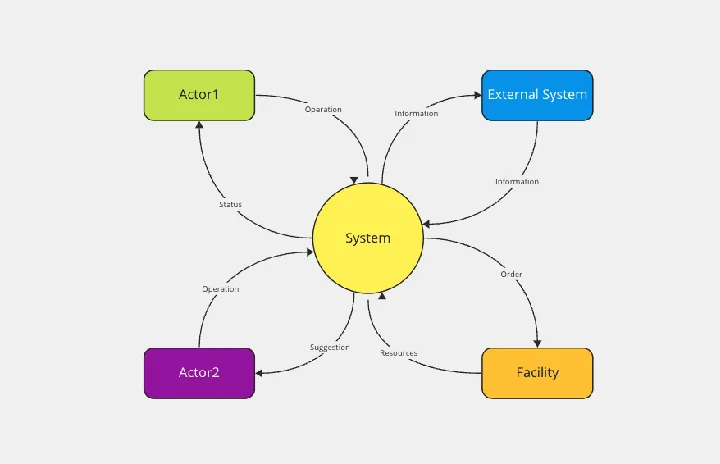
System Context Diagram
Idéal pour:
Diagramming
The System Context Diagram template is a visual tool for illustrating the relationships between a system and its external entities. It provides elements for depicting system boundaries, interfaces, and interactions with external stakeholders. This template enables teams to understand the broader context in which a system operates, facilitating requirements analysis and design decision-making. By promoting clarity and alignment, the System Context Diagram empowers teams to design systems that meet stakeholder needs and integrate seamlessly with their environment.
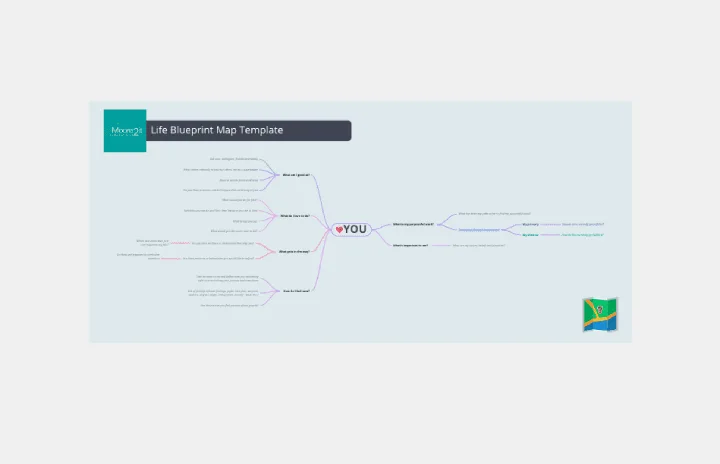
Personal Life Blueprint - Clarity Facilitator
Idéal pour:
Diagramming
The Personal Life Blueprint Clarity Facilitator template is a visual tool for individuals to clarify their personal goals, values, and priorities. It provides a structured framework for reflecting on different aspects of life and setting actionable objectives. This template enables individuals to gain clarity, focus, and direction in their personal and professional lives. By promoting self-awareness and goal-setting, the Personal Life Blueprint empowers individuals to lead more fulfilling and purpose-driven lives.
Cloud Blueprint
Idéal pour:
Diagramming
The Cloud Blueprint template offers a visual framework for designing and planning cloud-based architectures. It provides elements for mapping out cloud services, components, and dependencies. This template enables teams to visualize and communicate complex cloud infrastructure designs, facilitating collaboration and decision-making. By promoting clarity and alignment, the Cloud Blueprint empowers organizations to design scalable, resilient, and secure cloud solutions that meet business requirements and objectives.
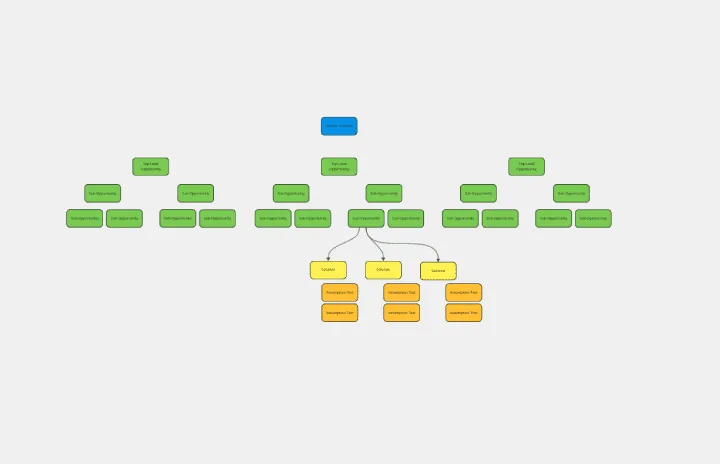
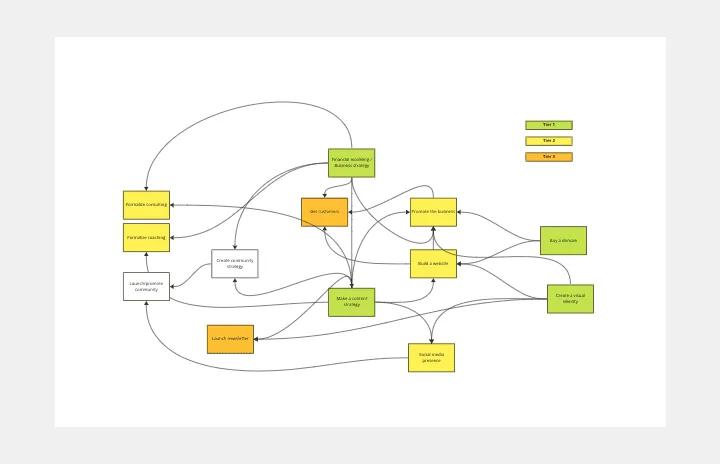
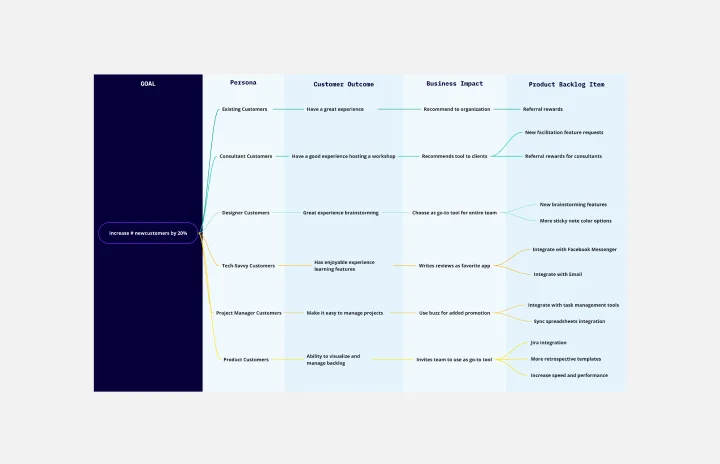
Opportunity Solution Tree
Idéal pour:
Diagramming
The Opportunity Solution Tree template is a visual tool for identifying and prioritizing opportunities and solutions. It provides a structured framework for mapping customer needs, pain points, and potential solutions. This template enables teams to explore divergent ideas, evaluate alternatives, and focus on high-impact solutions. By promoting customer-centricity and innovation, the Opportunity Solution Tree empowers teams to address market needs effectively and deliver value-driven solutions.

20/80 Process Diagram - EOS Compatible
Idéal pour:
Diagramming
The 20/80 Process Diagram - EOS® Compatible template is a visual tool for mapping out processes and workflows aligned with the Entrepreneurial Operating System (EOS®) methodology. It provides a structured framework for identifying core processes and key activities that drive business outcomes. This template enables organizations to streamline operations, clarify roles and responsibilities, and enhance accountability. By promoting alignment with EOS® principles, the 20/80 Process Diagram empowers teams to achieve organizational excellence and drive sustainable growth.
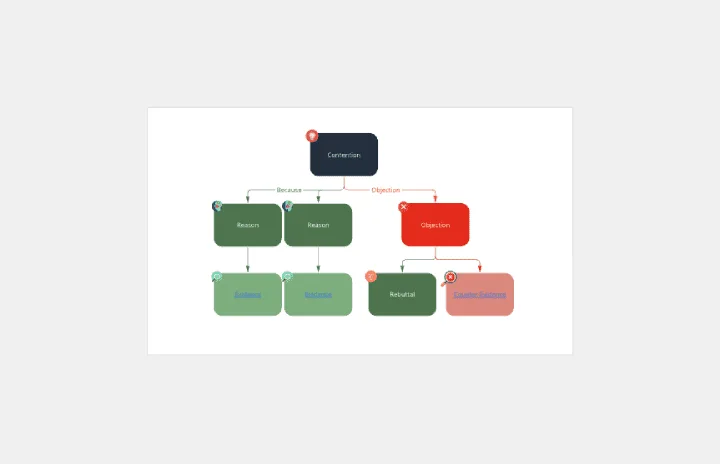
Argument Map
Idéal pour:
Diagramming
The Argument Map template is a visual tool for structuring and analyzing arguments and debates. It provides a structured framework for capturing premises, conclusions, and logical relationships. This template enables teams to explore complex issues, identify strengths and weaknesses in arguments, and make informed decisions. By promoting clarity and critical thinking, the Argument Map template empowers teams to navigate debates and discussions effectively, fostering consensus and understanding.
Chat-Bot
Idéal pour:
Diagramming
The Chat Bot template is a visual tool for designing and mapping out chatbot interactions and functionalities. It provides a structured framework for visualizing conversation flows, user inputs, and bot responses. This template enables teams to collaborate on designing chatbot experiences that are intuitive and user-friendly, driving engagement and satisfaction. By promoting clarity and alignment, the Chat-Bot template empowers organizations to create effective chatbot solutions that meet user needs and business objectives.
Modèle Mental
Idéal pour:
Business Management, Mind Mapping, Diagrams
Des solutions intelligentes et des décisions stratégiques fortes — les meilleures organisations prennent les deux, et un modèle mental est conçu pour les aider à le faire. La création d'un modèle mental vous permettra de prendre les meilleures décisions de conception en donnant à votre équipe une base solide de recherche et un moyen d'examiner l'ensemble de l'expérience utilisateur. Nous vous offrons un moyen simple et rapide de l'essayer : il vous suffit de remplir notre modèle flexible et prêt à l'emploi et d'ajouter des pense-bêtes, des formes et des flèches pour créer une carte puissante.
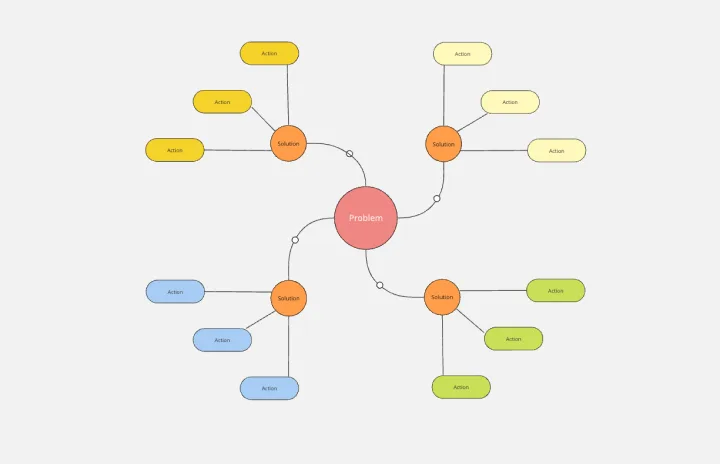
Modèle de carte cognitive
Idéal pour:
Modélisation & Diagrammes, Diagrammes, Brainstorming
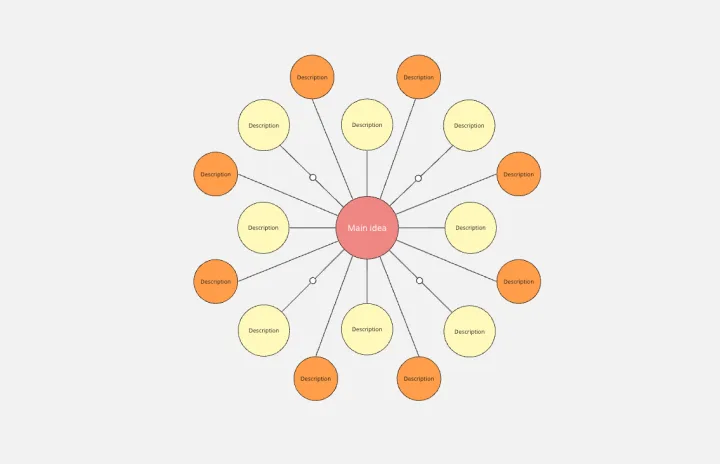
Un modèle de carte cognitive est un outil d'organisation visuelle qui utilise des bulles ou des cercles pour représenter diverses idées ou points de données. Ces bulles sont reliées entre elles, ce qui permet d'afficher leurs relations et de créer un réseau de pensées interconnectées. Le modèle de carte cognitive permet de rationaliser des informations complexes, d'améliorer la compréhension et de favoriser une prise de décision efficace.
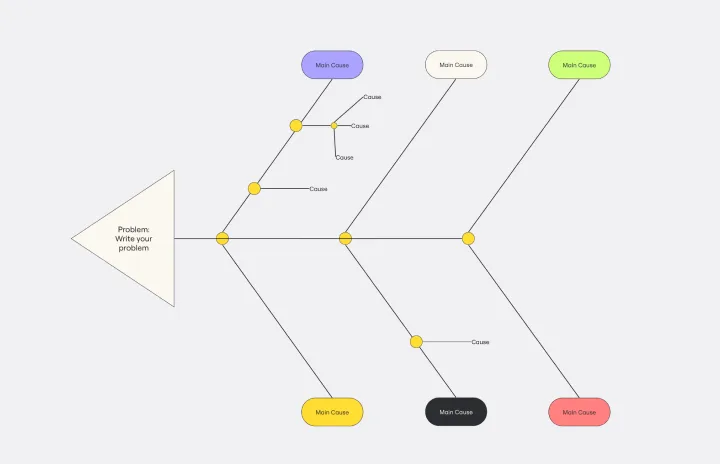
Cause and Effect Diagram Template
Idéal pour:
Diagramming
The Cause and Effect Diagram Template is a useful tool for analyzing complex relationships, identifying root causes of problems, and improving organizational processes. It can be customized to fit user's unique needs and provides a structured framework for analysis. Teams can use real-time collaborative analysis on the Miro platform to drive continuous improvement initiatives.
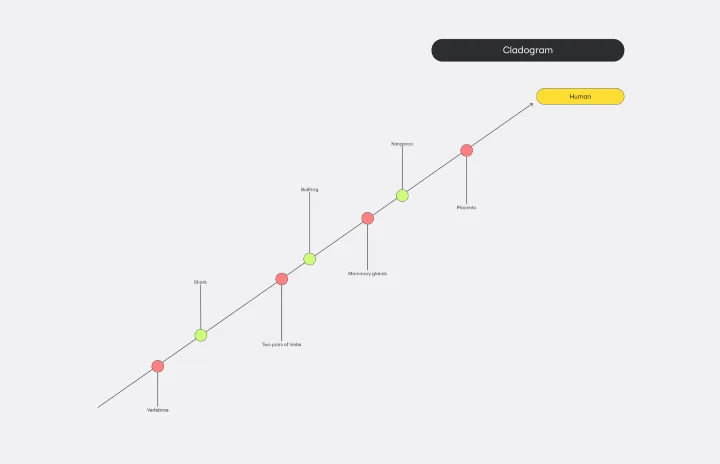
Cladogram Template
Idéal pour:
Diagramming
The Cladogram Template offers seamless adaptability, empowering users to change, expand, and refine evolutionary representations with ease. Its intuitive interface and automated features ensure dynamic and responsive diagrams that keep up with evolving knowledge. Say goodbye to static diagrams and welcome fluidity and adaptability with Miro's Cladogram Template.
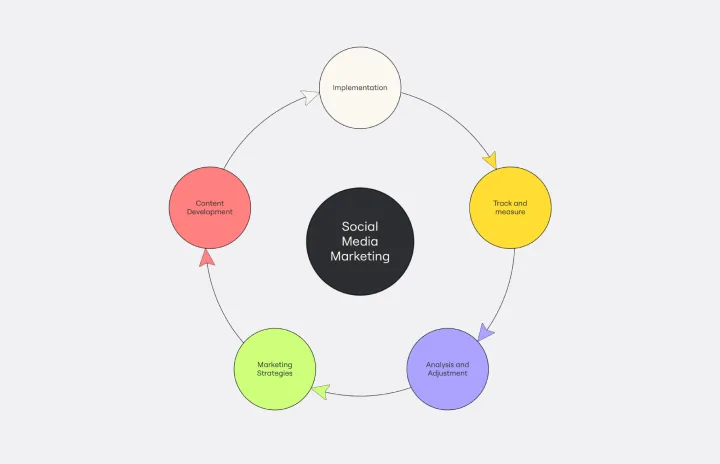
Modèle de Diagramme de Cycle
Idéal pour:
Diagrammes
Le modèle de diagramme de cycle permet aux professionnels de représenter visuellement des cycles complexes avec précision et clarté. Ce modèle présente des processus, des relations ou des événements cycliques, ce qui permet de communiquer des concepts complexes de manière transparente. L'un des principaux avantages de ce modèle est sa capacité à rationaliser la communication et à améliorer la compréhension. En créant des diagrammes de cycle visuellement attrayants, les professionnels peuvent distiller des informations complexes dans un langage visuel clair, ce qui permet aux équipes et aux parties prenantes de saisir plus facilement les relations complexes. Cela favorise une collaboration et une prise de décision plus efficaces.
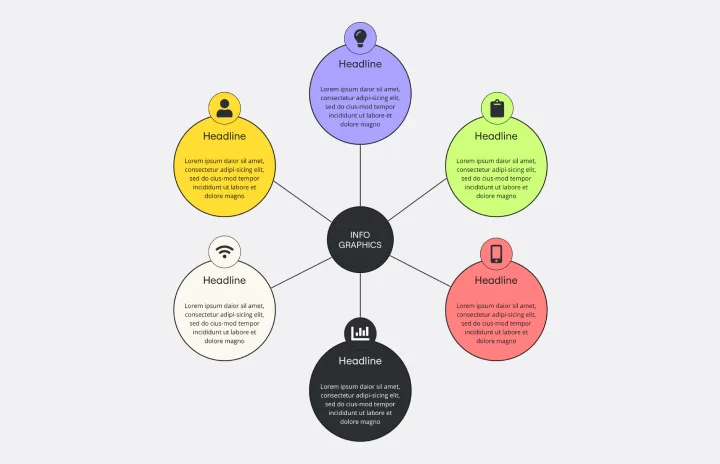
Web Diagram Template
Miro's Web Diagram Template simplifies complex project organization and promotes effective communication. It allows users to easily connect elements and gain a comprehensive understanding of complex relationships, making it a versatile and invaluable asset for diverse projects.
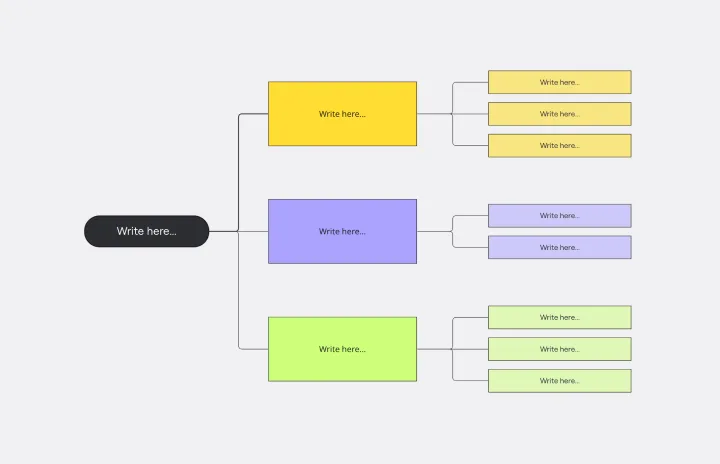
Tree Diagram Template
Idéal pour:
Diagramming
The tree diagram template helps you organize and present complex information. One of its key benefits is its ability to provide unparalleled visual clarity. It enables you to simplify complicated ideas into a structured, hierarchical format, making it easier to understand and communicate. This template enhances brainstorming sessions, project planning, and decision-making processes by mapping out relationships and dependencies clearly and effortlessly. You can now say goodbye to information overload and immerse yourself in a visual journey that simplifies complexity with the tree diagram template.
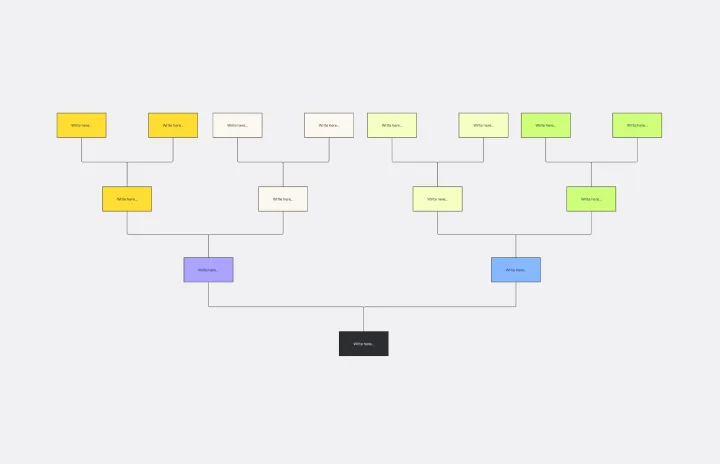
Brace Map Template
Idéal pour:
Diagramming, Planning
Transform your brainstorming and planning tasks with Miro's Brace Map Template. This powerful visual thinking tool clarifies complex concepts by creating a visual hierarchy that organizes each element precisely. The central idea connects seamlessly to sub-elements through intuitive braces, providing an easily understandable framework. This clarity enhances individual understanding and fosters collaborative efforts, allowing teams to navigate complex ideas with precision and coherence. The Brace Map Template will enable you to organize your thoughts efficiently and solve complexities visually.
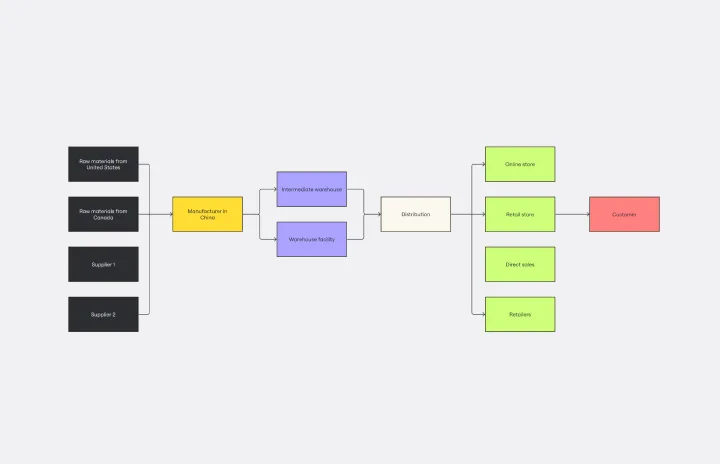
Supply Chain Diagram Template
Idéal pour:
Diagramming
The Supply Chain Diagram Template is great for businesses to streamline and enhance their supply chain processes. This template lets you visualize the entire supply chain, from sourcing raw materials to delivering finished products. Its intuitive layout simplifies complex networks, making identifying key areas and potential bottlenecks easier. One of the standout benefits of using this template is its clarity. It bridges the gap between complex processes and strategic decision-making by presenting a clear, visual supply chain representation. This clarity enables teams to pinpoint inefficiencies and implement more effective management strategies, which optimizes operations and facilitates better communication and understanding across different departments within an organization.
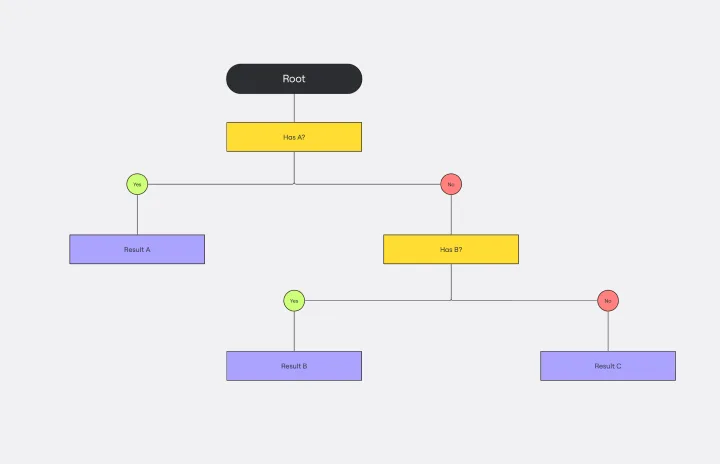
Dichotomous Key Template
Idéal pour:
Diagramming
The Dichotomous Key Template stands out as an exceptional tool for simplifying complex classification processes, significantly enhancing learning experiences. Breaking down intricate subjects into a series of binary decisions transforms how information is absorbed and understood. This systematic approach not only aids in retaining intricate details but also makes the learning process more engaging and interactive. Whether for educational purposes or professional use, the template’s design fosters a deeper comprehension of the subject matter, allowing learners and professionals to navigate complex scenarios with clarity and ease.

Force Field Analysis Template
Idéal pour:
Diagramming, Strategic Planning
A Force Field Analysis Template is a powerful tool that helps teams identify and analyze the forces supporting or hindering progress toward a specific change or goal. This template provides a visual space where you can brainstorm and plot out 'driving forces' that push objectives forward and 'restraining forces' that prevent advancement, all on a single, intuitive board. One of the primary benefits of utilizing the Force Field Analysis template is that it fosters a shared understanding among team members. By visually mapping out and discussing each force, teams can prioritize efforts, build consensus on the central issues to tackle, and collaboratively devise strategic plans to strengthen positive influences while reducing negative ones.
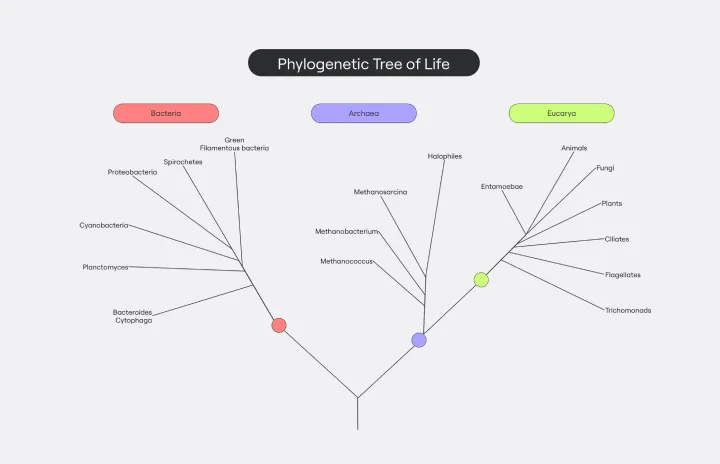
Phylogenetic Tree Template
Idéal pour:
Diagramming
The Phylogenetic Tree Template is a powerful tool that allows scientists and researchers to visualize evolutionary relationships between species. It is a visual representation of the history of the evolution of life on Earth and helps users identify the relationships between other organisms and their ancestors. The key benefit of this template is that it organizes complex data and makes it more understandable to everyone. Additionally, it offers an efficient way to collect and analyze data, saving time and effort and enabling users to identify significant patterns and relationships in the data.
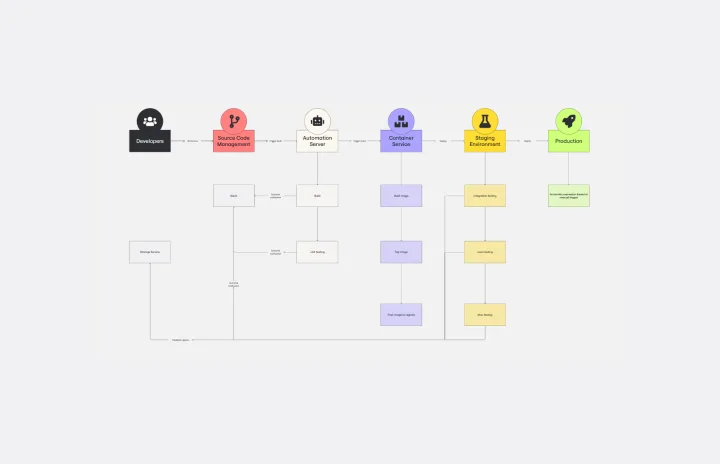
CI/CD Pipeline Diagram Template
Idéal pour:
Diagramming, Development
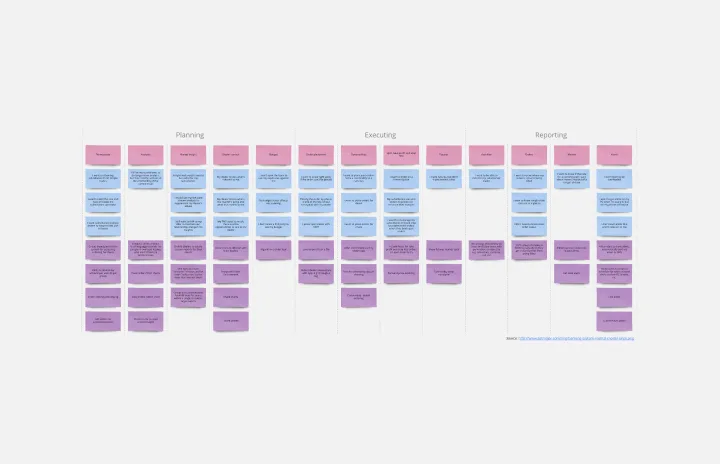
The CI/CD template is a well-designed roadmap for software deployment that enables a smooth and automated flow from development to production. This strategic layout includes critical elements such as source code management, automation servers, container orchestration, staging environments, and the final deployment to production. One of the key benefits of using such a template is that it builds a robust deployment pipeline, which significantly reduces manual intervention and human error. By visualizing each step and integrating automation throughout, teams can achieve faster deployment cycles, ensuring that new features, updates, and fixes are delivered to users promptly and reliably. This enhanced pace does not compromise quality, as the template inherently supports continuous testing and quality assurance, ensuring that each update is quick but also secure and stable before it is delivered to the end user.
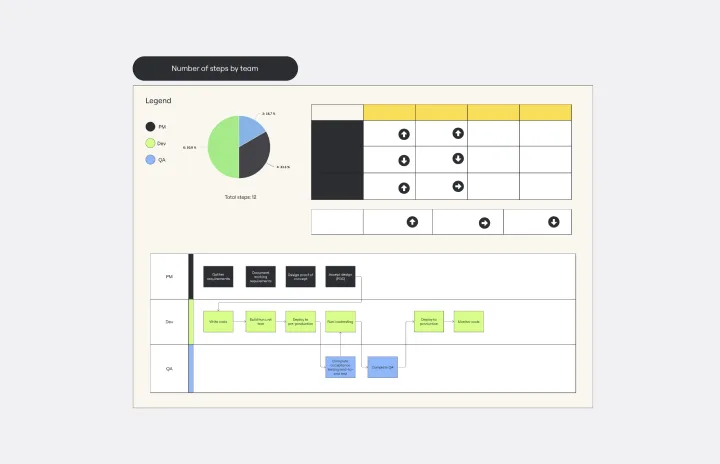
SDLC Template
Idéal pour:
Diagramming
The Software Development Life Cycle (SDLC) template is a well-designed visual tool that helps software development teams follow a structured approach from the initial concept to the final deployment of the software. One of the most significant benefits of using this template is that it promotes clear, streamlined communication among team members. By breaking the development cycle into distinct phases, all stakeholders can stay informed about the progress of the project and understand their responsibilities within the larger context. This enhanced communication reduces the chances of misunderstandings and ensures that everyone works together towards the common goal of delivering high-quality software. The template acts not only as a roadmap but also as a shared language for the team, improving collaboration and the efficient progression of the project through each critical stage.
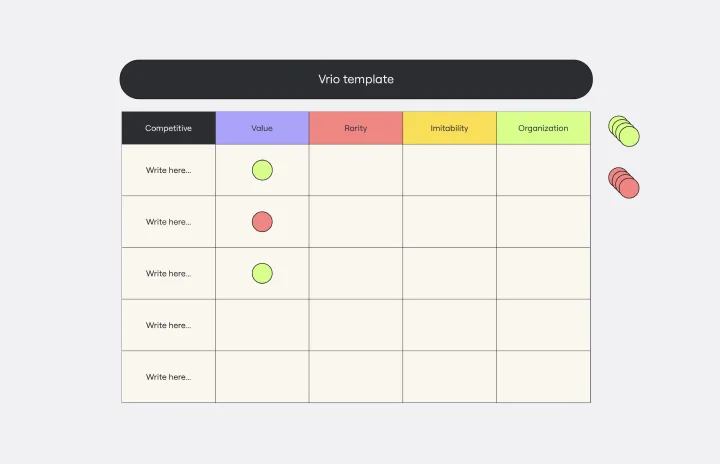
VRIO Analysis Template
Idéal pour:
Diagramming, Strategy
The VRIO Analysis Template is a framework that helps businesses evaluate their resources and capabilities for competitive advantage. It categorizes resources into four areas: Value, Rarity, Imitability, and Organization. This provides a comprehensive view of an organization's strengths and potential weaknesses. The template has the key benefit of offering quick visual insights. Decision-makers can immediately identify and focus on resources that are valuable, rare, hard to imitate, and well-organized. This ensures a sustainable competitive edge and saves time by avoiding lengthy textual analyses.
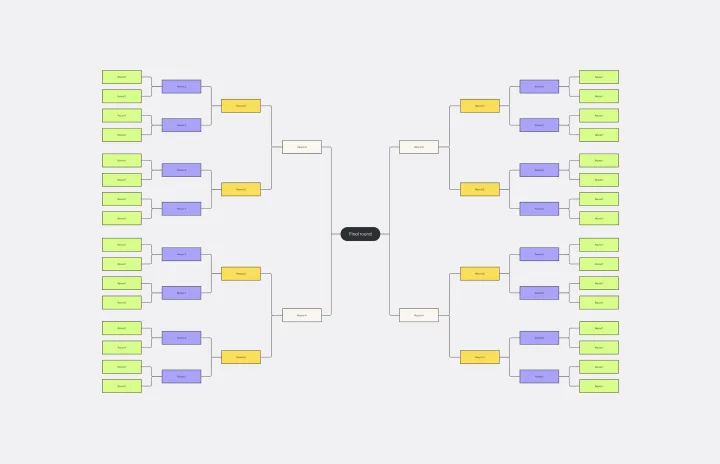
Bracket Template
Idéal pour:
Diagramming
The Bracket Template is a dynamic visualization tool that helps to organize and rank ideas, entities, or teams in a sequential and competitive manner. It is structured like a tree, starting with multiple entries on either side, which then face off in successive rounds, leading to a single winner or conclusion. One of its standout benefits is its ability to simplify complex decision-making processes. Breaking down choices into smaller, head-to-head comparisons, makes the path to a final decision clearer, ensuring clarity and fostering engagement among participants. Moreover, the Bracket Template is particularly useful when there are multiple options to consider and when there is a need to compare and contrast those options. It is an effective way to streamline decision-making, making it easier and more efficient.

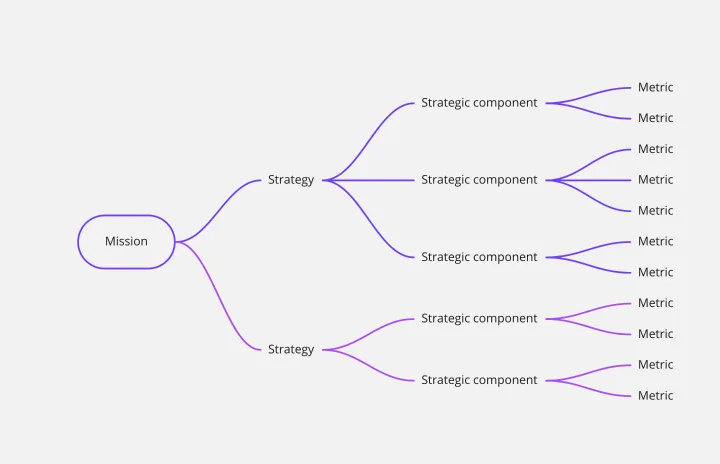
Driver Diagram Template
Idéal pour:
Diagramming
The driver diagram template is a strategic visual tool that helps teams map out their primary objectives and break them down into actionable components. It presents goals, drivers, and specific change ideas in a coherent and interconnected format, ensuring clarity of objective. By doing so, every team member is aligned towards a common endpoint, fostering unified efforts. The visual nature of the template simplifies complex objectives, making it easier for teams to stay on track and measure their progress effectively.
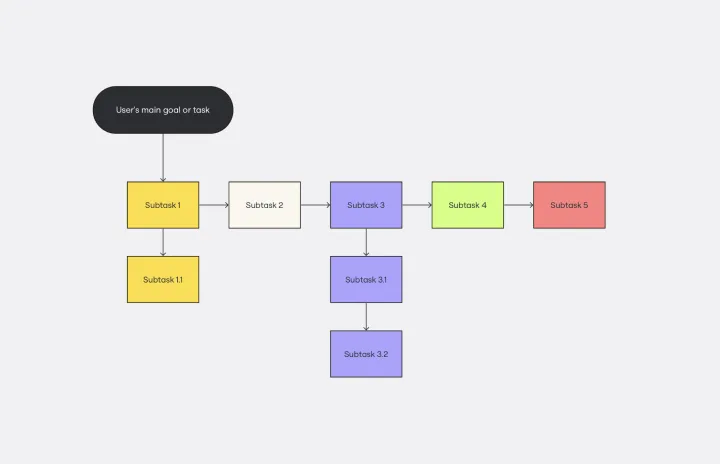
Task Analysis Diagram Template
Idéal pour:
Diagramming
The Task Analysis Diagram Template is a helpful tool that simplifies complex tasks by breaking them down into smaller, more manageable steps. This strategic approach brings clarity and ensures a systematic method for tackling complex user paths. The template's most significant advantage is its precision, as it maps out every detail of a task to guarantee that nothing is missed. This results in more efficient operations.
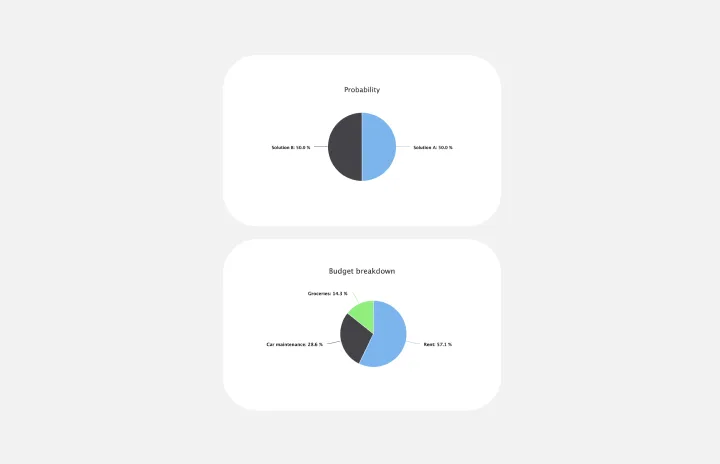
Modèle Diagramme Circulaire
Idéal pour:
Education, Opérations
Les diagrammes circulaires sont un excellent moyen de présenter graphiquement les relations entre des ensembles de données, ce qui vous permet de comparer rapidement des informations et de voir immédiatement des contrastes. Les professionnels de nombreux domaines utilisent les diagrammes circulaires pour étayer leurs présentations et enrichir leurs récits, car il s'agit de l'un des diagrammes de données les plus couramment utilisés.
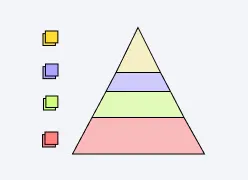
Modèle Diagramme Pyramide
Idéal pour:
Business Management, Strategic Planning, Prioritization
Un diagramme pyramide est un outil parfait pour présenter des concepts qui peuvent être décomposés en une hiérarchie à plusieurs niveaux. Chaque niveau de la pyramide s'appuie sur celui qui le précède, illustrant clairement comment certaines actions conduisent à des résultats spécifiques. Le modèle de diagramme pyramide de Miro est votre outil pour toutes les illustrations pyramidales.
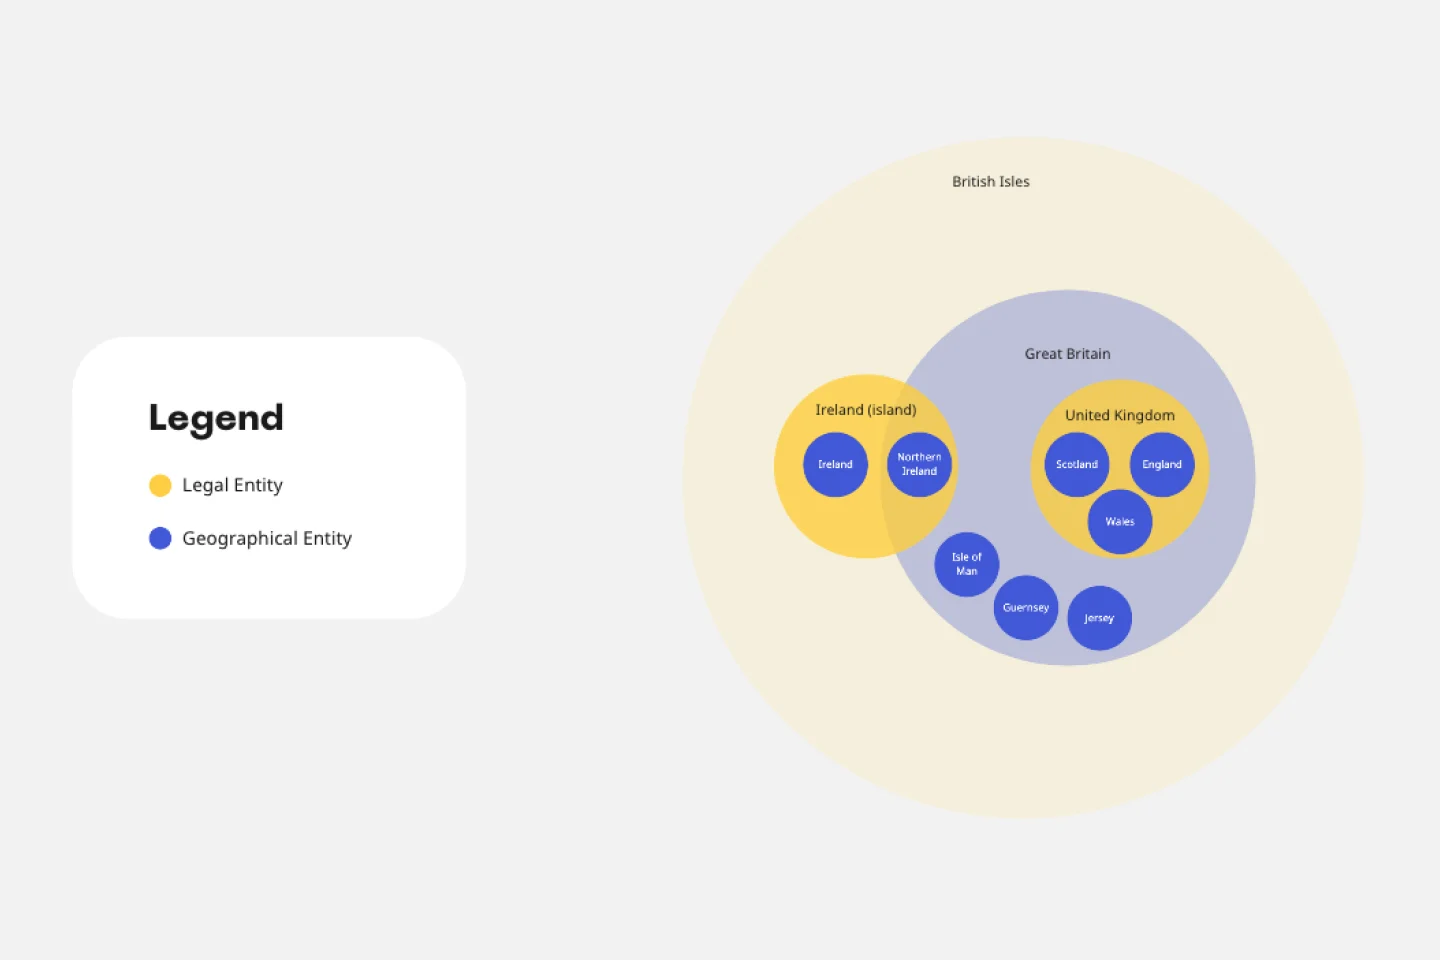
Modèle Diagramme d'Euler
Idéal pour:
Business Management, Operations, Diagrams
Les diagrammes d'Euler sont précieux pour montrer les différentes relations entre des sujets en les représentant par des cercles ou des "cellules". Les diagrammes d'Euler sont fréquemment utilisés dans les systèmes informatiques pour montrer comment des objets sont liés les uns aux autres et comment ils interagissent. Cependant, vous pouvez les utiliser pour tout type d'explication qui nécessite de montrer des connexions.
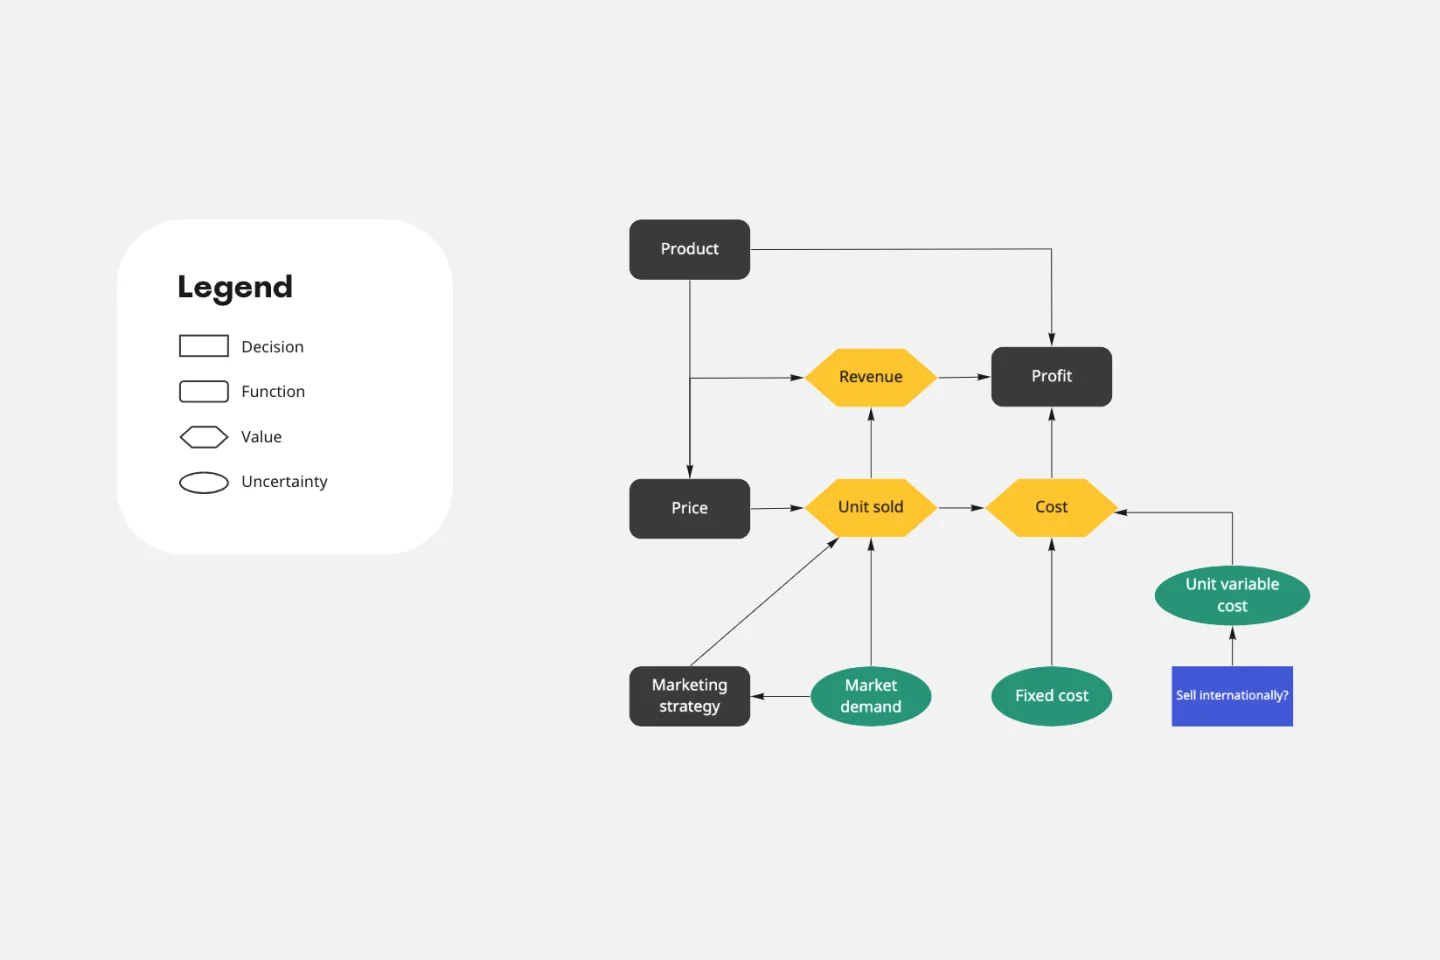
Modèle Diagramme d'Influence
Idéal pour:
Business Management, Decision Making, Diagrams
Ayez une vue d'ensemble de vos décisions commerciales grâce à ce modèle de Diagramme d'Influence. Vous déterminerez la décision à prendre et réfléchirez à tous les facteurs susceptibles de l'influencer. En établissant des liens entre ces facteurs, vous serez en mesure d'accorder à chacun d'eux l'importance qu'il mérite au moment de prendre votre décision.
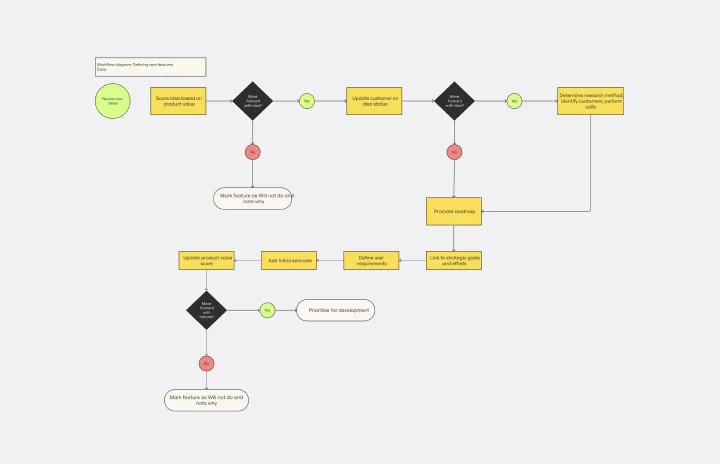
Modèle de Diagramme de Flux de Travail
Idéal pour:
Diagrammes, Cartographie des processus, Gestion de projet
Le modèle de diagramme de flux de travail décrit et représente des processus ou des systèmes à l'aide de symboles et de formes normalisés. En délimitant les différentes étapes d'un processus, il permet de s'assurer que les tâches se déroulent de manière fluide, de leur lancement à leur aboutissement. L'un des principaux avantages de l'utilisation de ce modèle est sa clarté. En traduisant les processus dans un format visuel, tous les participants peuvent les comprendre d'un seul coup d'œil, ce qui élimine toute confusion et garantit que tout le monde est sur la même longueur d'onde. Cette clarté favorise non seulement l'exécution efficace des tâches, mais aussi la collaboration entre les membres de l'équipe.
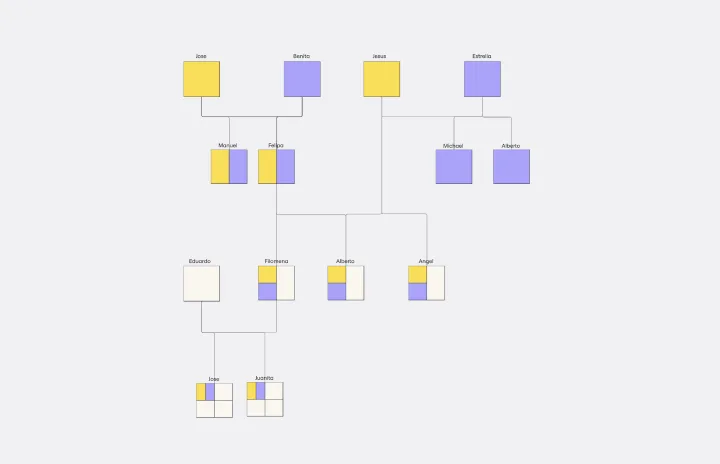
Modèle de génogramme
Idéal pour:
Diagrammes
Le modèle de génogramme présente les structures et les relations familiales avec une profondeur et un niveau de détail exceptionnels. Contrairement aux arbres généalogiques traditionnels, ce modèle offre une perspective globale en englobant les liens familiaux, les liens affectifs et les événements marquants de la vie. Créez un génogramme pour mettre au jour des modèles et des tendances au sein d'une famille, qu'ils soient héréditaires ou environnementaux. Les professionnels de différents domaines peuvent acquérir une compréhension holistique de la dynamique familiale en montrant une vision approfondie des nuances des relations, ce qui facilite la communication et la résolution des problèmes.
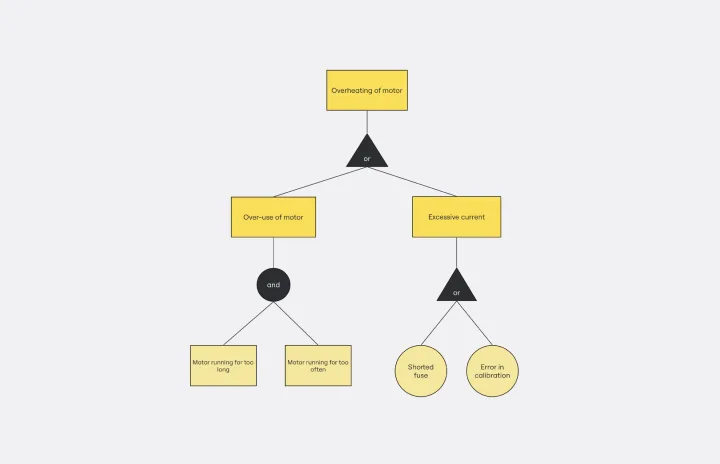
Fault Tree Analysis Template
Idéal pour:
Diagramming
The Fault Tree Analysis Template visually breaks down potential system malfunctions, highlighting complex causal relationships between faults. One of its standout benefits is its ability to enhance clarity in complex scenarios, allowing professionals to swiftly pinpoint root causes and prioritize interventions, ensuring a more streamlined approach to problem-solving.
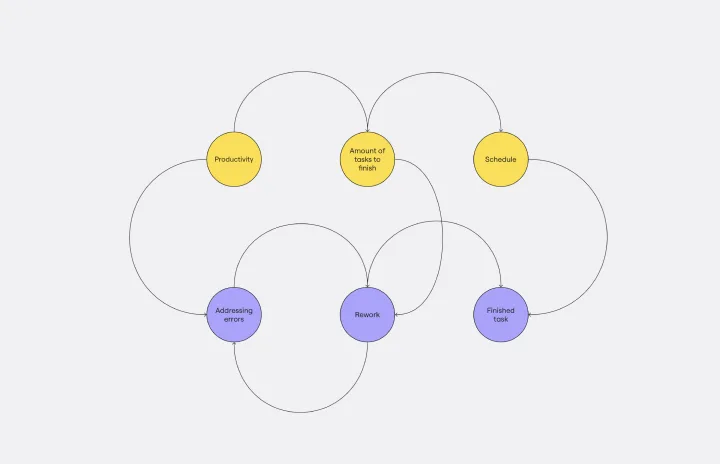
Causal Loop Diagram Template
Idéal pour:
Diagramming
The Causal Loop Diagram Template offers a structured framework to visualize the intricate interconnections within any system. Its standout benefit is the ability to provide a holistic perspective, ensuring that users don't just see isolated issues but understand the entire web of relationships, ultimately leading to more informed and strategic decision-making.
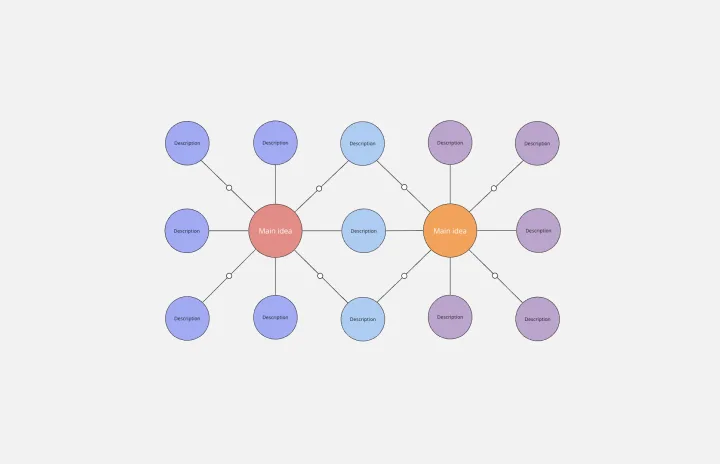
Double Bubble Map Template
Idéal pour:
Diagramming, Mapping, Brainstorming
Double Bubble Map Template serves as a powerful tool to facilitate teamwork and streamline idea exploration. This adaptable template empowers teams to brainstorm, analyze, and compare concepts with ease, making it an invaluable asset for enhancing creativity and fostering clarity among team members.
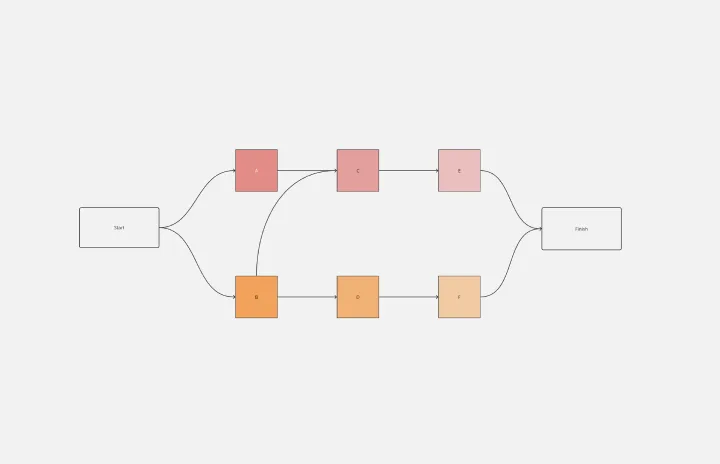
Precedence Diagram
Idéal pour:
Diagramming, Mapping
The Precedence Diagram Template offers a visual tool that maps out project activities and their interrelated sequences. This diagram empowers teams to recognize and anticipate workflow structures by illustrating the connections and dependencies among tasks.
Modèle de Planification Stratégique
Idéal pour:
Planification Stratégique, Leadership, Planification de projet
Chaque fois que vous devez définir vos objectifs et déterminer les étapes à suivre pour les atteindre, vous bénéficierez d'un modèle de planification stratégique. Le modèle de planification stratégique vous guide, vous et votre équipe, à travers des exercices pour vous aider à évaluer votre situation actuelle, à déterminer vos objectifs pour l'avenir et à élaborer un plan pour y parvenir. En règle générale, la stratégie considère les objectifs ou les raisons de faire quelque chose, tandis que la planification fait référence aux actions spécifiques que vous entreprendrez pour atteindre un objectif spécifique. Mais avec la planification stratégique, vous considérez les deux aspects en même temps.
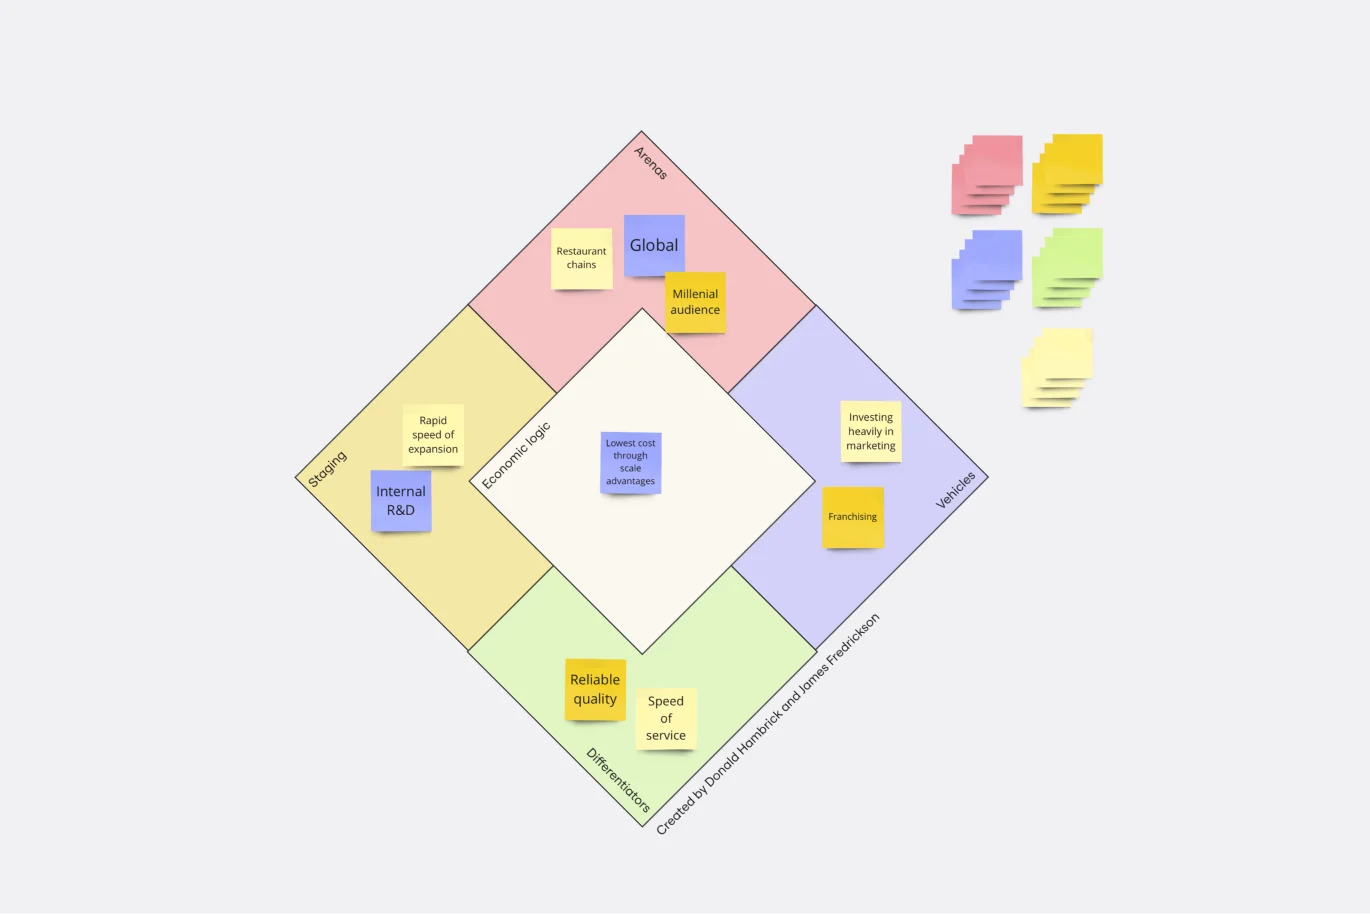
Modèle Stratégie Diamant
Idéal pour:
Leadership, Operations, Strategic Planning
Pour atteindre ses objectifs clés, chaque entreprise élabore une série de stratégies. Mais quels éléments devez-vous prendre en compte lors de la construction d'une stratégie ? Une stratégie en diamant est un ensemble d'éléments formant une stratégie commerciale cohérente. Ces éléments comprennent : les arènes, les différenciations, les véhicules, la mise en scène et la logique économique. La plupart des plans stratégiques se concentrent sur un ou deux de ces éléments, créant des failles qui pourraient causer des problèmes à votre entreprise plus tard. Une stratégie en diamant peut vous aider à rester concentré et à vous assurer que vous répondez à tous les besoins de votre entreprise plutôt qu'à un ou deux.
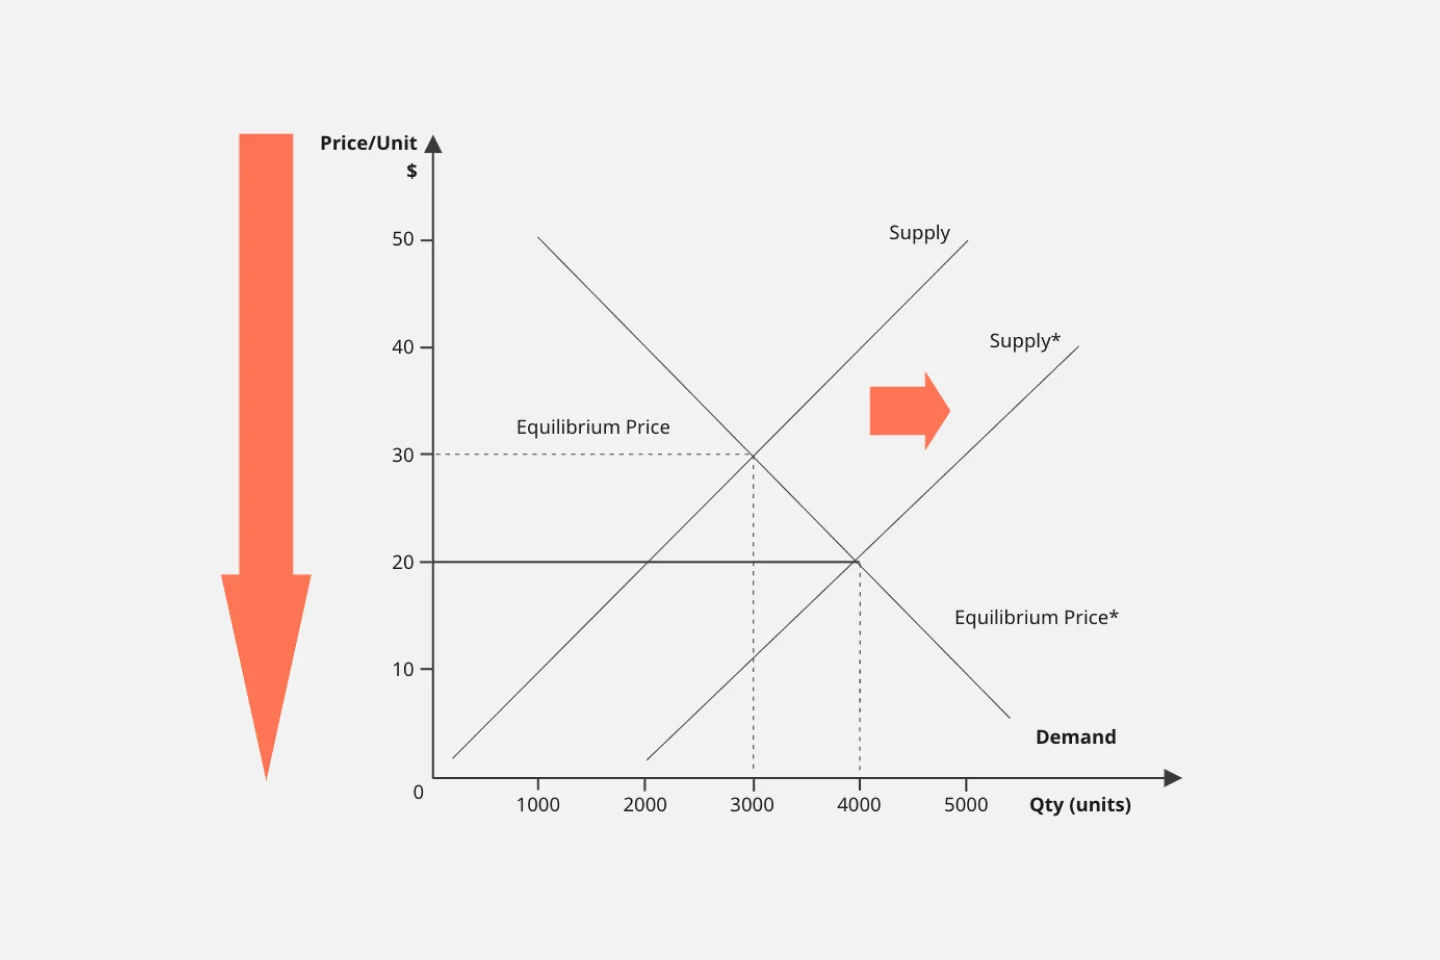
Modèle Diagramme de l'Offre et de la Demande
Idéal pour:
Market Research, Mapping, Diagrams
Comment fixer le prix de votre produit de manière à réaliser un bénéfice tout en satisfaisant les clients et les fabricants ? En trouvant un prix équitable. Un diagramme de l'offre et de la demande est un graphique qui permet de visualiser la demande pour votre produit et la quantité de produits dont vous avez besoin. Cela vous aide à fixer son prix.
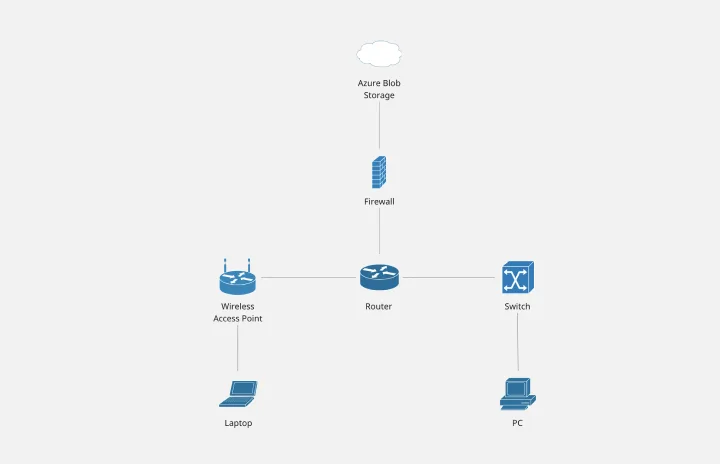
Modèle de Diagramme de Réseau Cisco
Idéal pour:
Développement de logiciels, Diagrammes
Cisco propose des solutions de réseaux d'accès et de centres de données conçues pour évoluer grâce à l'automatisation, la programmabilité et la visibilité en temps réel. Le diagramme de réseau de données Cisco utilise des éléments Cisco pour afficher visuellement la conception des réseaux de données.
Modèle de Cartographie des Résultats
Idéal pour:
Diagrammes, Cartographie, Gestion de projet
Les grands projets complexes comportent de nombreuses incertitudes inhérentes et peuvent avoir de nombreux résultats possibles. Comment pouvez-vous être prêt pour tous ces résultats ? Vous pouvez les anticiper. La cartographie des résultats est une technique qui vous permet de recueillir des informations à l'avance pour vous préparer aux nombreux changements et obstacles imprévus qui surviennent au cours d'un projet. Ce modèle vous permet de réaliser facilement la cartographie de résultats en quatre étapes : effectuer votre travail préalable, fournir un cadre de suivi, élaborer un plan d'évaluation et le diffuser à votre équipe et aux parties prenantes.
Spider Diagram Template
Idéal pour:
Diagramming, Mapping
Perfect for brainstorming sessions, project planning, or simply organizing thoughts, the Spider Diagram Template allows you to create 'legs' branching out from a central idea, representing related topics or subtopics.
Miro est une plateforme collaborative de tableau blanc en ligne conçue pour les équipes distantes et distribuées.
S'inscrire gratuitement