Precedence Diagram
Optimize resource allocation with the Precedence Diagram Template. By discerning which tasks can run concurrently and which need to wait for others to complete, teams can manage their resources more effectively, ensuring smoother, more efficient project progression.
Trusted by 65M+ users and leading companies


About the Precedence Diagram Template
The Precedence Diagram Template is a powerful resource to help teams visualize their project workflows with clarity and precision. By enabling a clear representation of project management processes, the template fosters enhanced productivity and streamlines tasks, ensuring teams can navigate their projects with confidence and efficiency.
What is a Precedence Diagram?
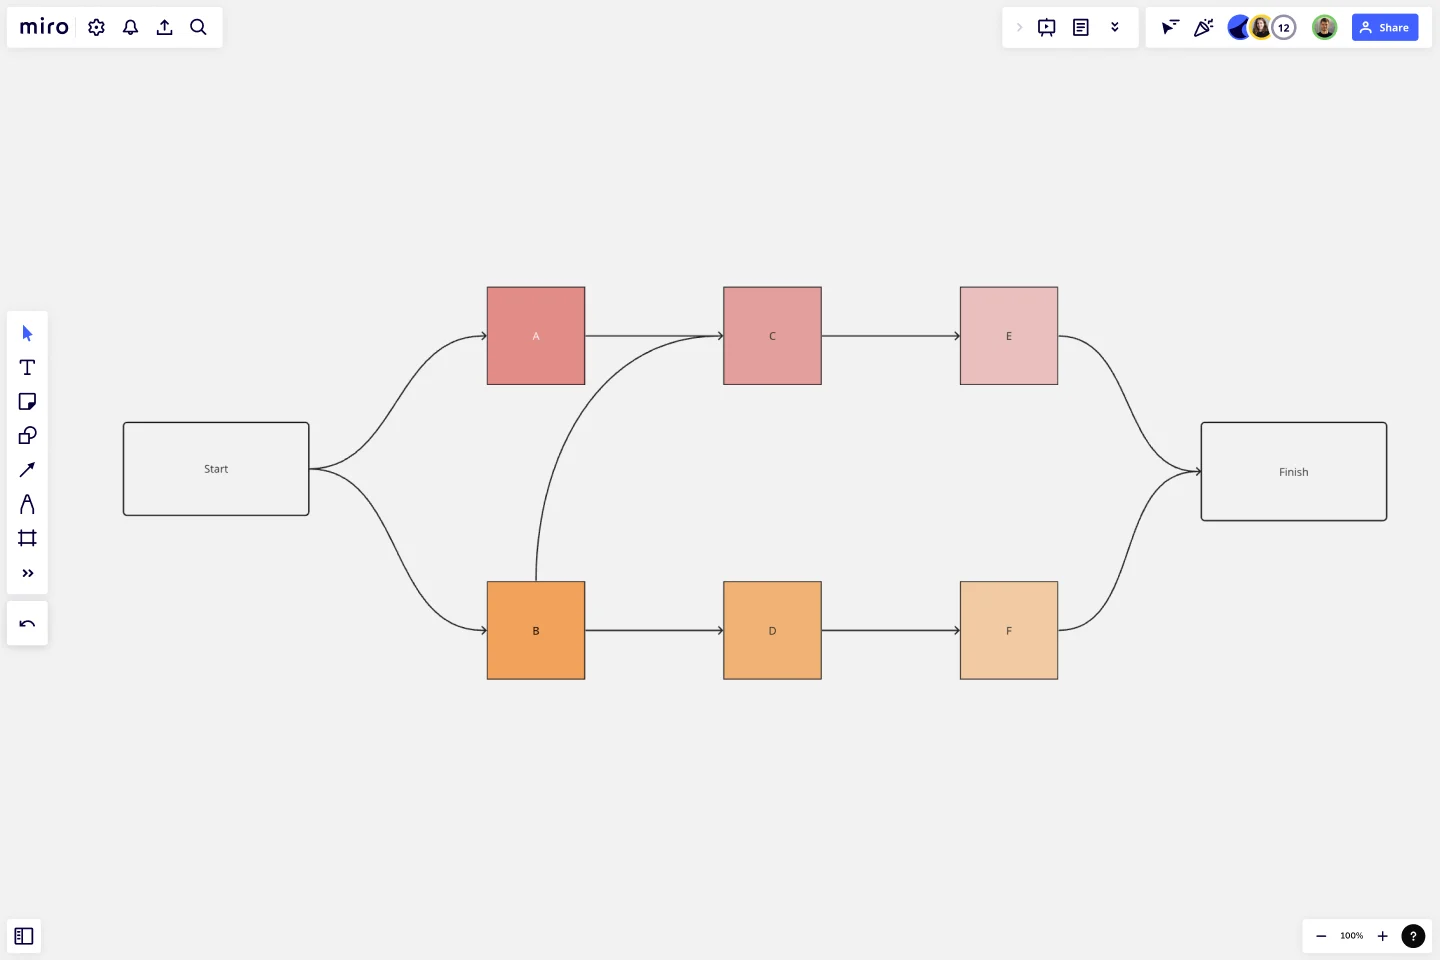
A precedence diagram, often called a Project Network Diagram, is a graphical tool that shows project activities and their interdependencies. By visualizing these connections, teams can gain clarity on the order in which tasks must be performed and identify which tasks can occur concurrently. The template is designed to simplify the creation of these valuable visualizations.
One significant benefit of using the Precedence Diagram Template is its ability to enhance project efficiency. By clearly outlining task sequences and potential overlaps, project managers can allocate resources more effectively and avoid bottlenecks, ensuring that the project remains on track and meets its deadlines. This foresight can save time and lead to substantial cost savings, making the precedence diagram an indispensable tool for any project-driven team.
How to use a Precedence Diagram Template in Miro
Miro's interactive board features, coupled with its automated diagramming capabilities, make creating precedence diagrams a breeze. Here's how you can set up a Precedence Diagram Template on your Miro board in four simple steps:
Select the Precedence Diagram Template: In the Template Library, search for "precedence diagram" and select the template from the results.
Customize your diagram: Use Miro's automated diagramming features to draw connections between tasks, indicating their relationships. Simply drag and drop items to reposition them or connect them with arrows to show the flow of tasks.
Collaborate and share: Invite your team members to collaborate in real time. Miro enables you to discuss, edit, and refine the diagram, ensuring everyone's on the same page.
Can I customize the look and feel of the precedence diagram?
Yes, Miro's interface is highly intuitive, allowing you to change colors, shapes, and fonts to match your team or project's branding.
Is there a limit to how many tasks I can add to my diagram?
There's no strict limit. However, for readability and usability, we recommend ensuring that your diagram remains clear and uncluttered by periodically reviewing and refining it.
Can I link other Miro boards or external resources to tasks in the precedence diagram?
Yes, you can! Simply use the linking tool in Miro to connect tasks to relevant boards or external resources, providing more context and information.
How do I ensure that only authorized team members can edit the diagram?
Miro allows you to set permissions for each individual or group. You can grant view-only, commenting, or editing access based on what's suitable for your team's needs.
Get started with this template right now.
SAFe Program Template
Works best for:
Agile Methodology, Diagrams, Agile Workflows
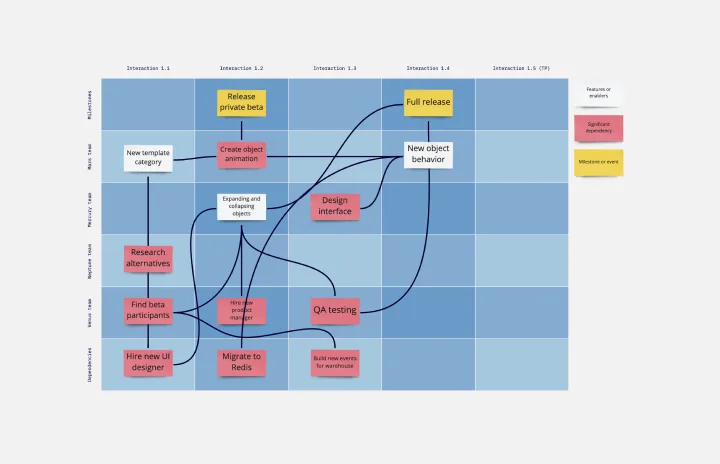
Many organizations use the Agile model, but even companies that don’t rigorously adhere to all Agile standards have adopted Agile tools and methods like Program Increment (PI) Planning. Even if you’re not participating in a formal PI session, a program board can be a great way to establish communication across teams and stakeholders, align development objectives with business goals, clarify dependencies, and foster cross-functional collaboration. The board provides much-needed structure to planning sessions, yet is adaptable enough to accommodate brainstorming and alignment meetings.
Use Case Diagram Template
Works best for:
Marketing, Market Research, Diagrams
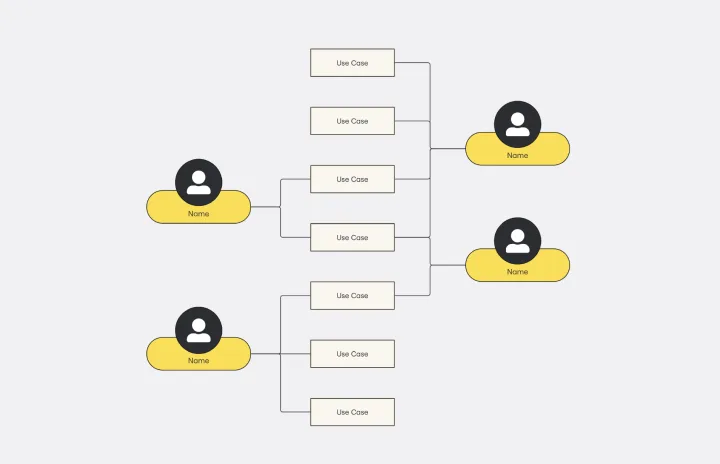
A use case diagram is a visual tool that helps you analyze the relationships between personas and use cases. Use case diagrams typically depict the expected behavior of the system: what will happen and when. A use case diagram is helpful because it allows you to design a system from the perspective of the end user. It’s a valuable tool for communicating your desired system behavior in the language of the user, by specifying all externally visible system behavior.
Breadboard (UI Flow Diagram)
Works best for:
Diagramming
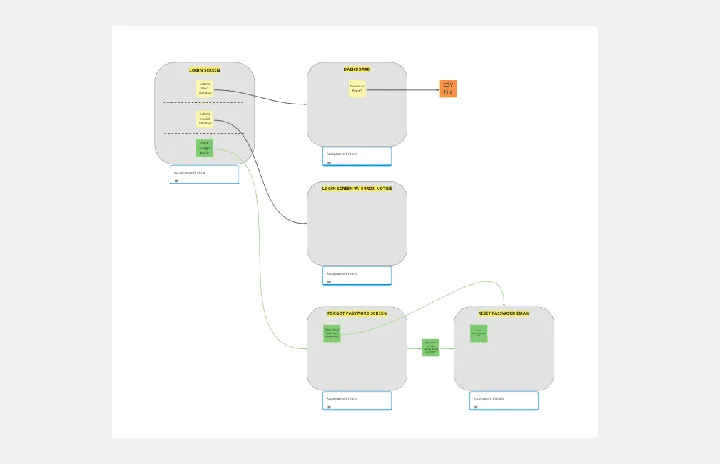
The Breadboard (UI Flow Diagram) template offers a visual framework for designing and prototyping user interfaces (UIs) using the breadboard method. It provides elements for arranging UI components and defining user interactions. This template enables designers and developers to create interactive UI prototypes quickly and iteratively, facilitating user testing and feedback. By promoting rapid prototyping and experimentation, the Breadboard (UI Flow Diagram) empowers teams to design intuitive and user-friendly digital experiences effectively.
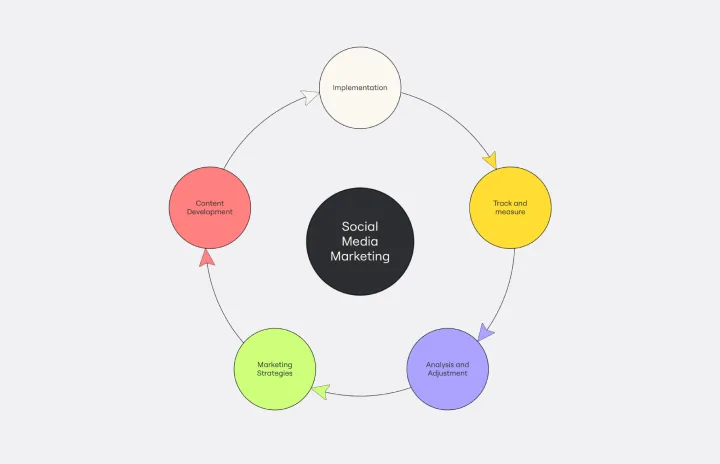
Cycle Diagram Template
Works best for:
Diagramming
The cycle diagram template empowers professionals to visually represent complex cycles with precision and clarity. This template maps out cyclical processes, relationships, or events, ensuring that complex concepts are communicated seamlessly. One key benefit that sets this template apart is its ability to streamline communication and enhance understanding. By crafting visually appealing cycle diagrams, professionals can distill complex information into a clear visual language, making it easier for teams and stakeholders to grasp complex relationships. This ultimately fosters more effective collaboration and decision-making.
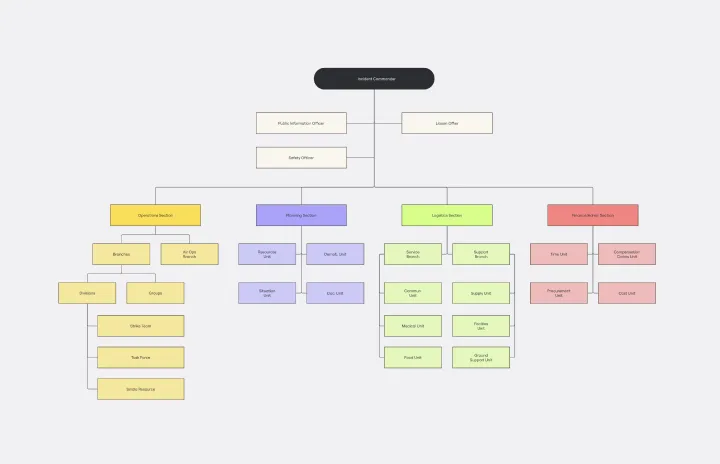
ICS Org Chart Template
Our carefully crafted ICS Org Chart Template is an invaluable tool designed to clearly represent the hierarchical structure of the Incident Command System (ICS). It simplifies the complex web of roles, responsibilities, and chains of command within the ICS, providing a structured blueprint for both experienced professionals and those new to the system. The template's most notable benefit is its ability to foster immediate understanding, bridging the gap between intricate organizational structures and the teams navigating them. Teams that use this template can ensure that everyone is aligned, understands their role, and collaborates efficiently, thereby reducing potential bottlenecks and misunderstandings.
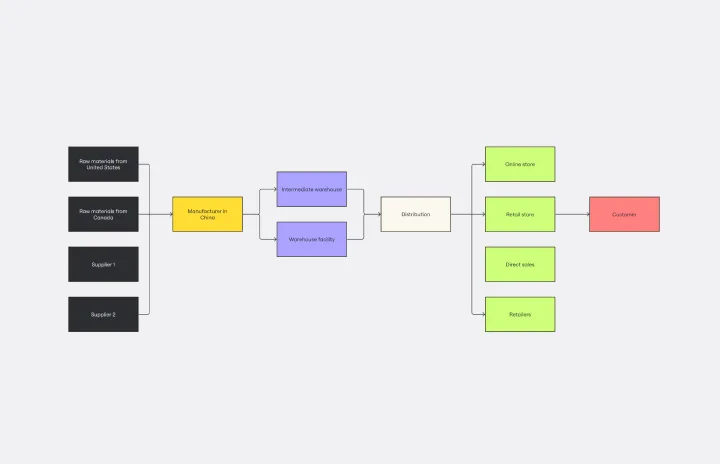
Supply Chain Diagram Template
Works best for:
Diagramming
The Supply Chain Diagram Template is great for businesses to streamline and enhance their supply chain processes. This template lets you visualize the entire supply chain, from sourcing raw materials to delivering finished products. Its intuitive layout simplifies complex networks, making identifying key areas and potential bottlenecks easier. One of the standout benefits of using this template is its clarity. It bridges the gap between complex processes and strategic decision-making by presenting a clear, visual supply chain representation. This clarity enables teams to pinpoint inefficiencies and implement more effective management strategies, which optimizes operations and facilitates better communication and understanding across different departments within an organization.