PERT Chart Template
Track project timelines, tasks, and dependencies at a single glance using a PERT chart template.
Trusted by 65M+ users and leading companies


About the PERT Chart Template
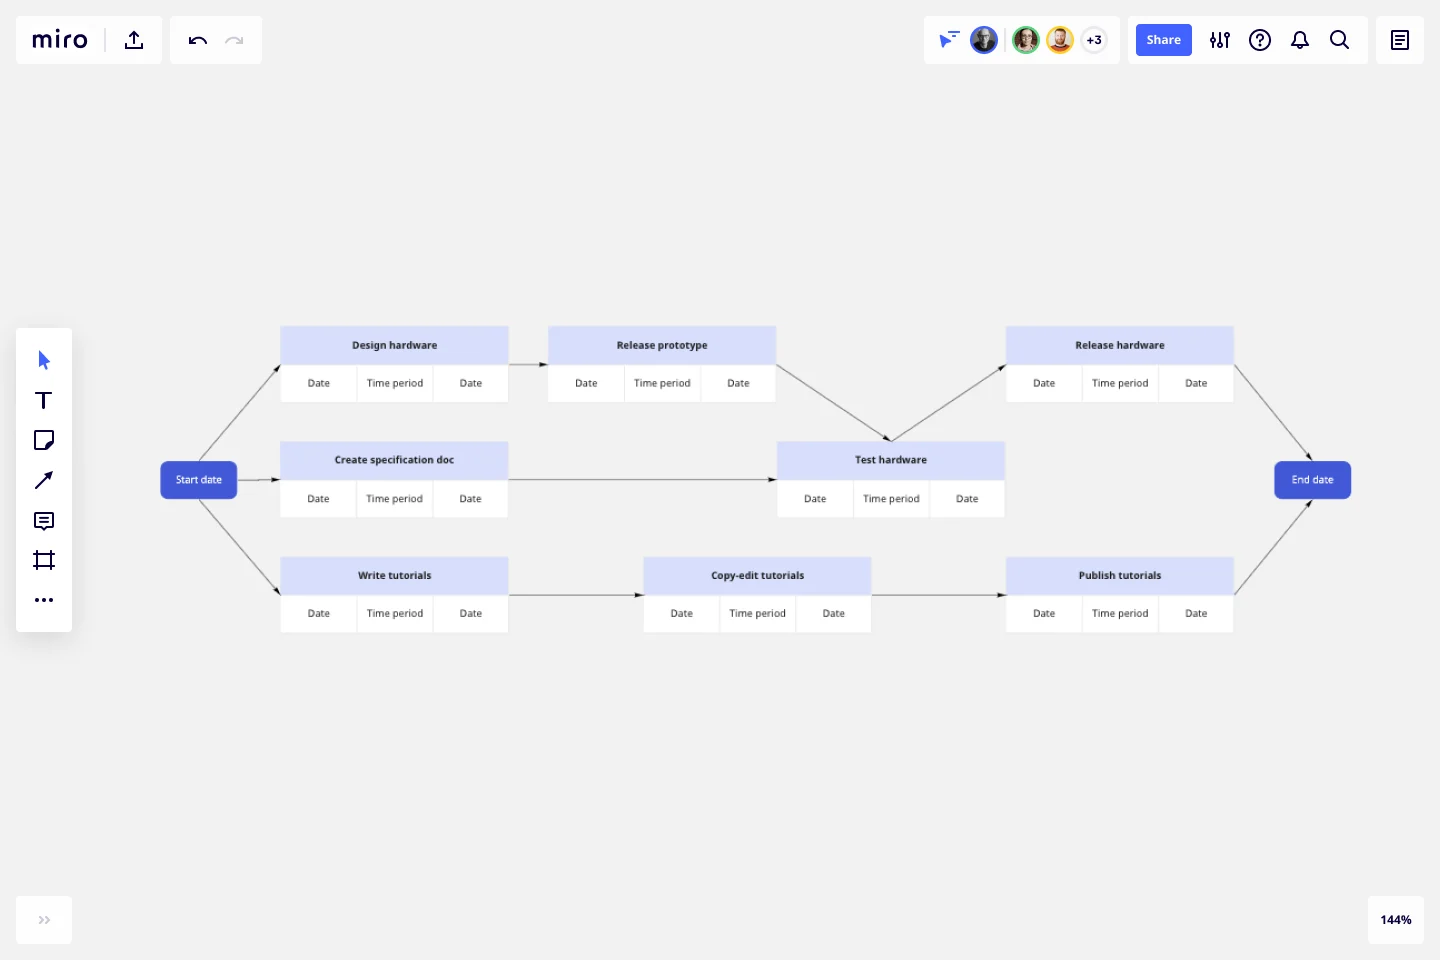
Miro’s PERT chart template is a project management tool that allows you to create a visual roadmap for your project. Designed to let you see interdependencies and to help you identify possible bottlenecks, this template consists of nodes and vectors that are easy to fill out and customize.
We’ll walk you through how to make the most of the PERT chart template.
How to use the PERT chart template
To get started, click on the blue “use template” button to open the PERT chart template in Miro. Once you’re in, follow the steps below to start filling it out.
1. Identify project tasks
Break your project down into tasks. Then, label the blue headers along the nodes with the task names. Double-click on the pre-written text to replace it with your own. Below the blue headers, add each task's expected start and end dates and the estimated durations by double-clicking on the text boxes.
2. List task dependencies
Are there any tasks you can’t start until another one’s been completed first? That means you have dependencies. Use the arrows in the PERT chart template to connect dependent tasks, and make sure the direction represents the order you need to complete them.
4. Label dependencies
Add more detail to clarify the nature of each dependency by labeling the arrows with one of the following:
Finish-to-Start (FS): You can’t start a task until you’ve completed the preceding task.
Start-to-Start (SS): You can start a task as soon as you’ve started its preceding task.
Finish-to-Finish (FF): You can’t finish a task until you’ve completed the preceding task.
Start-to-Finish (SF): You can’t finish a task until you’ve started the preceding task.
Grab text boxes from the toolbar and place them along the arrows to add your labels.
6. Identify a critical path
Use the estimated durations to calculate the critical path. Then, use colors to outline nodes or arrows to visualize it.
7. Share your diagram
Once you’ve filled in the PERT chart template, you can share it with your team and key stakeholders for feedback and easily make changes to your Miro board anytime.
Benefits of using Miro’s PERT chart template
Miro’s PERT chart template makes it especially easy to manage projects that involve multiple team members and stakeholders. With advanced collaboration features at your fingertips, you can easily build a PERT chart together online in real-time or invite others to view and comment on your Miro board when you’re ready — making it an ideal solution for remote and hybrid teams.
The PERT chart template is also fully customizable, allowing you to take advantage of Miro’s extensive editing features — from resizing nodes and text to changing up colors and line thickness.
Is Miro’s PERT chart template free?
Yes, all our templates are free and ready to use. Simply click on the blue “Use template” button to get started.
Can I share the PERT chart template with others outside my team?
Yes, there are several ways to share the PERT chart template. Export your Miro board as a PDF or image to attach it as a file to a message. Alternatively, you can embed your Miro board on other sites or generate a shareable link to send to others.
What is the critical path in a PERT chart?
A critical path shows the longest path of essential tasks you must complete to finish a project. For example, you can't move on to do the upholstery and interior if you haven't finished putting up the walls and roof. When one of these tasks is late, it impacts the entire project. To make up for missed deadlines on critical tasks, reallocate resources and staff from the low-impact tasks.
Get started with this template right now.
Product Voice Design toolkit
Works best for:
Product Management, Planning
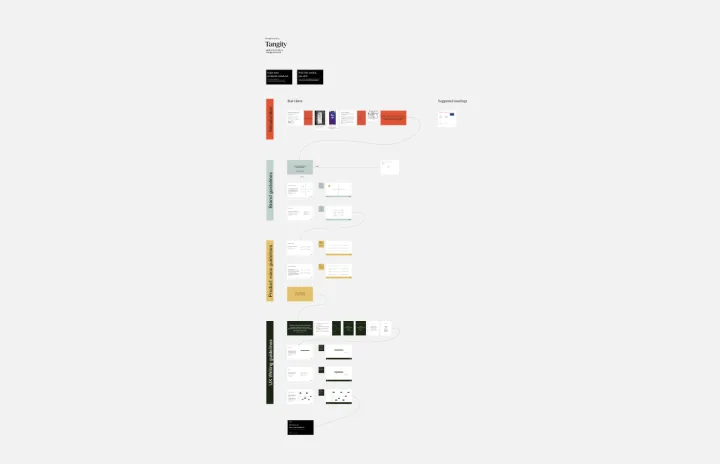
The Product Voice Design toolkit facilitates the development of consistent and impactful product messaging. By defining brand voice attributes, tone guidelines, and messaging principles, this toolkit ensures that product communication resonates with target audiences. With sections for crafting messaging frameworks, storytelling templates, and content guidelines, it empowers product teams to create compelling and cohesive product narratives. This toolkit serves as a valuable resource for enhancing product communication strategies and building strong brand identities.
Product tone of voice
Works best for:
Product Management, Planning
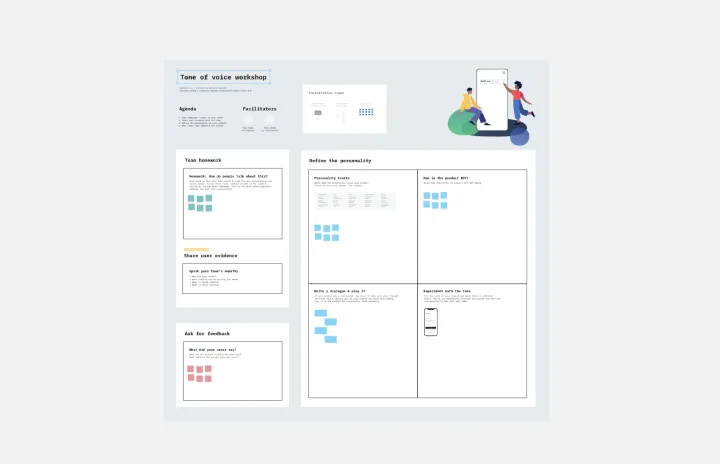
The Tone of Voice Workshop template helps product teams define and align on brand tone and messaging. By facilitating collaborative workshops, exploring brand personality traits, and defining tone guidelines, this template ensures consistent and impactful communication. With sections for identifying target audience personas, articulating brand values, and crafting messaging principles, it enables teams to create authentic and compelling brand voices. This template serves as a foundation for building strong brand identities and resonating with customers across all touchpoints.

UML Communication Diagram Template
Works best for:
Software Development, Mapping, Diagrams
Most modern programs consist of many moving parts working to a precise set of instructions. With a communication diagram, you can visualize exactly how those parts work together, giving you a clearer understanding of your program as a whole. What’s more, the diagram leaves spaces for expanding the network of relationships as your product grows and evolves. A communication diagram is a vital tool in any software designer’s arsenal.

Timeline Workflow
Works best for:
Project Management, Flowcharts, Operations
A timeline is a visual tool that chronologically plots out projects step by step. It’s an ideal tool for your team to tell stories (such as an overview of events in your organization) and visualize your projects or processes. The Timeline Workflow template is perfect for any project that relies on visual content. You may find it beneficial to use with your team and also to share with other stakeholders or clients to keep them in the loop on your progress.
Current State vs. Future State Flowchart Template
Works best for:
Diagramming
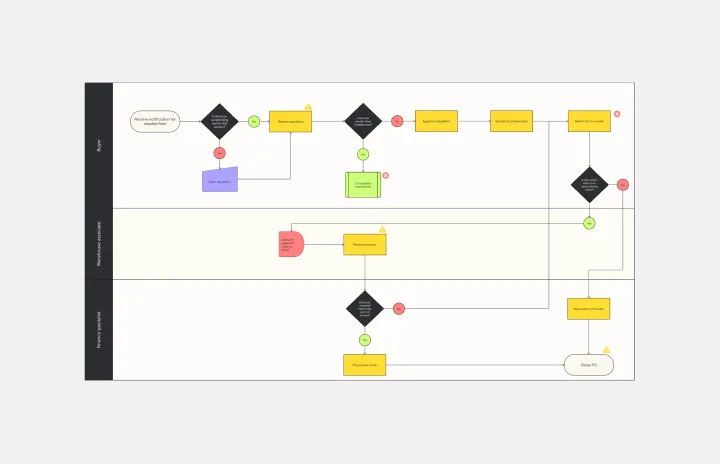
The Current State vs Future State Flowchart Template is an essential tool for strategic planning, providing teams with a dynamic and visual roadmap for organizational transformation. One of its key benefits is streamlining collaboration by using swimlanes to allocate tasks to specific departments. This feature promotes accountability and transparent communication, ensuring everyone is aligned on their responsibilities. As a result, teams can navigate complex processes with ease, fostering a shared understanding of the current and future states, ultimately leading to efficient and collaborative decision-making.
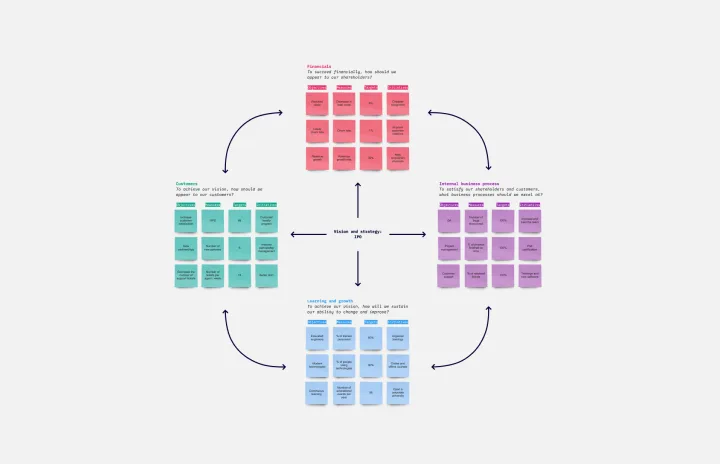
Balanced Scorecard Template
Works best for:
Operations, Strategic Planning, Project Planning
Balanced scorecards are useful tools for understanding business performance at a glance with regard to customers, employees, business processes, and financial progress. Learn more about BSCs and create your own using Miro’s Balanced Scorecard template.