Causal Loop Diagram Template
Visualize systems relationships and improve problem-solving with the causal loop diagram template.
Trusted by 65M+ users and leading companies


About the Causal Loop Diagram Template
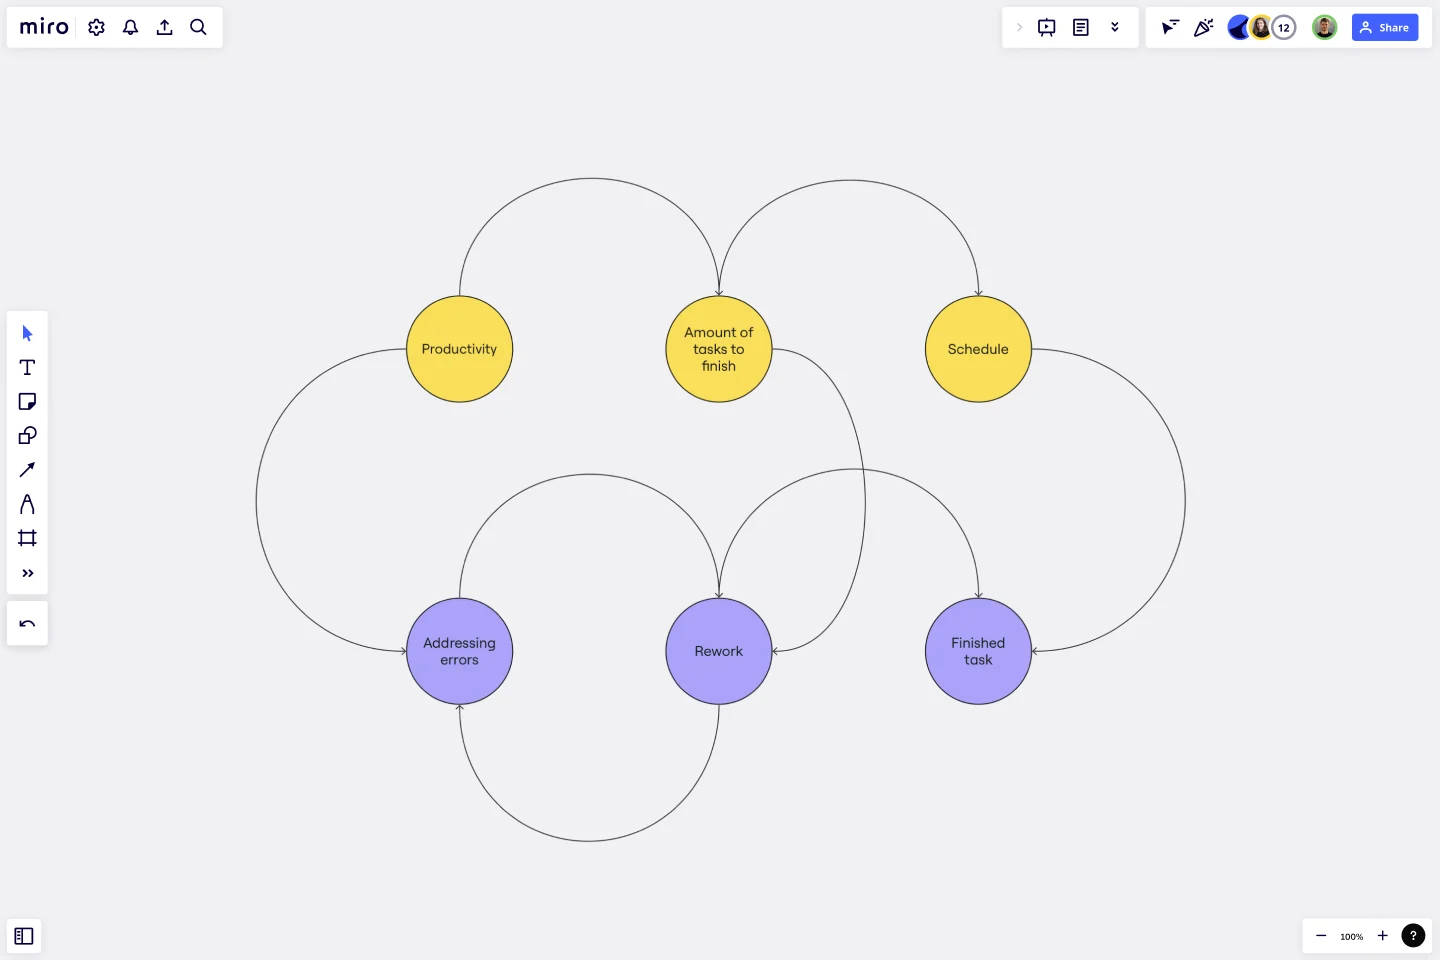
The causal loop diagram template is a robust resource designed to visualize complex interrelationships within systems. By providing an organized framework, this template enables the in-depth exploration of interactions, promoting a comprehensive understanding of systems and helping in effective problem-solving.
What's a causal loop diagram template?
A causal loop diagram (CLD) template is a tool that showcases the system's feedback loops and cause-and-effect relationships. Instead of viewing issues in isolation, this diagram gives a holistic view of the interactions between various system components. The template provides a structured framework, enabling teams to chart out these interconnections in an organized and easy-to-understand manner.
How to use the causal loop diagram template in Miro
Miro has intuitive features, making the creation of a CLD seamless:
Shapes library: Select the feature in the toolbar. Here, you can choose different shapes representing many elements within your system.
Arrows and connections: Use arrows to depict the direction of influence between elements. Positive and negative feedback loops can be indicated using '+' and '-' signs.
Customization: Change colors, sizes, and labels to differentiate and categorize the elements as needed.
Drag and drop: Simply drag your chosen elements onto the Miro board and position them to create your causal loop diagram.
Why should you use a causal loop diagram template?
Holistic viewpoint: The template helps understand the bigger picture by visualizing a system's complex web of relationships.
Effective problem-solving: By recognizing the underlying patterns and structures, teams can address root causes instead of superficial symptoms.
Enhanced communication: A well-structured CLD fosters clarity in discussions, promoting shared understanding amongst team members.
Strategic planning: The template helps identify use points, helping in effective decision-making and strategic interventions.
Do you need more advanced diagramming capabilities? Check Miro's diagram maker features.
What is the difference between a positive and a negative feedback loop?
A positive feedback loop amplifies changes, driving the system further from its original state. A negative feedback loop stabilizes the system, pushing it back towards a desired equilibrium.
Can I collaborate in real time with my team on the CLD?
Yes, Miro's workspace supports real-time collaboration, allowing team members to edit, comment, and discuss the diagram.
How can I share my causal loop diagram with stakeholders?
Miro offers easy sharing options. You can invite stakeholders to view or edit the board directly or export the diagram as an image or PDF to share externally.
Is there a limit to the complexity of the system I can map?
While Miro offers a vast canvas, ensuring your CLD remains readable and understandable is essential. If a system is exceedingly complex, consider breaking it down into smaller sub-systems for clarity.
Get started with this template right now.
Family Tree Template
Works best for:
Education, Mapping
Family trees help you make sense of complicated family relationships, even generations back. With this Family Tree Template, you can quickly and easily add your siblings, parents, and extended family members. Plus, add extra information, notes, and even images to create a vibrant family tree.
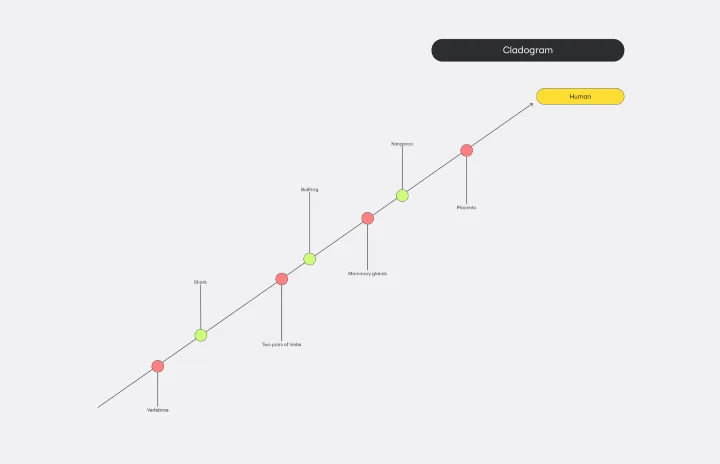
Cladogram Template
Works best for:
Diagramming
The Cladogram Template offers seamless adaptability, empowering users to change, expand, and refine evolutionary representations with ease. Its intuitive interface and automated features ensure dynamic and responsive diagrams that keep up with evolving knowledge. Say goodbye to static diagrams and welcome fluidity and adaptability with Miro's Cladogram Template.
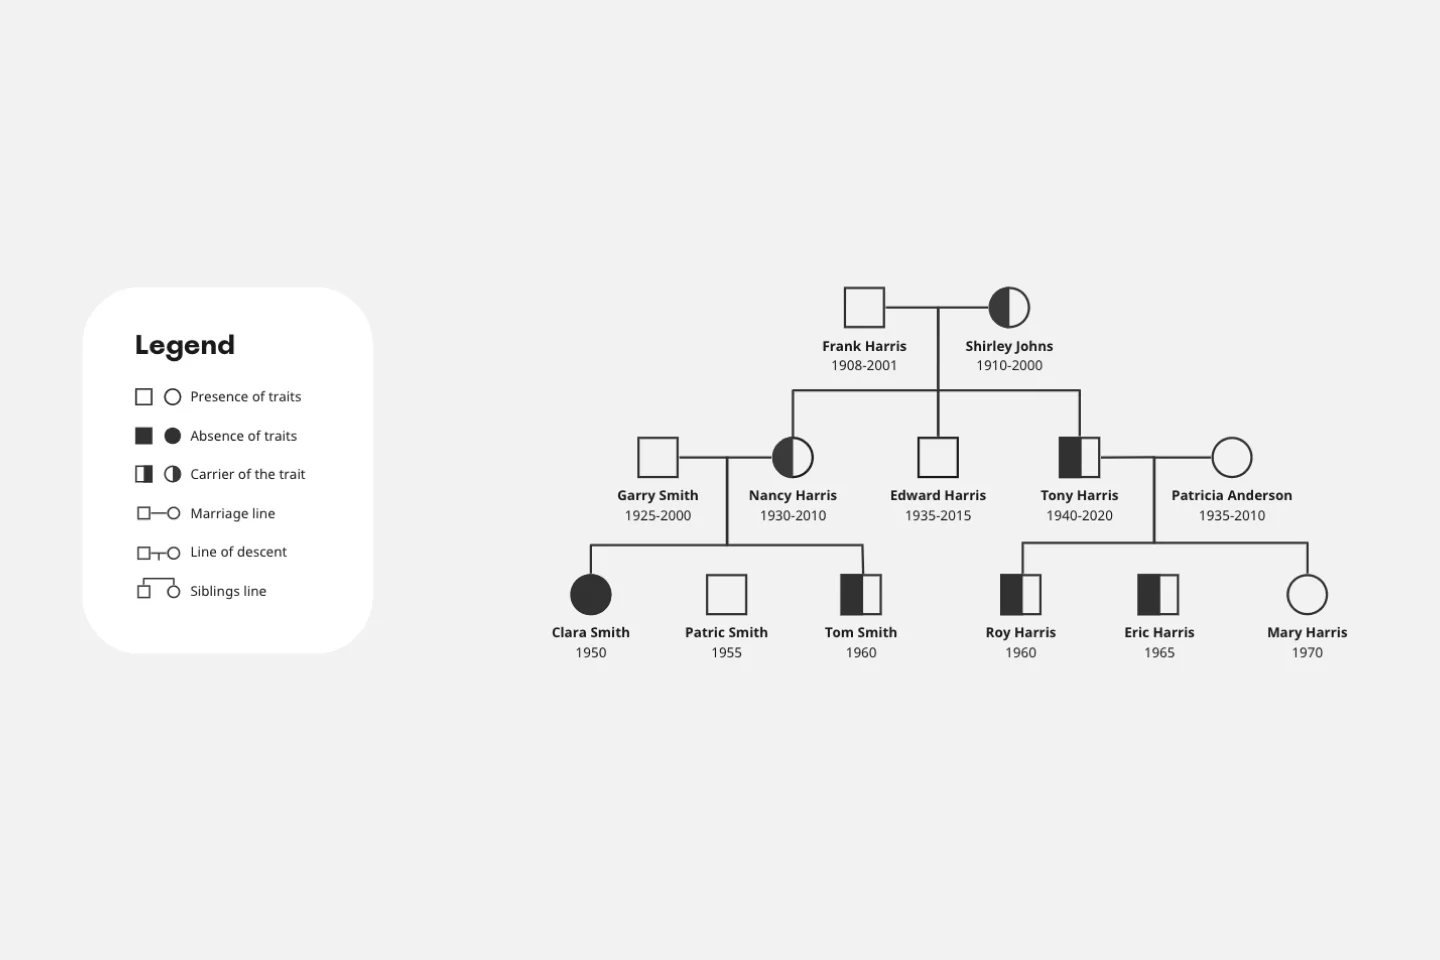
Pedigree Diagram Template
Works best for:
Education
Use our Pedigree Diagram Template to show how traits and diseases are passed from one generation to the next. Whether you’re a doctor, farmer, or just someone interested in genetics, a Pedigree Diagram can help you identify hereditary traits.

Value Stream Mapping Template
Works best for:
Project Management, Strategic Planning, Mapping
A value stream map can help you refocus your business on steps that actually provide value to your customers, cutting out wasteful and inefficient processes. With this template, you and your process team can collaborate on a value stream map today.
Fishbone Diagram Template
Works best for:
Operations, Diagrams, Workflows
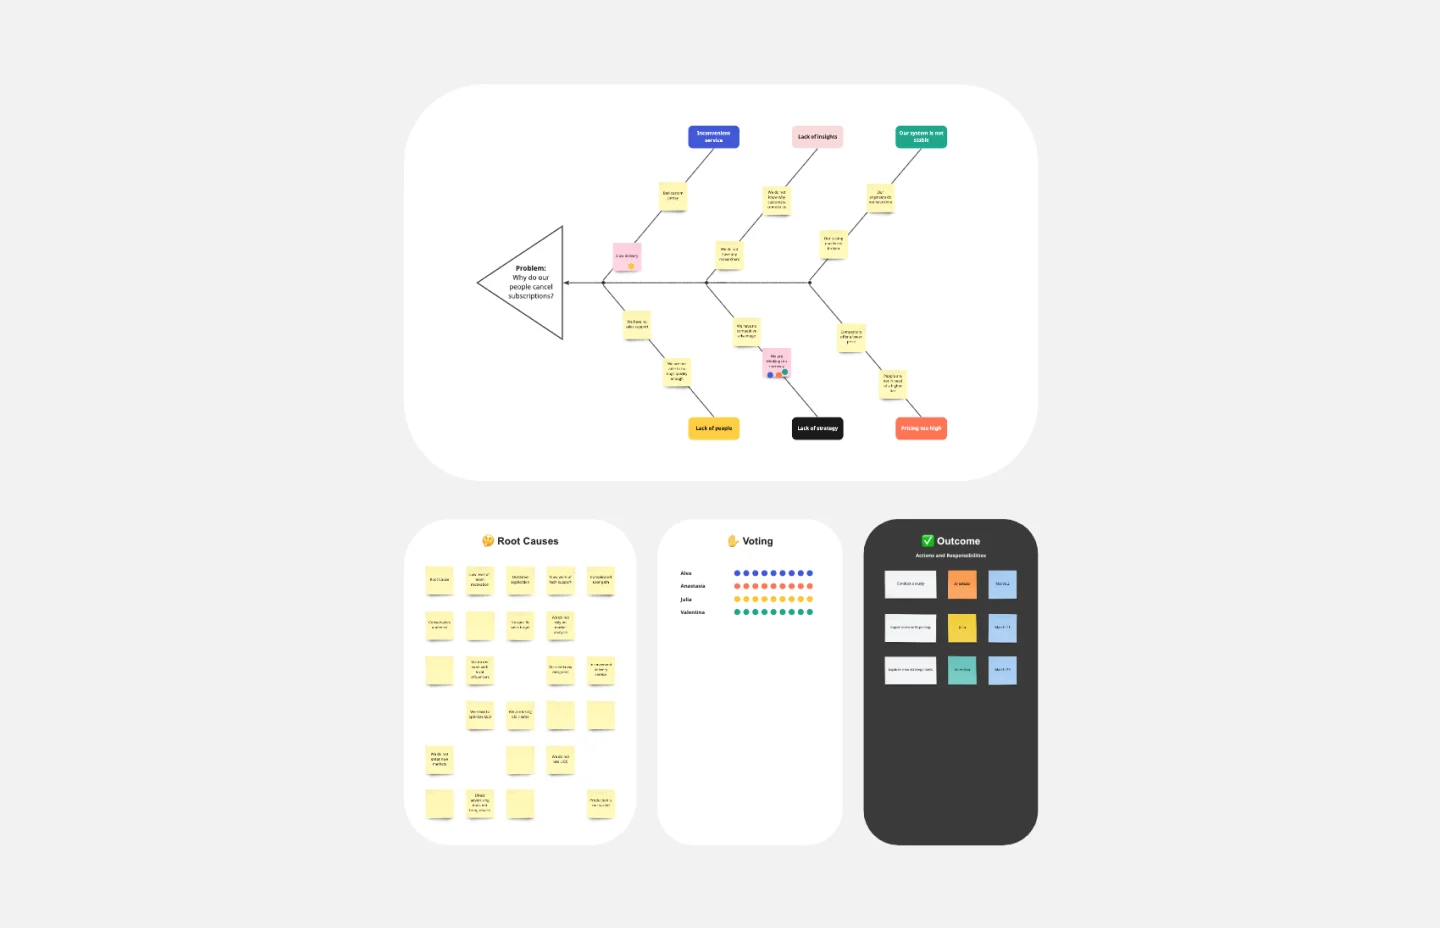
What is the best way to solve any problem your team faces? Go straight to the root. That means identifying the root causes of the problem, and fishbone diagrams are designed to help you do it best. Also known as the Ishikawa Diagram (named after Japanese quality control expert Kaoru Ishikawa), fishbone diagrams allow teams to visualize all possible causes of a problem, to explore and understand how they fit together holistically. Teams can also use fishbone diagrams as a starting point for thinking about what the root cause of a future problem might be.
Kubernetes Architecture Diagram Template
Works best for:
Software Development, Diagrams
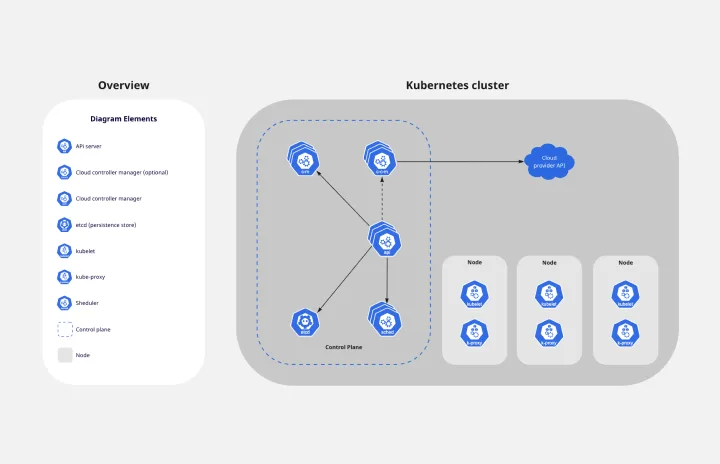
Use the Kubernetes Architecture Diagram template to manage your containerized applications better and bring your apps’ deployment, management, and scalability to the next level. This template helps you lower the downtime in production and allows you to have a more agile app production. Improve the deployment of your apps by visualizing every step of the process with the Kubernetes Architecture template. Try it out, and see if it works for you and your team.