Turtle Diagram Template
Visualize complex processes, align team understanding, and optimize for operational excellence with the turtle diagram template.
Trusted by 65M+ users and leading companies


About the Turtle Diagram Template
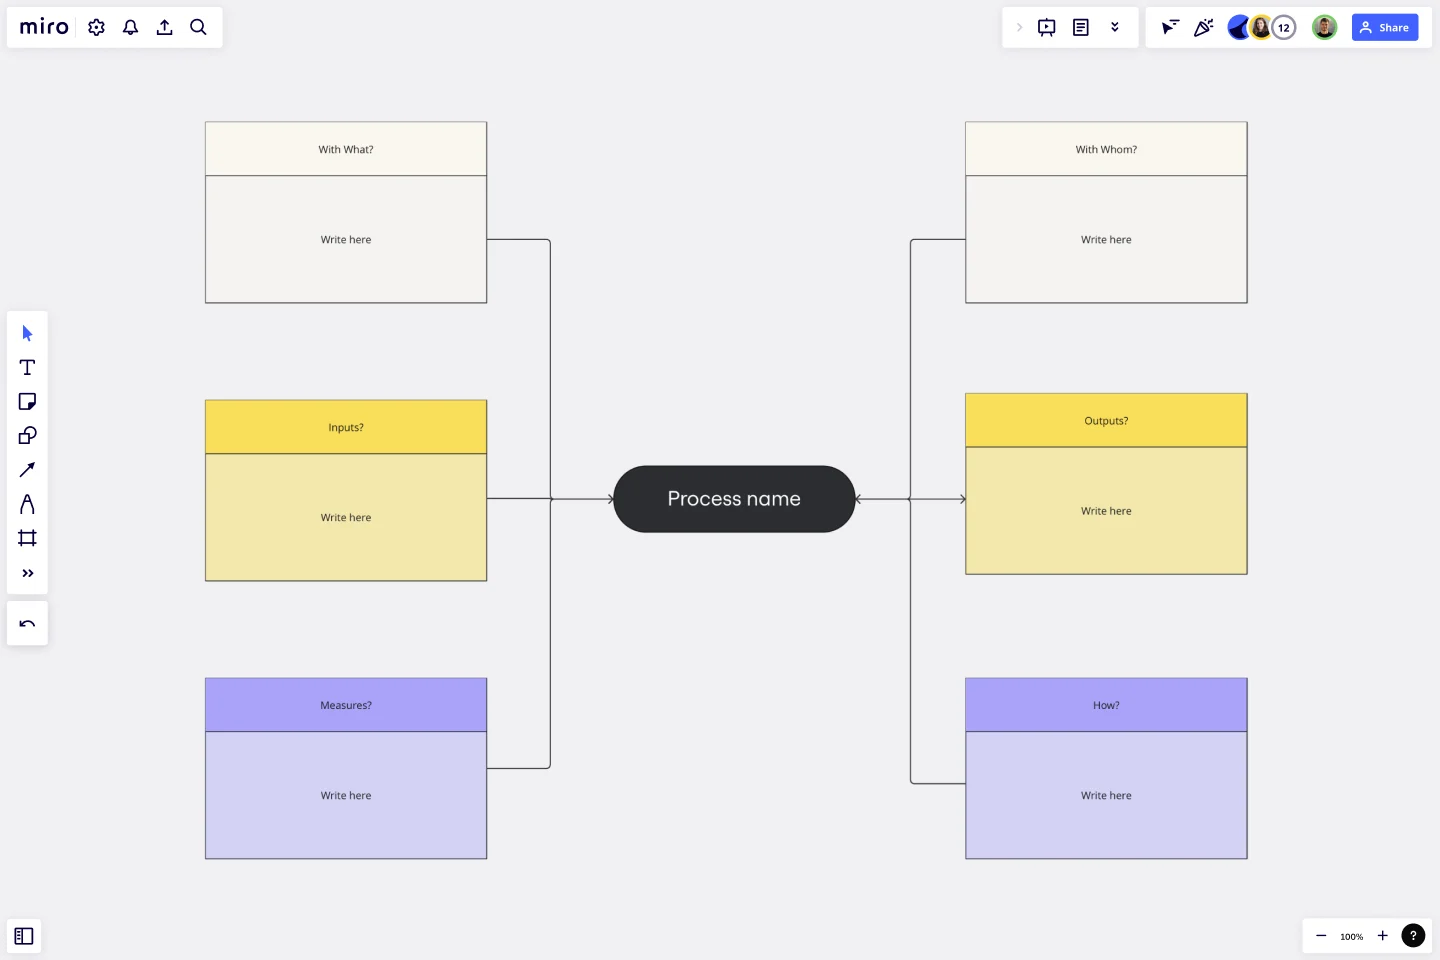
The Turtle Diagram Template is a valuable asset for visualizing processes in a structured and clear format. It's designed to study and organize the various components of a process into distinct, easy-to-understand parts, mirroring the anatomy of a turtle to help in visualization and analysis. Here's a breakdown of each section of the template:
With What: This section explores the tools, materials, and resources needed to complete the process. It's where the necessary equipment or software is identified.
With Whom: Identifies the personnel or roles responsible for executing the process. It could include specific teams, departments, or external partners.
Inputs: Lists the elements required to start the process. These catalysts drive the process forward, such as raw data, materials, or initial requests.
Outputs: Describes the end results or products that emerge from the process. These are the deliverables or outcomes that are expected once the process is complete.
Measures: Outlines the metrics or KPIs used to evaluate the success of the process. It includes the standards and criteria that the outputs are measured against.
How: Explains the methodologies, procedures, and instructions involved in the process. This section provides a step-by-step narrative of how the process is executed, including any methods or best practices that are followed.
By breaking down the process into these key components, the Turtle Diagram Template offers an in-depth understanding of how a process is built and how it should operate, paving the way for more efficient process management and continuous improvement.
How to use the turtle diagram template in Miro
To use the Turtle Diagram Template effectively:
Customize each section: Input data specific to your process into various template sections by double-clicking the text boxes.
Edit effortlessly: Change the diagram through intuitive drag-and-drop features, allowing seamless adjustments to suit your process depth.
Expand and connect: Use automated diagramming capabilities to expand your template and for a more detailed process network.
Enrich with artifacts: Drag and drop various artifacts onto your board, such as images and documents, for a richer contextual understanding of the process.
Why should you use a turtle diagram template?
Clarified process understanding: Breaks down complex processes into manageable parts for better clarity.
Enhanced communication: Simplifies the conveyance of process intricacies across teams and stakeholders.
Effective training resource: Acts as an educational tool for training new employees on existing processes.
Continuous improvement: Identifies areas for improvement by highlighting inefficiencies or bottlenecks within a process.
Compliance and documentation: Aids in meeting quality standards and regulatory requirements by providing clear documentation of processes.
If you prefer to start from scratch, Miro's diagram maker is easy to use and comes with a wide range of diagramming shapes in Miro's extensive library, so you'll find just what you need.
Can the turtle diagram template handle multiple processes at once?
While it's designed to map out individual processes for clarity, users can link multiple turtle diagrams to represent larger, interconnected systems.
Is previous knowledge required to use the Turtle Diagram Template?
No previous knowledge is necessary. The template is designed for ease of use, allowing anyone with a basic understanding of their process to begin mapping immediately.
How detailed can the input and output sections of the diagram be?
The input and output sections can be as detailed as required. Users have the flexibility to expand these sections to include all relevant details, ensuring a comprehensive process overview.
Are turtle diagram templates suitable for any industry?
Yes, these templates are versatile and can be adapted to suit the needs of any industry that benefits from detailed process analysis and quality management.
Get started with this template right now.
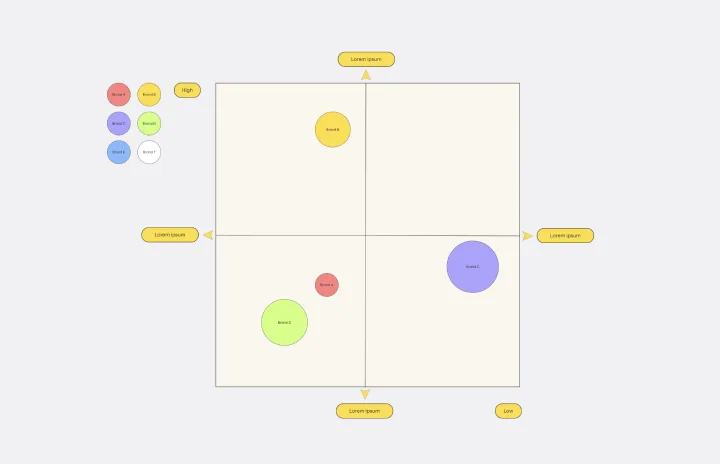
Strategic Group Mapping Template
Works best for:
Mapping, Strategy
The Strategic Group Mapping Template is a cutting-edge visual tool designed to translate the competitive landscape of their industry. By allowing users to plot entities based on distinct criteria, this template provides an at-a-glance view of market dynamics. One standout benefit of using this tool is its ability to identify clusters of competitors and market gaps, paving the way for businesses to strategically position themselves for optimal success.
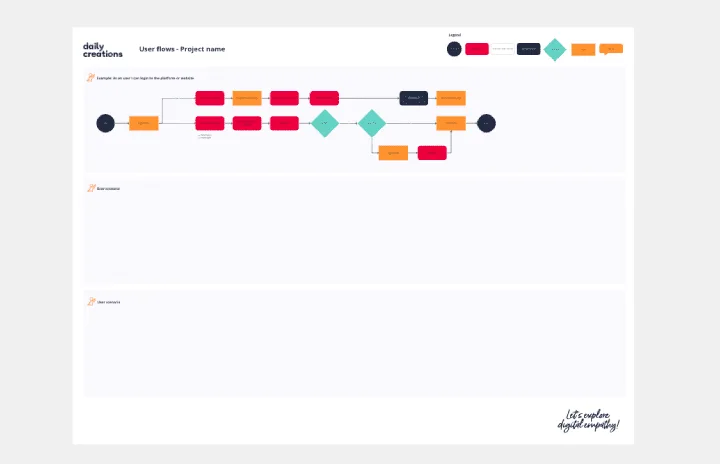
User Flows
The User Flows template offers a visual tool for mapping out the sequence of steps that users take to accomplish a specific task or achieve a goal within a digital product or service. It provides elements for documenting user interactions, screens, and decision points along the user journey. This template enables UX designers and product teams to understand user behaviors, identify pain points, and optimize the user experience effectively. By promoting user-centric design and empathy, the User Flows template empowers teams to create intuitive and engaging digital experiences that meet user needs and drive satisfaction.
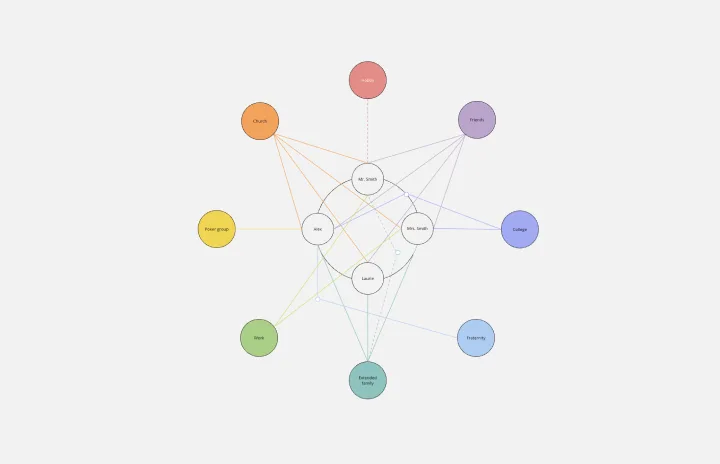
Ecomap Template
Works best for:
Strategy & Planning, Diagramming
The Ecomap Template illustrates the multifaceted relationships and environmental interactions encircling an individual or entity. Determine crucial patterns and dynamics by providing a clear and comprehensive visualization of how different systems intertwine and influence each other.

Onion Diagram Template
Works best for:
Diagramming, Mapping and Diagramming
The Onion Diagram Template is a distinct tool designed to visually represent layers of a specific concept, system, or process, akin to the layers of an onion. Each concentric layer of the diagram provides insights into a different aspect or phase of the topic at hand, moving from the core foundational element outwards to more peripheral components. One of the prime benefits of this template is its ability to offer hierarchical clarity. Users can immediately discern the importance, sequence, or interrelation of different elements within a system, facilitating enhanced comprehension and efficient decision-making.
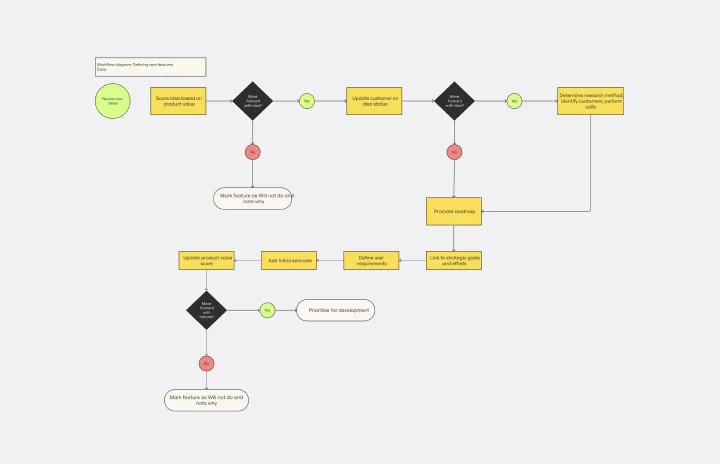
Workflow Diagram Template
Works best for:
Diagramming, Mapping, Process mapping
The Workflow Diagram Template maps out and represents processes or systems using standardized symbols and shapes. By delineating the various steps or stages in a process, it ensures that tasks flow seamlessly from initiation to completion. One of the standout benefits of using this template is its clarity. By translating processes into a visual format, all participants can gain a comprehensive understanding at a glance, eliminating confusion and ensuring everyone is on the same page. This clarity not only promotes efficient task execution but also fosters collaboration among team members.

20/80 Process Diagram - EOS Compatible
Works best for:
Diagramming
The 20/80 Process Diagram - EOS® Compatible template is a visual tool for mapping out processes and workflows aligned with the Entrepreneurial Operating System (EOS®) methodology. It provides a structured framework for identifying core processes and key activities that drive business outcomes. This template enables organizations to streamline operations, clarify roles and responsibilities, and enhance accountability. By promoting alignment with EOS® principles, the 20/80 Process Diagram empowers teams to achieve organizational excellence and drive sustainable growth.