Google Cloud Architecture Diagram Template
Visualize the deployment of your applications with Google Cloud Architecture Diagram template and optimize your processes.
Trusted by 65M+ users and leading companies


About the Google Cloud Architecture Diagram Template
A Google Cloud Architecture Diagram template is where you can visually represent and manage application development, deployment, and documentation. You can use this Google Cloud Architecture Diagram template to stay in sync with your team, have an excellent application architecture overview, and quickly iterate if needed.
Keep reading to learn more about the Google Cloud Architecture Diagram Template.
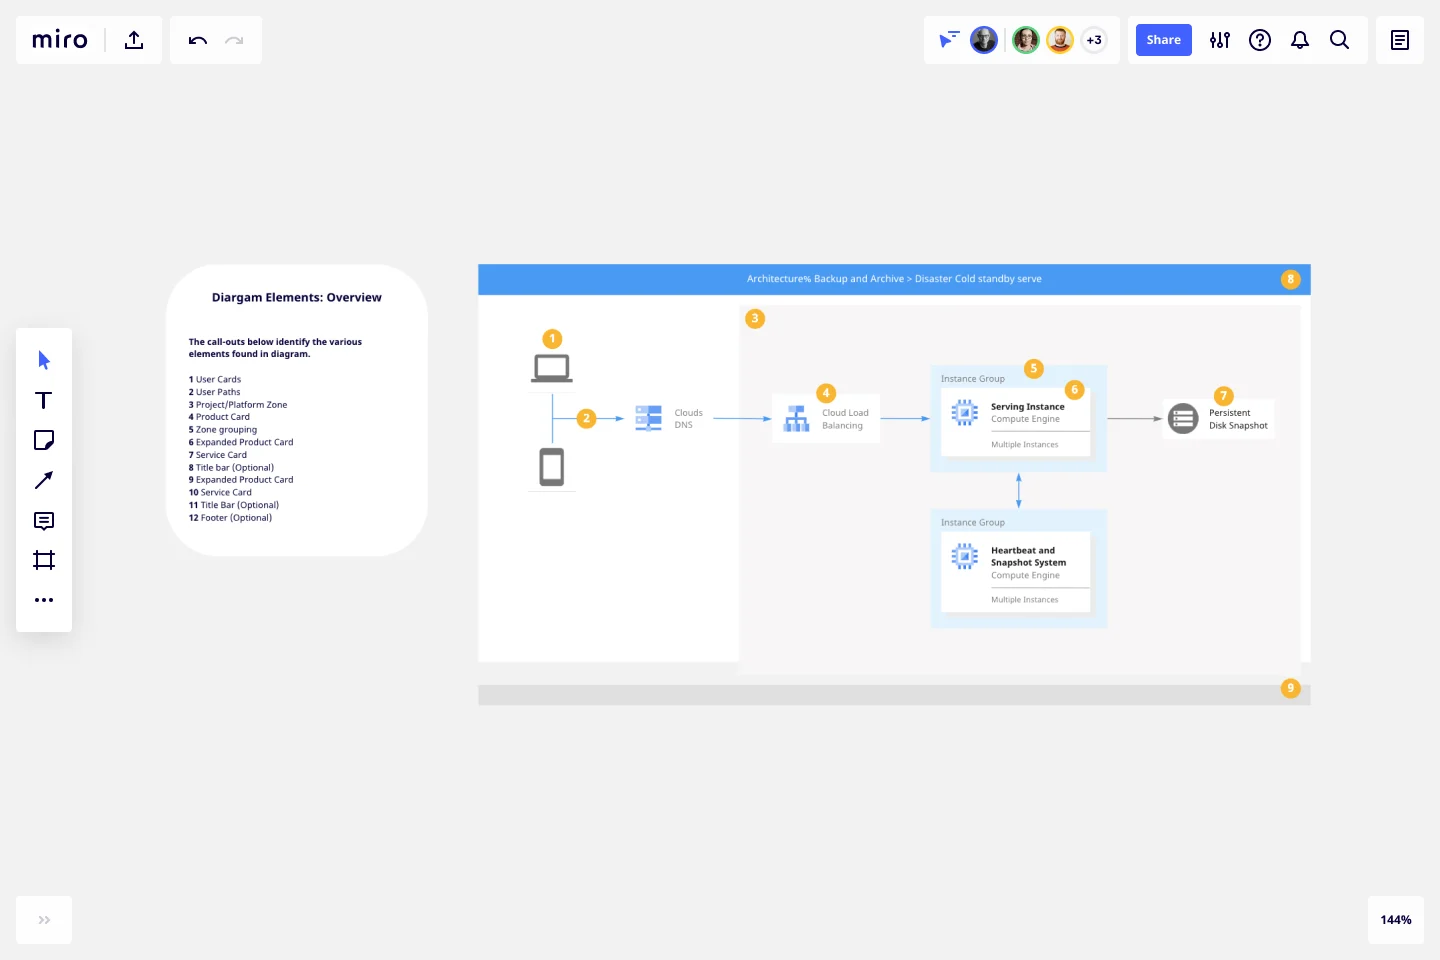
GCP Architecture diagram for network optimization
Developers and IT managers use the Google Cloud Architecture Diagram template to make changes and accurately document the network infrastructure.
The GCP Architecture Diagram also allows people to quickly understand your Google Cloud architecture’s network design and operation, facilitating communication across your organization.
How do I create a Google Cloud Architecture Diagram template?
A Google Cloud Architecture Diagram template allows you to visualize the management of apps.
To create a basic Google Cloud Architecture Diagram template with Miro, you can follow these steps:
List your Google Cloud Architecture components, using our set of Google Cloud Icons.
Organize your diagram by adding in the components of the network..
Add connection lines between the component shapes and set the arrows in the direction of the flow.
Format and customize your Google Cloud Architecture Diagram template with shapes and frames.
In Miro, you can quickly build a GCP Diagram from scratch using our design tools and icons set, or use our Google Cloud Architecture Diagram template and customize it as you see fit.
If you are interested in creating other network diagrams, Miro is the perfect network diagram tool with several available shape packs and templates to suit your needs.
What is Google Cloud Platform used for?
The Google Cloud Platform is used to make network management and development of network infrastructure accessible and flexible, allowing organizations to create cloud-native apps and manage and analyze data quickly. The Google Cloud Platform helps you navigate many services categories from computer networks to storage and database.
How do I draw a Google cloud architecture?
There are many ways you can draw a Google Cloud Architecture Diagram with Miro. You can either use our template or draw your GCP diagram from scratch. Follow these steps to draw your Google Cloud Architecture Diagram in Miro: select which GCP icons to use for your diagram from Miro’s Google Cloud Platform component library. Next, use connector lines and other shapes to outline and describe your network, and lastly, add arrows to represent the flow of information.
Get started with this template right now.
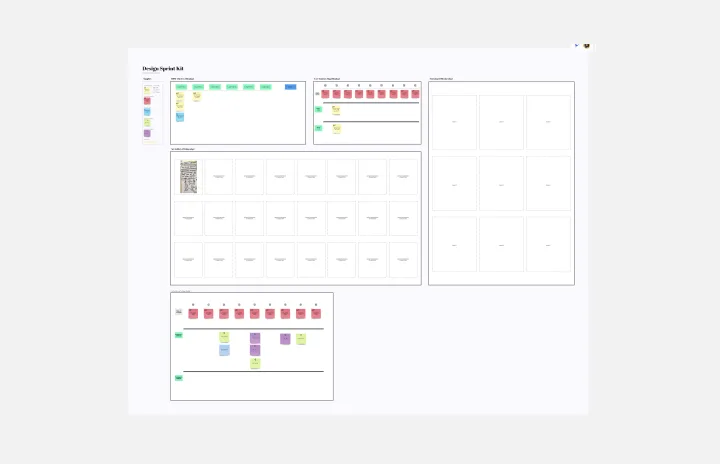
Design Sprint Kit Template
Works best for:
Agile Methodology, UX Design, Sprint Planning
With the right focused and strategic approach, five days is all it takes to address your biggest product challenges. That’s the thinking behind Design Sprint methodology. Created by Tanya Junell of Blue Label Labs, this Design Sprint Kit provides a set of lightweight templates that support the Design Sprint’s collaborative activities and voting—and maintains the energy, team spirit, and momentum that was sparked in the session. Virtual sprint supplies and prepared whiteboards make this kit especially useful for remote Design Sprint Facilitators.
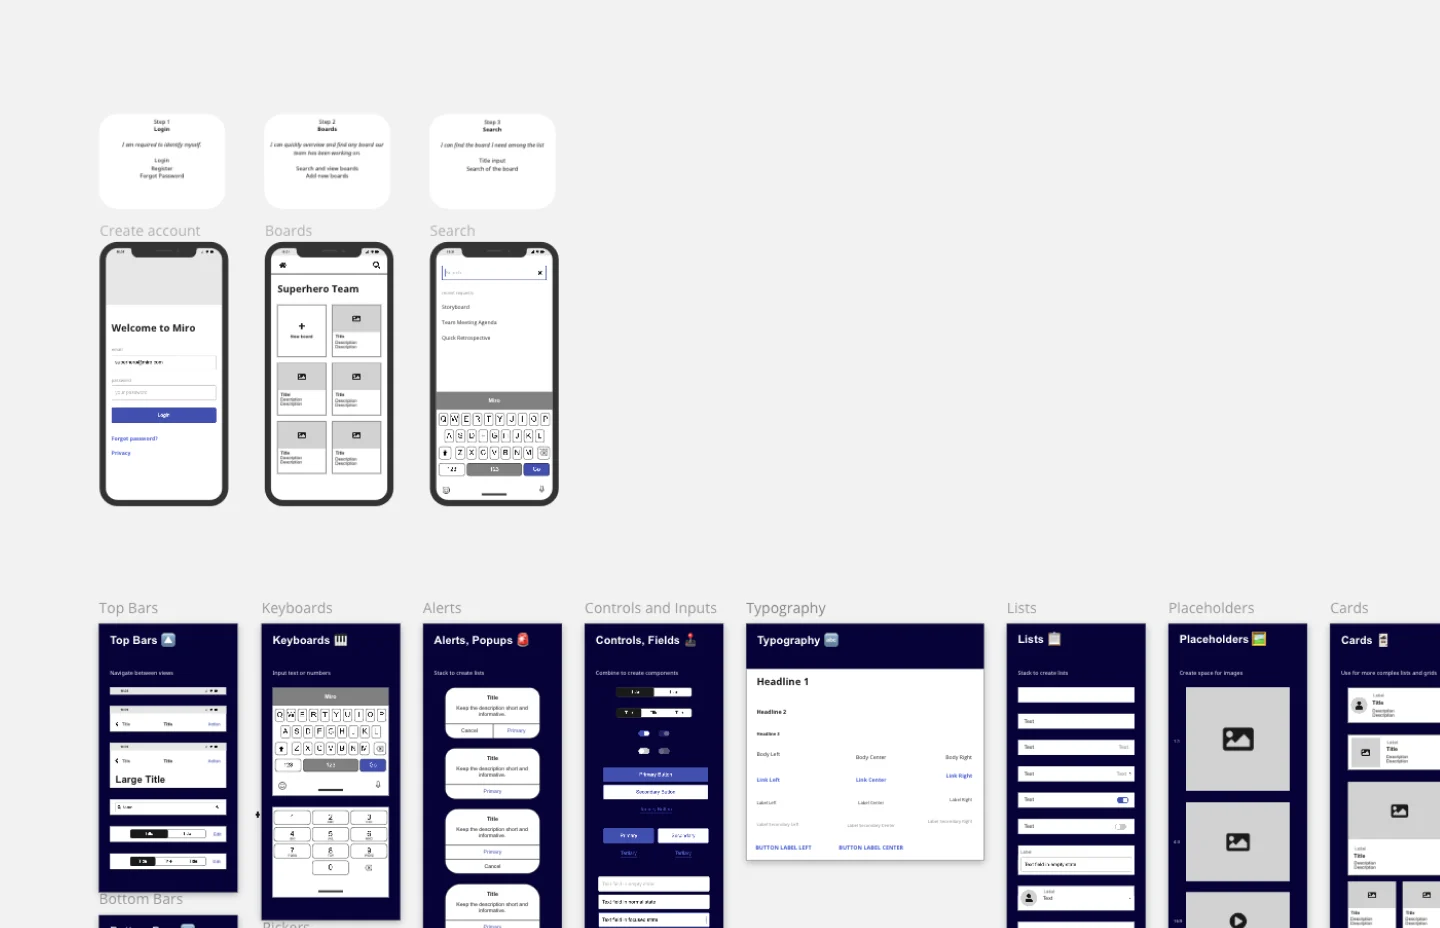
App Wireframe Template
Works best for:
UX Design, Wireframes
Ready to start building an app? Don’t just imagine how it will function and how users will interact with it—let a wireframe show you. Wireframing is a technique for creating a basic layout of each screen. When you wireframe, ideally early in the process, you’ll gain an understanding of what each screen will accomplish and get buy-in from important stakeholders—all before adding the design and content, which will save you time and money. And by thinking of things in terms of a user’s journey, you’ll deliver a more compelling, successful experience.
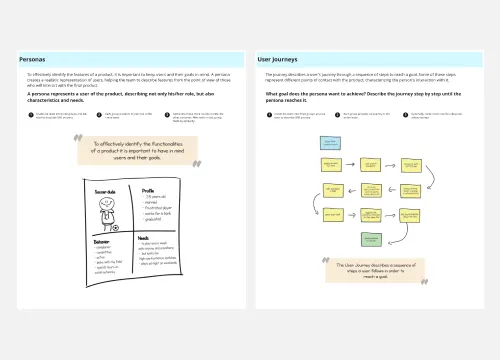
Lean Inception Workshop
Works best for:
Agile, Lean Methodology
The Lean Inception Workshop streamlines project kickoff by aligning teams on goals, scope, and priorities. It leverages Lean principles to eliminate waste and maximize value, guiding exercises to define user personas, map user journeys, and prioritize features. By fostering cross-functional collaboration and customer-centric thinking, this template accelerates project initiation and ensures alignment between stakeholders, empowering teams to deliver customer value faster.
Cluster Diagram Template
Works best for:
Diagramming
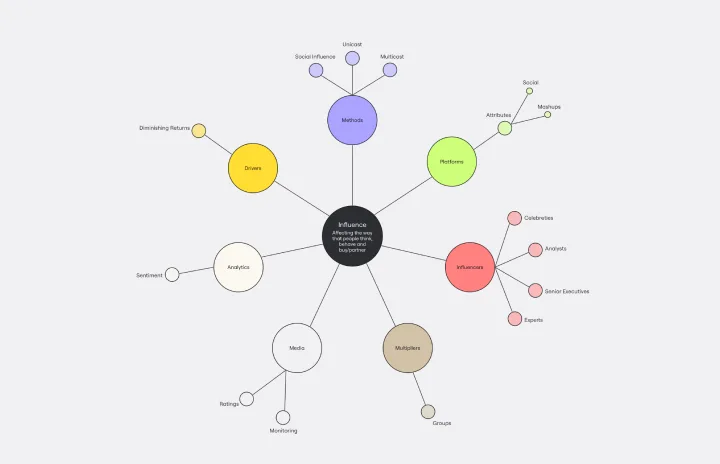
The Cluster Diagram Template is a valuable tool for organizing and connecting ideas, concepts, and information in a visually compelling and coherent manner. The template's design centers on grouping related ideas around a core concept, creating a transparent and hierarchical structure. This clustering not only aids in breaking down complex information into manageable segments but also significantly enhances the process of idea generation and brainstorming. A structured yet flexible visual framework encourages deeper engagement and more precise understanding, making it an essential asset for teams and people looking to bring order to their creative and analytical processes. I have checked the text for any potential spelling, grammar, and punctuation errors, and it's good to go.
DMAIC Analysis Template
Works best for:
Agile Methodology, Design Thinking, Operations
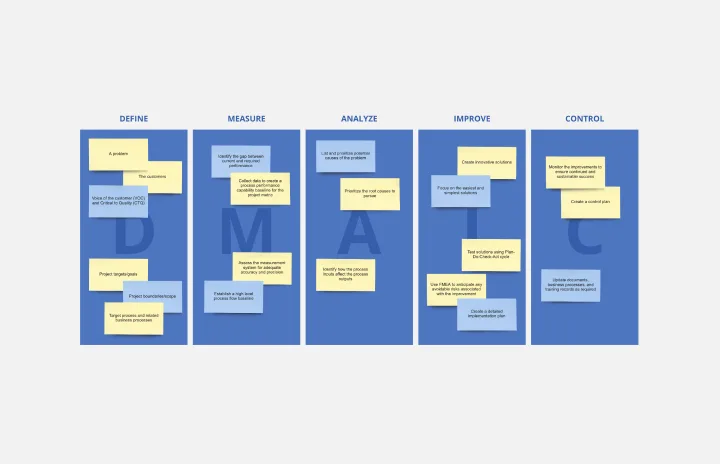
Processes might not seem like the funnest thing to dive into and examine, but wow can it pay off—a more efficient process can lead to serious cost savings and a better product. That’s what DMAIC analysis does. Developed as part of the Six Sigma initiative, DMAIC is a data-driven quality strategy for streamlining processes and resolving issues. The technique is broken into five fundamental steps that are followed in order: Define, Measure, Analyze, Improve, and Control.

User Flow Template
Works best for:
Desk Research, Flowcharts, Mapping
User flows are diagrams that help UX and product teams map out the logical path a user should take when interacting with a system. As a visual tool, the user flow shows the relationship between a website or app’s functionality, potential actions a user could take, and the outcome of what the user decides to do. User flows help you understand what a user does to finish a task or complete a goal through your product or experience.