Cisco Network Diagram Template
Cisco offers data center and access networking solutions built for scale with industry-leading automation, programmability, and real-time visibility.
Trusted by 65M+ users and leading companies


About the Cisco Data Network Diagram Template
Cisco offers data center and access networking solutions built for scale with industry-leading automation, programmability, and real-time visibility. The Cisco Data Network Diagram template can help you design and showcase the organization’s network infrastructure.
Keep reading to learn more about the Cisco Data Network Diagram Template.
What is the Cisco Data Network Diagram Template
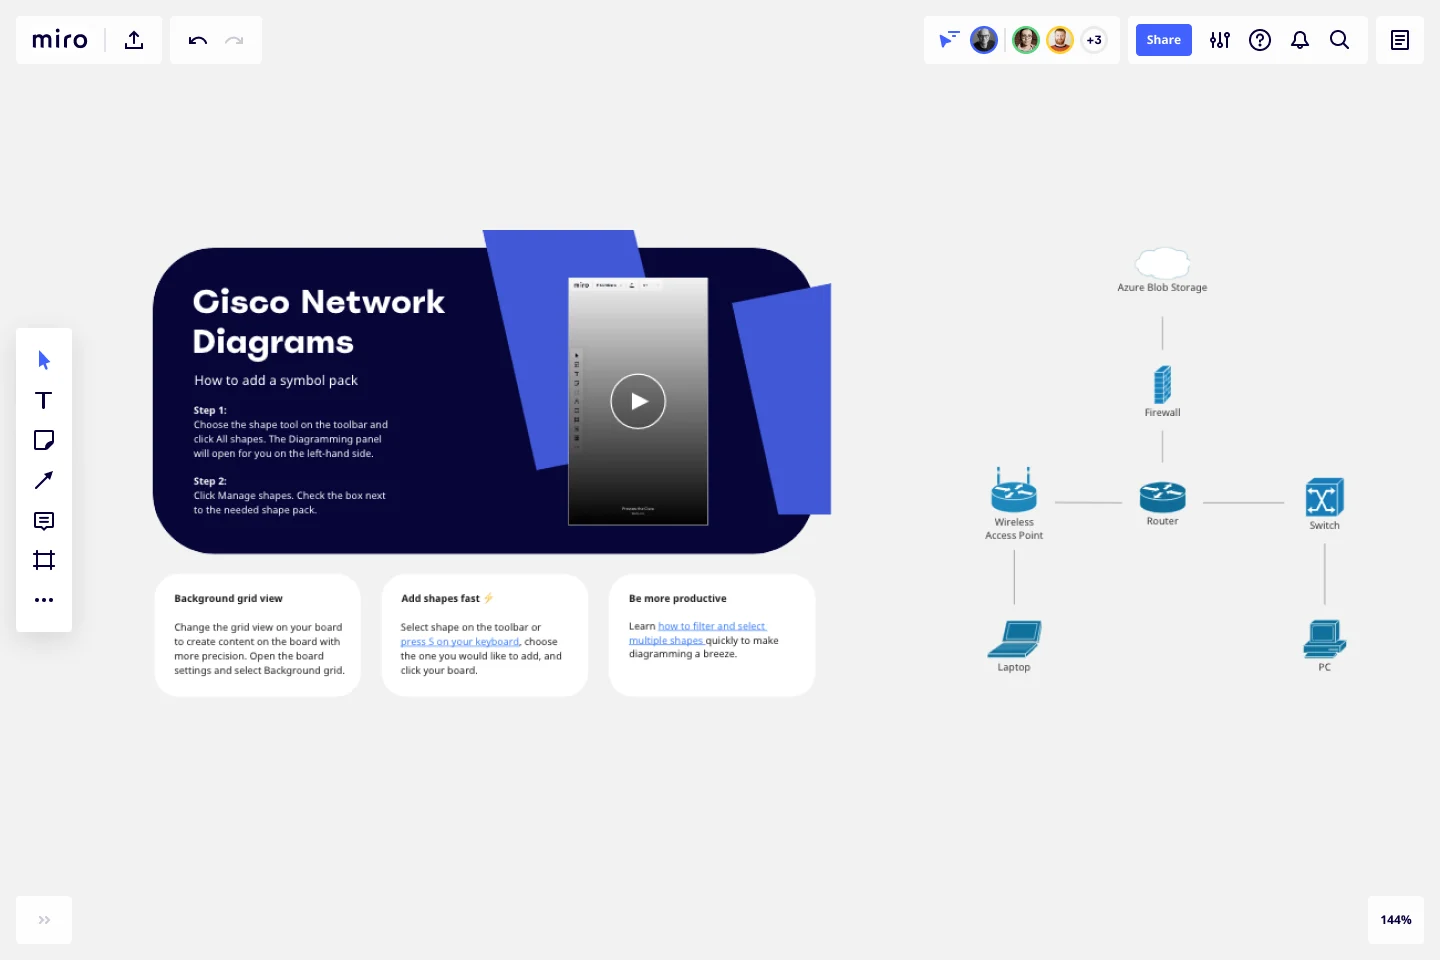
The Cisco Data Network Diagram Template, like any other network diagram, visually shows the design of the network infrastructure. The Cisco Data Network Diagram has unique icons and symbols.
When to use Cisco Data Network Diagram Template
You can use the Cisco Data Network Diagram Template to visualize the telecommunication and computer network topology and layout.
Here you can find the semantics of Cisco Data Network Diagrams:
Shapes: Icons represent a Cisco service or product.
Connectors: Use arrows to indicate flows (e.g. data, information, communication). Use a single-headed arrow to indicate a single initiator. Use a double-headed arrow to indicate that the icon shown at either end of the arrow can initiate a flow.
Layout and Grouping: Groups show the connection between multiple services/products and can represent layers of the architecture.
If you are interested in creating other network diagrams, Miro is the perfect network diagram tool with several available shape packs and templates to suit your needs.
How do I make a Cisco Data Network Diagram Template?
To make a Cisco Data Network Diagram in Miro is easy. You can use our Cisco Data Network Diagram Template and customize it as you see fit. Once you have the diagram structure, you can start adding the icons. You can find the icons under our Cisco Icon Set integration.
Get started with this template right now.
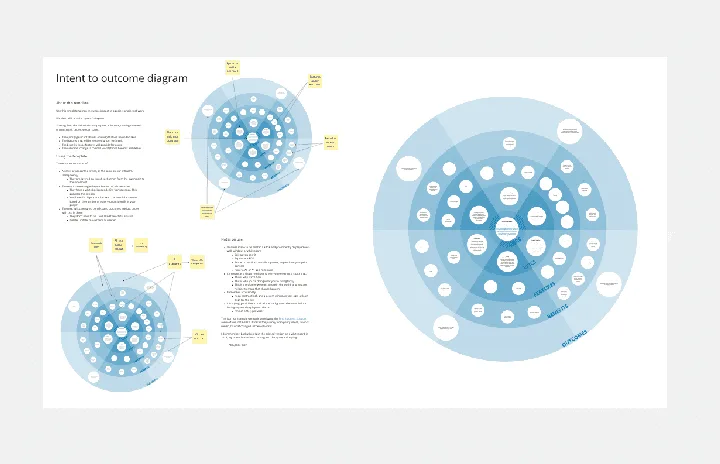
Intent to Outcome Diagram
Works best for:
Diagramming
The Intent to Outcome Diagram template is a visual tool for mapping out the relationship between desired outcomes and the actions required to achieve them. It provides a structured framework for defining intentions, outcomes, and key activities. This template enables teams to align on goals, track progress, and identify areas for improvement. By promoting clarity and alignment, the Intent to Outcome Diagram empowers organizations to set strategic direction and drive results effectively.
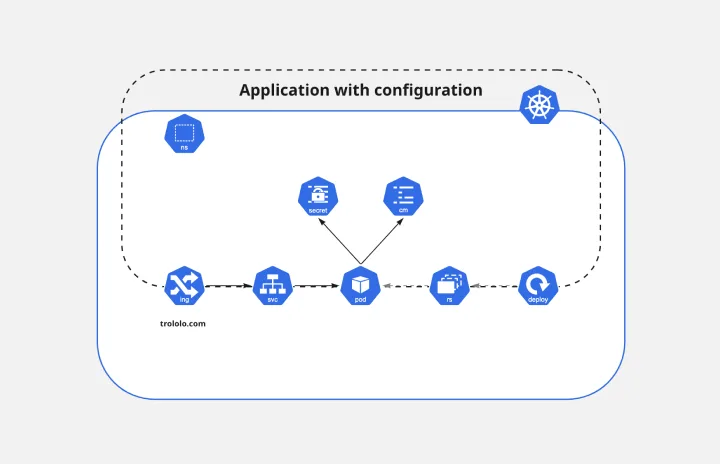
Kubernetes Application Template
Works best for:
Software Development, Diagrams
Use the Kubernetes Application template to manage enterprise-ready containerized applications better. You can now get your team more agile when dealing with portability, licensing, and consolidated billing. The Kubernetes Application template allows you to run deployments anywhere, facilitating the management of your applications. Try it out and see if it’s the best fit for you and your team.
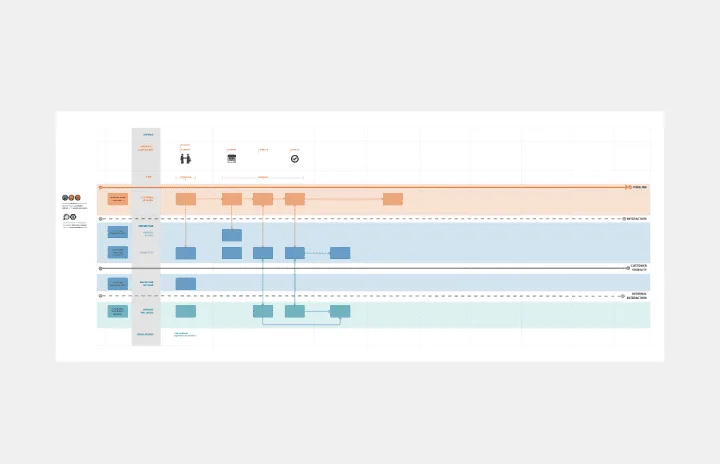
Service Blueprint
Works best for:
Diagramming
The Service Blueprint template is a visual tool for designing and optimizing service experiences. It provides a structured framework for mapping customer journeys, identifying touchpoints, and aligning internal processes. This template enables teams to visualize the entire service ecosystem, uncover pain points, and innovate solutions to enhance customer satisfaction. By promoting customer-centricity and collaboration, the Service Blueprint empowers organizations to deliver exceptional service experiences and drive sustainable growth.
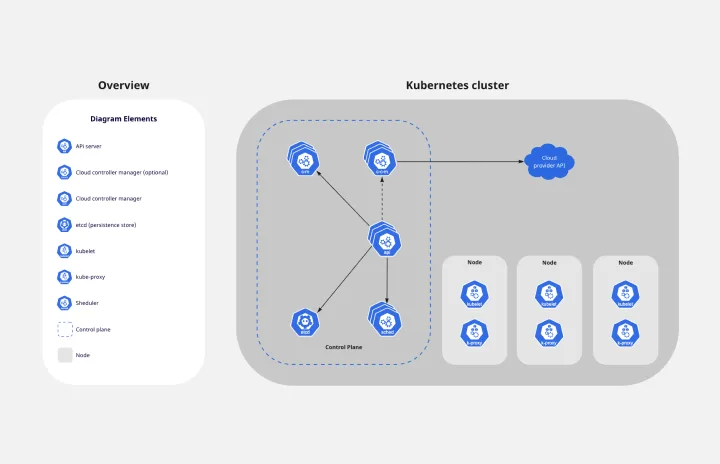
Kubernetes Architecture Diagram Template
Works best for:
Software Development, Diagrams
Use the Kubernetes Architecture Diagram template to manage your containerized applications better and bring your apps’ deployment, management, and scalability to the next level. This template helps you lower the downtime in production and allows you to have a more agile app production. Improve the deployment of your apps by visualizing every step of the process with the Kubernetes Architecture template. Try it out, and see if it works for you and your team.
Person Api Uml
Works best for:
Diagramming
The Person Api Uml template offers a visual framework for designing and modeling Person API structures and interactions. It provides elements for defining entities, attributes, and relationships within a Person API system. This template enables teams to visualize and communicate the structure and behavior of Person APIs, facilitating collaboration and alignment among stakeholders. By promoting clarity and consistency in API design, the Person Api Uml template empowers teams to build robust and interoperable Person API solutions.
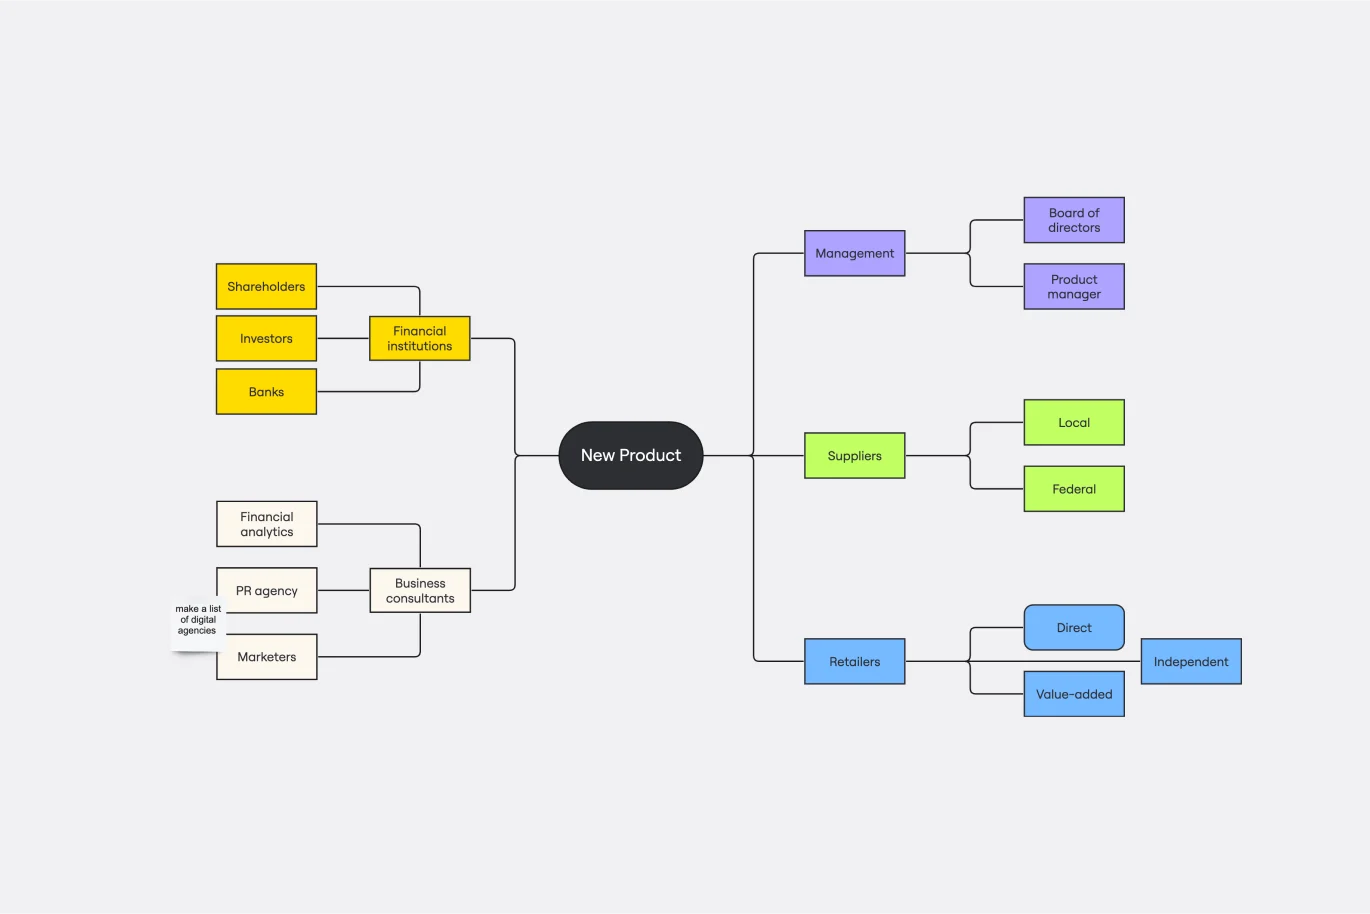
Stakeholder Mapping Template
Works best for:
Business Management, Mapping, Workflows
A stakeholder map is a type of analysis that allows you to group people by their power and interest. Use this template to organize all of the people who have an interest in your product, project, or idea in a single visual space. This allows you to easily see who can influence your project, and how each person is related to the other. Widely used in project management, stakeholder mapping is typically performed at the beginning of a project. Doing stakeholder mapping early on will help prevent miscommunication, ensure all groups are aligned on the objectives and set expectations about outcomes and results.