Google Cloud Architecture Diagram Template
Visualize the deployment of your applications with Google Cloud Architecture Diagram template and optimize your processes.
Trusted by 65M+ users and leading companies


About the Google Cloud Architecture Diagram Template
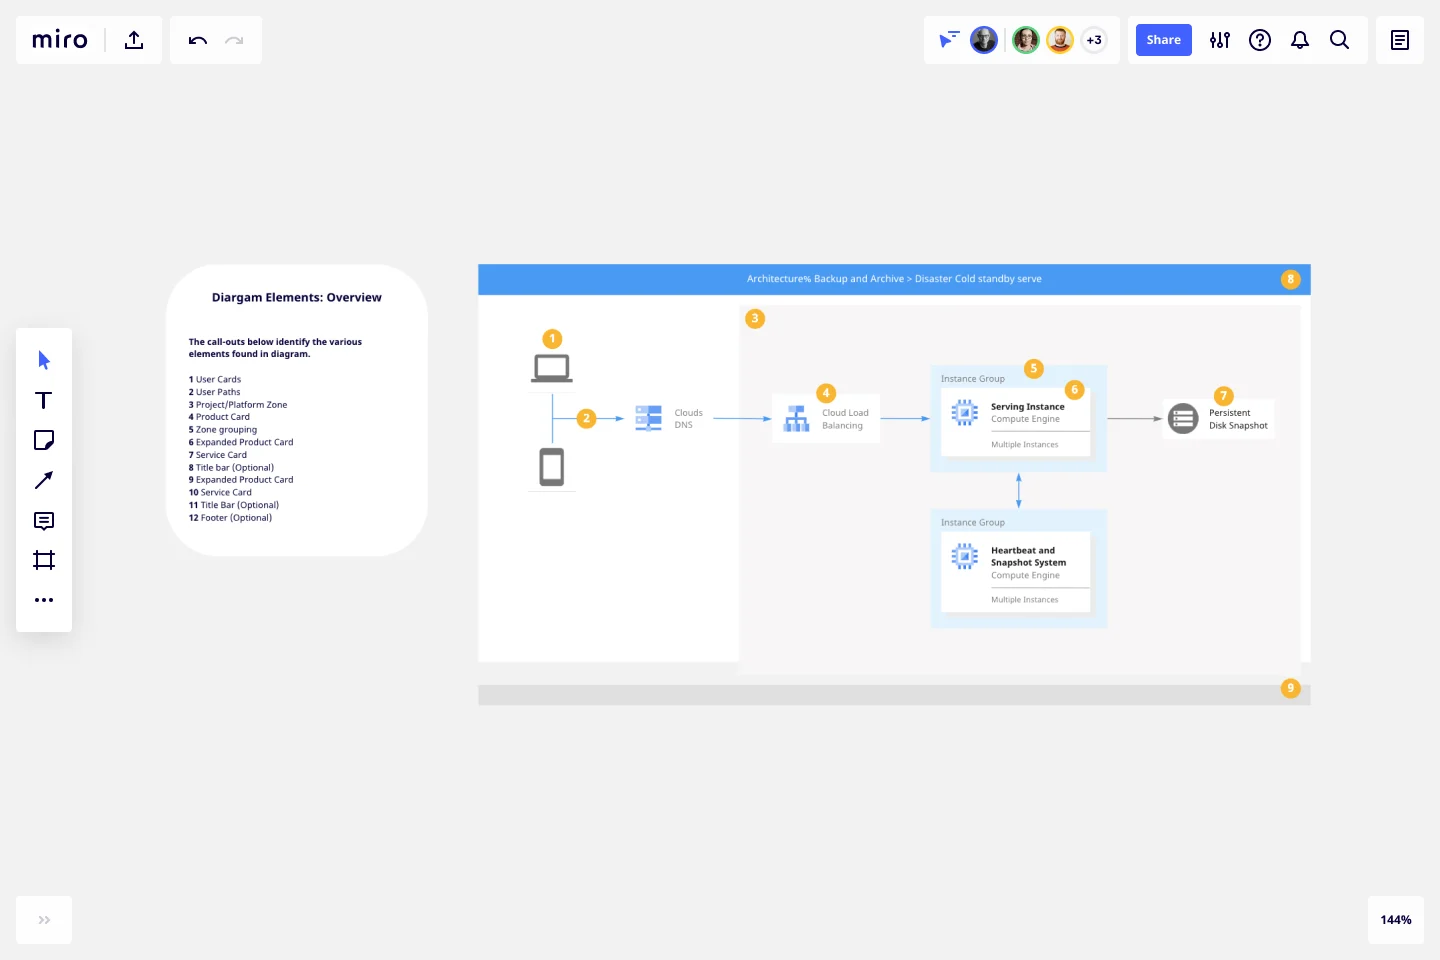
A Google Cloud Architecture Diagram template is where you can visually represent and manage application development, deployment, and documentation. You can use this Google Cloud Architecture Diagram template to stay in sync with your team, have an excellent application architecture overview, and quickly iterate if needed.
Keep reading to learn more about the Google Cloud Architecture Diagram Template.
GCP Architecture diagram for network optimization
Developers and IT managers use the Google Cloud Architecture Diagram template to make changes and accurately document the network infrastructure.
The GCP Architecture Diagram also allows people to quickly understand your Google Cloud architecture’s network design and operation, facilitating communication across your organization.
How do I create a Google Cloud Architecture Diagram template?
A Google Cloud Architecture Diagram template allows you to visualize the management of apps.
To create a basic Google Cloud Architecture Diagram template with Miro, you can follow these steps:
List your Google Cloud Architecture components, using our set of Google Cloud Icons.
Organize your diagram by adding in the components of the network..
Add connection lines between the component shapes and set the arrows in the direction of the flow.
Format and customize your Google Cloud Architecture Diagram template with shapes and frames.
In Miro, you can quickly build a GCP Diagram from scratch using our design tools and icons set, or use our Google Cloud Architecture Diagram template and customize it as you see fit.
If you are interested in creating other network diagrams, Miro is the perfect network diagram tool with several available shape packs and templates to suit your needs.
What is Google Cloud Platform used for?
The Google Cloud Platform is used to make network management and development of network infrastructure accessible and flexible, allowing organizations to create cloud-native apps and manage and analyze data quickly. The Google Cloud Platform helps you navigate many services categories from computer networks to storage and database.
How do I draw a Google cloud architecture?
There are many ways you can draw a Google Cloud Architecture Diagram with Miro. You can either use our template or draw your GCP diagram from scratch. Follow these steps to draw your Google Cloud Architecture Diagram in Miro: select which GCP icons to use for your diagram from Miro’s Google Cloud Platform component library. Next, use connector lines and other shapes to outline and describe your network, and lastly, add arrows to represent the flow of information.
Get started with this template right now.
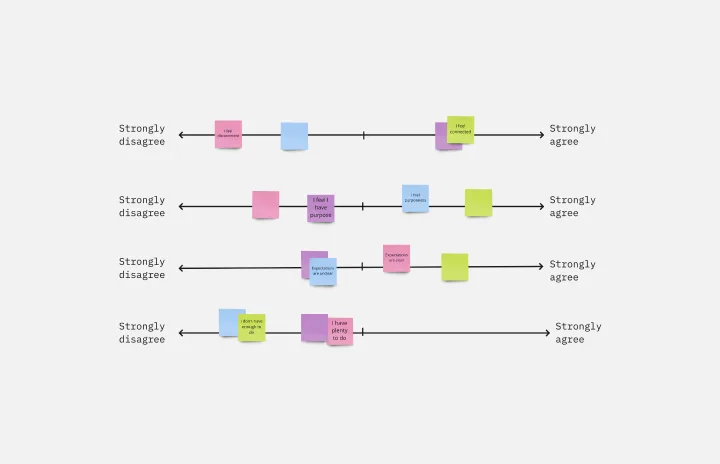
Likert Scale Template
Works best for:
Desk Research, Decision Making, Product Management
It’s not always easy to measure complex, highly subjective data — like how people feel about your product, service, or experience. But the Likert scale is designed to help you do it. This scale allows your existing or potential customers to respond to a statement or question with a range of phrases or numbers (e.g., from “strongly agree” to “neutral,” to “strongly disagree,” or from 1 to 5). The goal is to ask your customer some specific questions to turn into easy-to-interpret actionable user insights.
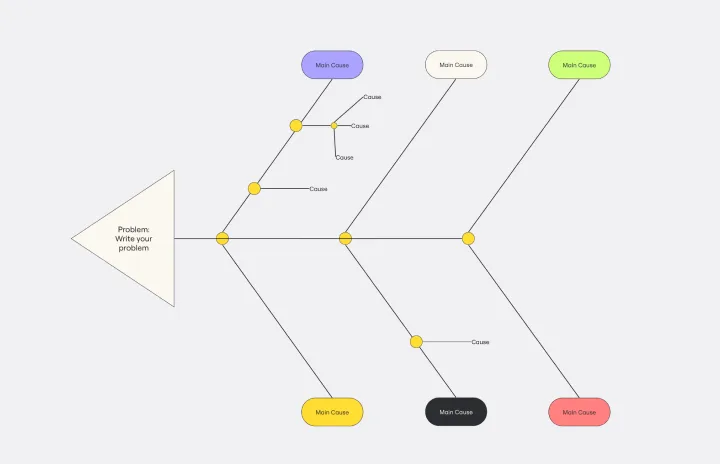
Cause and Effect Diagram Template
Works best for:
Diagramming
The Cause and Effect Diagram Template is a useful tool for analyzing complex relationships, identifying root causes of problems, and improving organizational processes. It can be customized to fit user's unique needs and provides a structured framework for analysis. Teams can use real-time collaborative analysis on the Miro platform to drive continuous improvement initiatives.
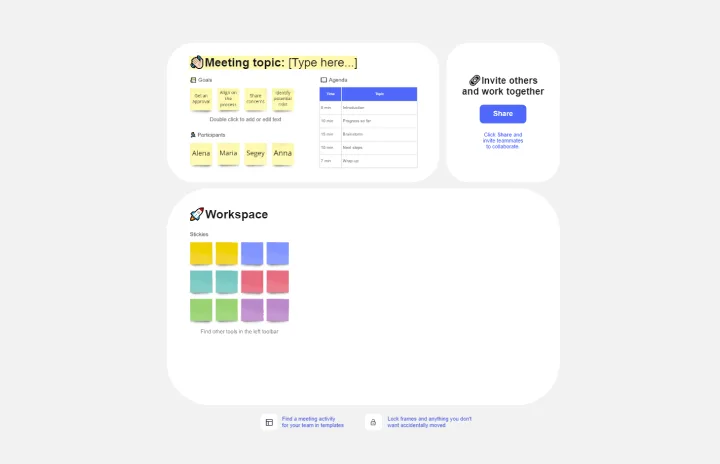
Meeting Template
Works best for:
Meetings, Team Meetings, Workshops
Everyone has been in a meeting that didn’t go as planned. Maybe it ran off course, or you ran out of time to accomplish everything you set out to do -- or maybe it just felt like a waste of time. To avoid that, it’s important to prepare to run a team meeting ahead of time. With this simple but effective template, you can prepare to run a team meeting that ticks all the boxes. By creating a streamlined way to build preparation into your workflow, you’ll ensure your meetings are efficient, enjoyable, and collaborative.
UML Component Diagram Template
Works best for:
Mapping, Diagrams, Software Development
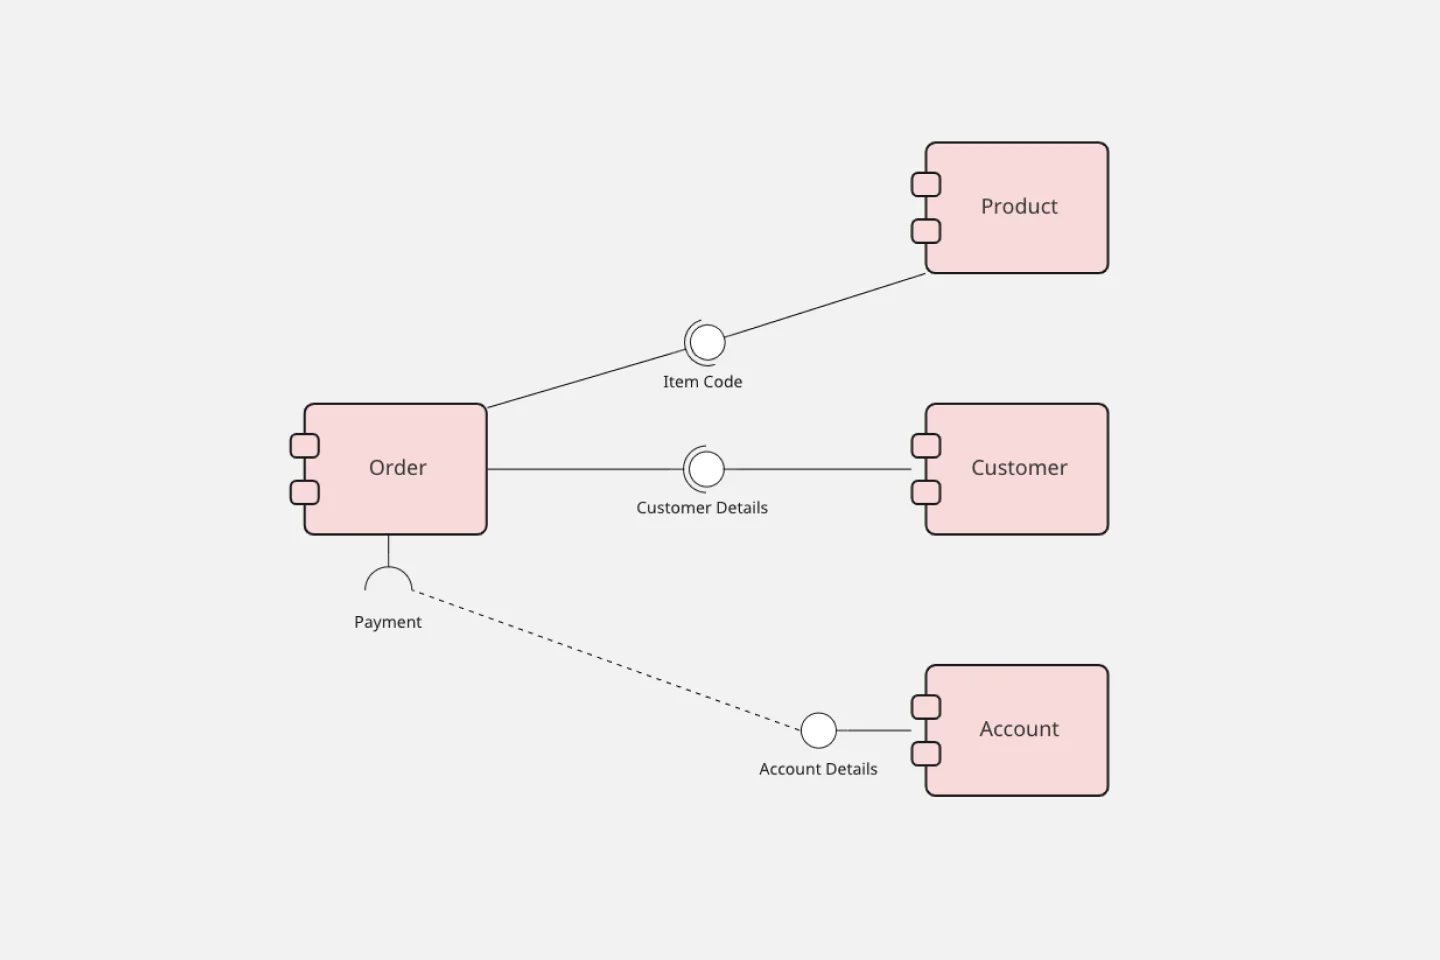
Use our Component Diagram template to show how a system’s physical components are organized and wired together. Visualize implementation details, make sure planned development matches system needs, and more — all in a collaborative environment.
AWS Architecture Diagram Template
Works best for:
Software Development, Diagrams
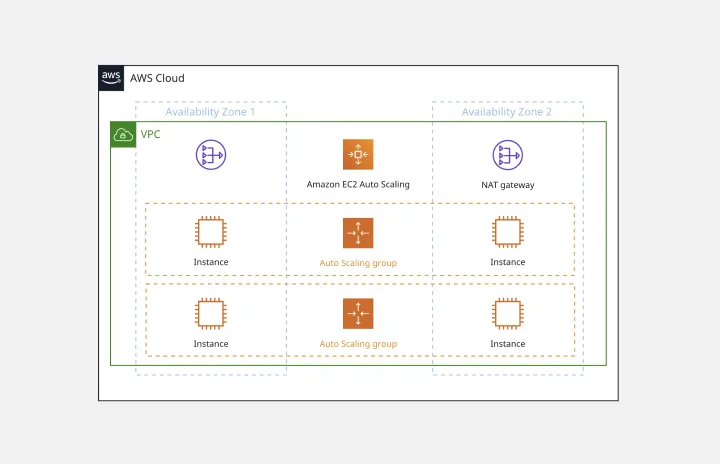
The AWS Architecture Diagram is a visual representation of the AWS framework, and it also translates the best practices when using Amazon Web Services architecture. You can now have an overview of your AWS architecture with Miro’s AWS Architecture Diagram Template, track your cloud solutions easily, and optimize processes like never before.
HEART Framework Template
Works best for:
Desk Research, Project Management, User Experience
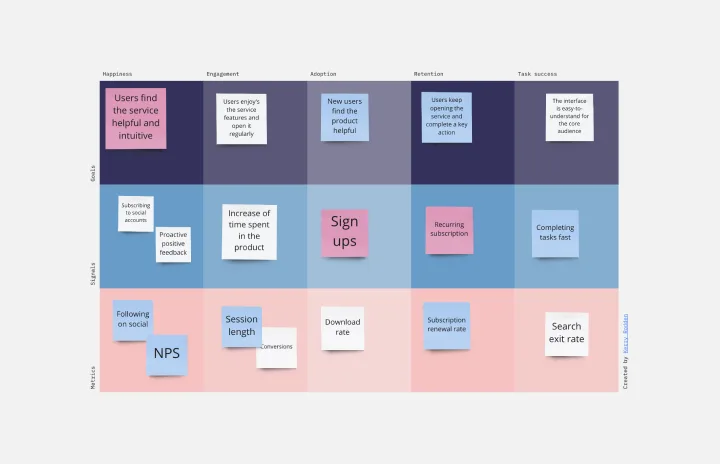
Happiness, Engagement, Adoption, Retention, and Task Success. Those are the pillars of user experience — which is why they serve as the key metrics in the HEART framework. Developed by the research team at Google, this framework gives larger companies an accurate way to measure user experience at scale, which you can then reference throughout the product development lifecycle. While the HEART framework uses five metrics, you might not need all five for every project — choose the ones that will be most useful for your company and project.