Google Cloud Architecture Diagram Template
Visualize the deployment of your applications with Google Cloud Architecture Diagram template and optimize your processes.
Trusted by 65M+ users and leading companies


About the Google Cloud Architecture Diagram Template
A Google Cloud Architecture Diagram template is where you can visually represent and manage application development, deployment, and documentation. You can use this Google Cloud Architecture Diagram template to stay in sync with your team, have an excellent application architecture overview, and quickly iterate if needed.
Keep reading to learn more about the Google Cloud Architecture Diagram Template.
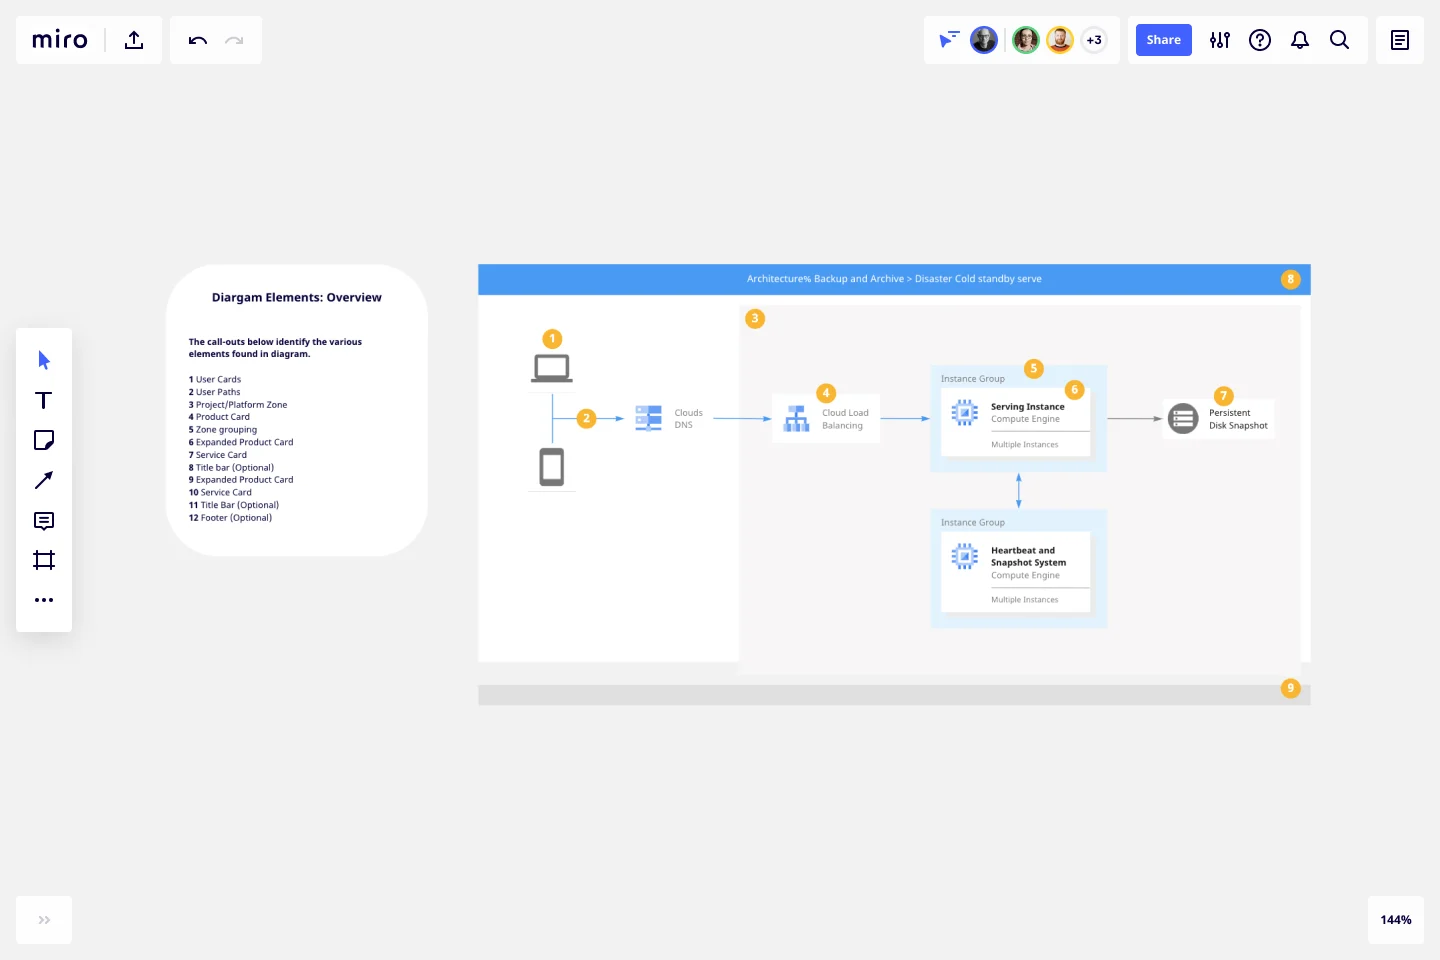
GCP Architecture diagram for network optimization
Developers and IT managers use the Google Cloud Architecture Diagram template to make changes and accurately document the network infrastructure.
The GCP Architecture Diagram also allows people to quickly understand your Google Cloud architecture’s network design and operation, facilitating communication across your organization.
How do I create a Google Cloud Architecture Diagram template?
A Google Cloud Architecture Diagram template allows you to visualize the management of apps.
To create a basic Google Cloud Architecture Diagram template with Miro, you can follow these steps:
List your Google Cloud Architecture components, using our set of Google Cloud Icons.
Organize your diagram by adding in the components of the network..
Add connection lines between the component shapes and set the arrows in the direction of the flow.
Format and customize your Google Cloud Architecture Diagram template with shapes and frames.
In Miro, you can quickly build a GCP Diagram from scratch using our design tools and icons set, or use our Google Cloud Architecture Diagram template and customize it as you see fit.
If you are interested in creating other network diagrams, Miro is the perfect network diagram tool with several available shape packs and templates to suit your needs.
What is Google Cloud Platform used for?
The Google Cloud Platform is used to make network management and development of network infrastructure accessible and flexible, allowing organizations to create cloud-native apps and manage and analyze data quickly. The Google Cloud Platform helps you navigate many services categories from computer networks to storage and database.
How do I draw a Google cloud architecture?
There are many ways you can draw a Google Cloud Architecture Diagram with Miro. You can either use our template or draw your GCP diagram from scratch. Follow these steps to draw your Google Cloud Architecture Diagram in Miro: select which GCP icons to use for your diagram from Miro’s Google Cloud Platform component library. Next, use connector lines and other shapes to outline and describe your network, and lastly, add arrows to represent the flow of information.
Get started with this template right now.
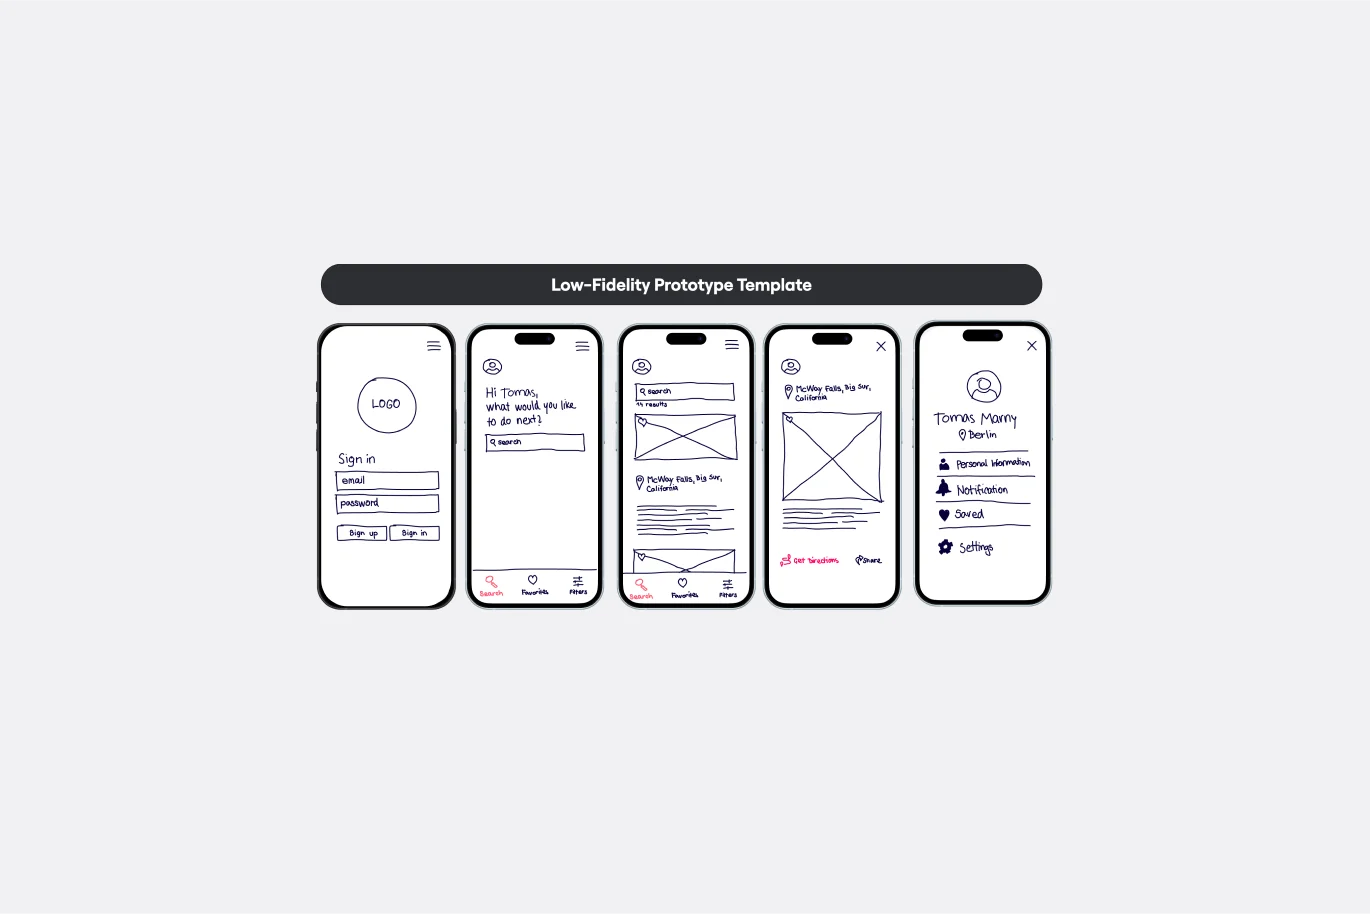
Low-Fidelity Prototype Template
Works best for:
Design, Desk Research, Wireframes
Low fidelity prototypes serve as practical early visions of your product or service. These simple prototypes share only a few features with the final product. They are best for testing broad concepts and validating ideas. Low fidelity prototypes help product and UX teams study product or service functionality by focusing on rapid iteration and user testing to inform future designs. The focus on sketching and mapping out content, menus, and user flow allows both designers and non-designers to participate in the design and ideation process. Instead of producing linked interactive screens, low fidelity prototypes focus on insights about user needs, designer vision, and alignment of stakeholder goals.

Azure Architecture Diagram Template
Works best for:
Software Development, Diagrams
The Azure Architecture Diagram Template is a diagram that will help you visualize the combination of any data and build and deploy custom machine learning models at scale. Azure is Microsoft’s cloud computing platform, designed to provide cloud-based services such as remote storage, database hosting, and centralized account management. Use Azure Architecture Diagram template to build sophisticated, transformational apps.

Opportunity Solution Tree Template
Works best for:
Flowcharts, Product Management, Diagrams
Solving problems — successful companies and productive teams just know how to do it. They’re able to identify many possible solutions, then settle on the one that leads to the desired outcome. That’s the power an Opportunity Solution Tree gives you. Designed by Teresa Torres, a product discovery coach, this mind map breaks down your desired outcome into opportunities for the product to meet user needs, then gives your team an effective way to brainstorm potential solutions.
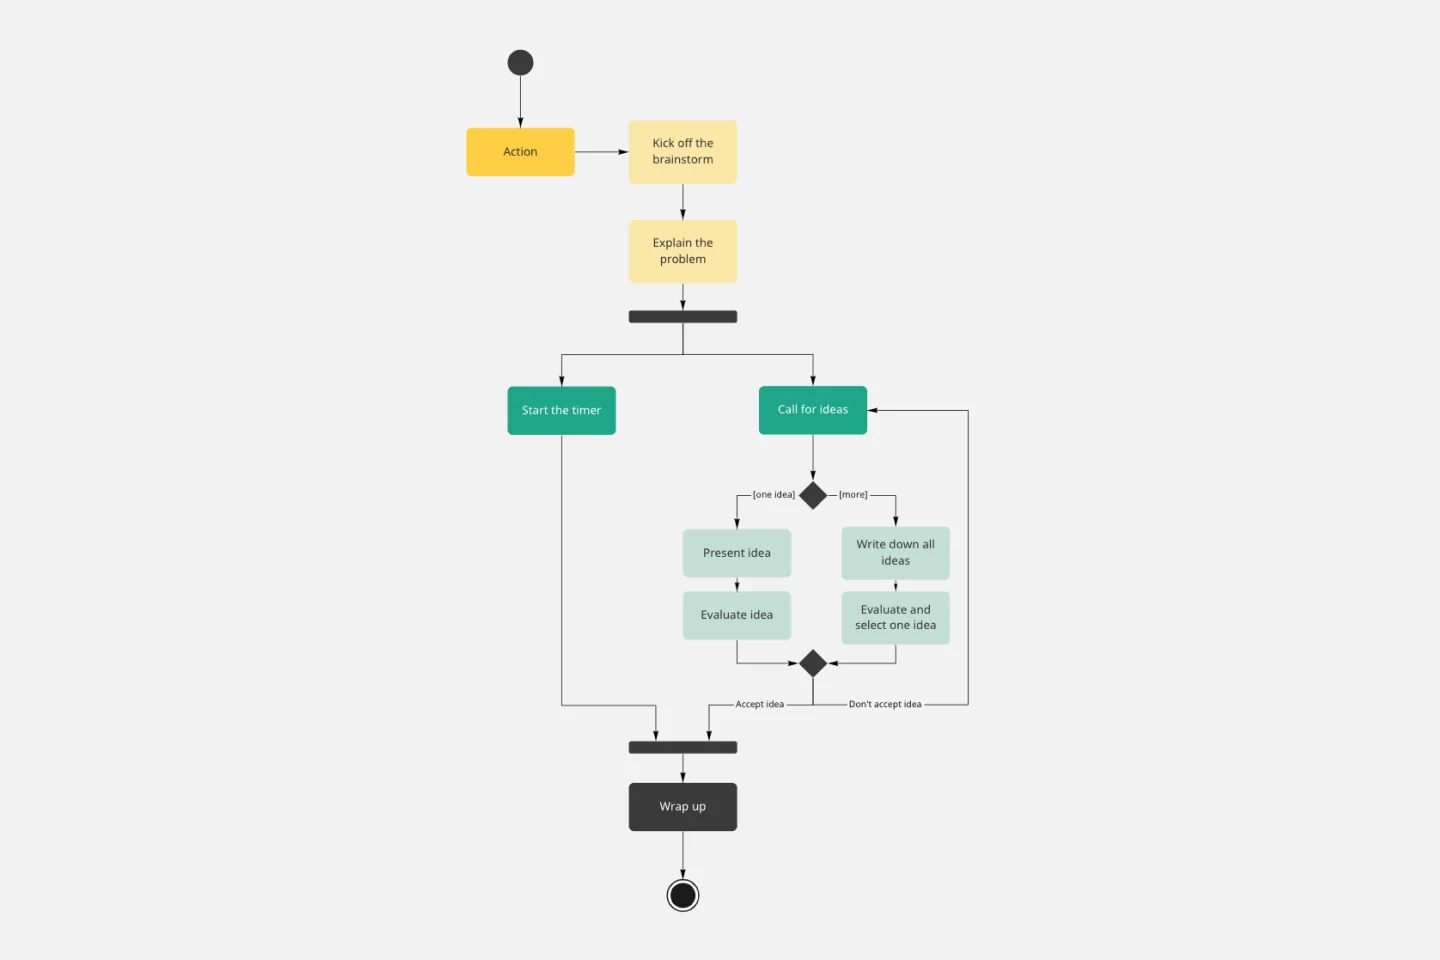
UML Activity Diagram Template
Works best for:
Diagrams
Use our Activity Diagram template to break down activities into smaller decisions and subprocesses. Improve and optimize systems and processes in I.T., business management, and more.
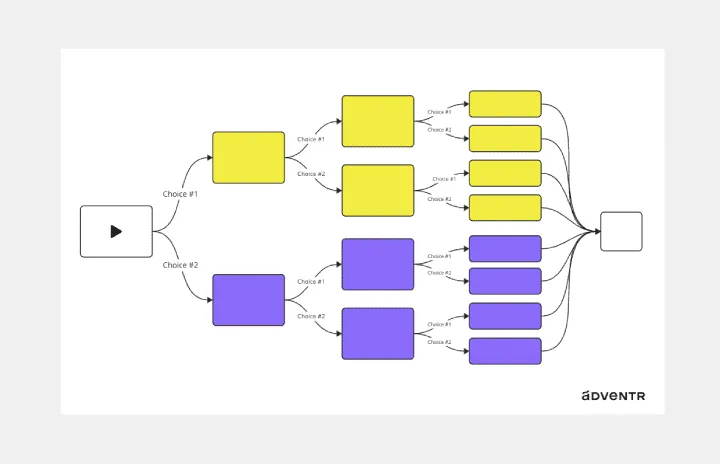
Interactive Video Storyboard Canvas
Works best for:
Diagramming
The Interactive Video Storyboard Canvas template offers a visual framework for planning and storyboarding interactive video content. It provides elements for outlining scenes, defining interactions, and visualizing user pathways. This template enables teams to design engaging and immersive video experiences, facilitating collaboration and alignment among content creators and stakeholders. By promoting creativity and interactivity, the Interactive Video Storyboard Canvas empowers teams to create compelling video narratives that captivate audiences and drive engagement.