Workflow Diagram Template
Bring clarity to teams with the workflow diagram template. By translating processes in a visual way, everyone gains a comprehensive understanding, reducing complexity and maximizing efficiency.
Trusted by 65M+ users and leading companies


About the Workflow Diagram Template
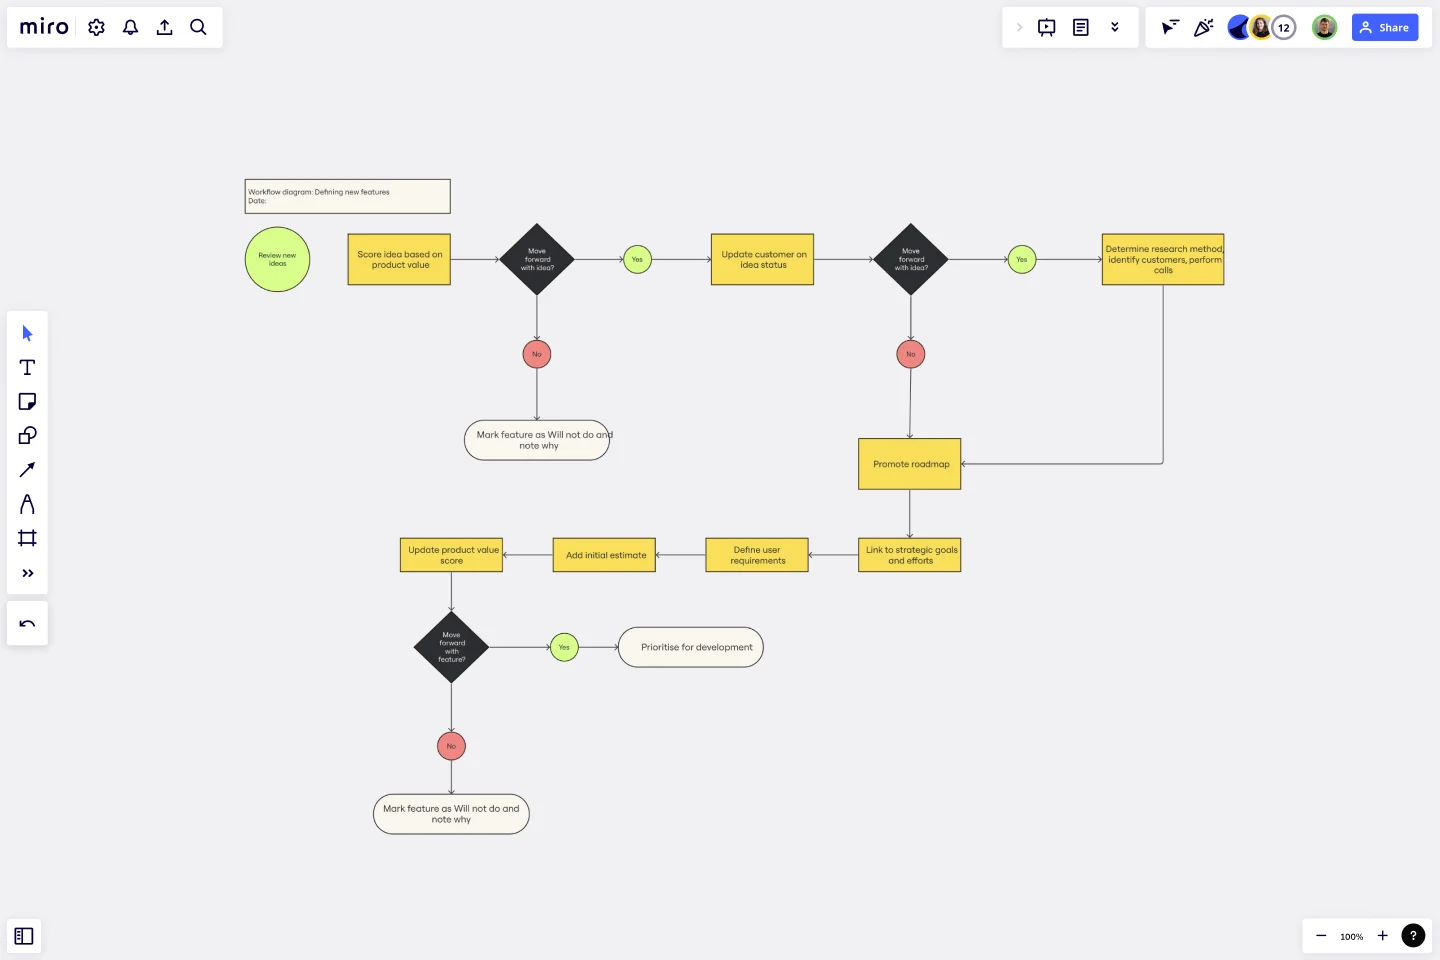
When seeking clarity in processes, visual assets often come to the rescue. Enter the workflow diagram template. This tool is designed to streamline operations, elucidate roles, and illuminate the path from task initiation to completion. It's a bridge between mere ideas and actual, tangible results, ensuring seamless progress for projects of all scales.
Using standardized symbols and shapes, the workflow diagram template depicts a process's various steps or stages and the flow of tasks between them. This is crucial for understanding, analyzing, and optimizing processes to enhance efficiency and ensure clarity among all team members.
How to use the workflow diagram template?
1. Add the template
Select the template in the Templates Library.
2. Customize it
Tailor the template to your needs effortlessly. Add, remove, or rearrange stages and steps by clicking on the shapes and connection lines. Edit color, font, and shape size using the context menu bar above the shape.
3. Expand your workflow diagram
As your process grows or changes, click on the shapes to expand or adapt your diagram.
4. Embed artifacts
Enhance your workflow diagram by adding any required artifacts. Be it documents, images, links, or notes – integrate them by uploading via a link or with the drag and drop feature.
Why should you use a workflow diagram template?
Increase clarity and understanding: By visually representing tasks and the flow between them, everyone gets a clearer picture of what needs to be done and how.
Optimize processes: Visualizing a process can help identify redundancies, bottlenecks, and inefficiencies. Once identified, steps can be rearranged, removed, or streamlined as needed.
Promote consistency: A standardized process ensures that tasks are executed consistently, resulting in predictable outcomes.
Increase collaboration: By laying out the entire process, team members can see where their tasks fit into the bigger picture, fostering collaboration and unity.
Use as a training tool: For newcomers or those unfamiliar with the process, a visual workflow can act as a guide, helping them learn and understand their roles and responsibilities faster.
Using process mapping software can be a game changer when you need to connect teams, optimize business processes, and scale your organization.
Is the template suitable for complex processes?
The template can be expanded and customized to cater to simple and complex processes. The automated diagram feature ensures that complexity doesn't interfere with clarity.
Can multiple team members work on the template simultaneously?
The platform supports real time collaboration, allowing multiple team members to edit, comment, and view the diagram simultaneously.
Can I integrate the workflow diagram with other tools?
Yes, the platform offers seamless integration capabilities, allowing you to link your workflow diagram with other tools and platforms you might be using, making it a central hub for all your process-related needs.
Get started with this template right now.

Onion Diagram Template
Works best for:
Diagramming, Mapping and Diagramming
The Onion Diagram Template is a distinct tool designed to visually represent layers of a specific concept, system, or process, akin to the layers of an onion. Each concentric layer of the diagram provides insights into a different aspect or phase of the topic at hand, moving from the core foundational element outwards to more peripheral components. One of the prime benefits of this template is its ability to offer hierarchical clarity. Users can immediately discern the importance, sequence, or interrelation of different elements within a system, facilitating enhanced comprehension and efficient decision-making.
Business Intelligence Architecture Template
Works best for:
Diagramming
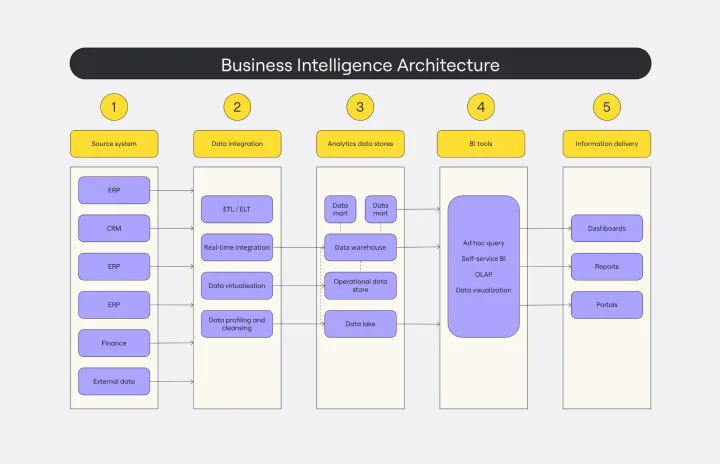
The Business Intelligence Architecture Diagram Template in Miro visually maps the complex landscape of business intelligence systems. With elements encompassing data sources, warehouses, ETL processes, tools, and end-user interfaces, the template enables users to communicate complex concepts with clarity. One standout feature is the template's dynamic adaptability, empowered by Miro's automated diagramming capabilities. This feature ensures that the diagram remains up-to-date with minimal effort, allowing users to effortlessly incorporate changes in data structures and processes, thus maintaining the relevance and accuracy of their visual representations over time.

Driver Diagram Template
Works best for:
Diagramming
The driver diagram template is a strategic visual tool that helps teams map out their primary objectives and break them down into actionable components. It presents goals, drivers, and specific change ideas in a coherent and interconnected format, ensuring clarity of objective. By doing so, every team member is aligned towards a common endpoint, fostering unified efforts. The visual nature of the template simplifies complex objectives, making it easier for teams to stay on track and measure their progress effectively.
Inverted Org Chart Template
Works best for:
Diagramming, Org Charts, Organizational Design
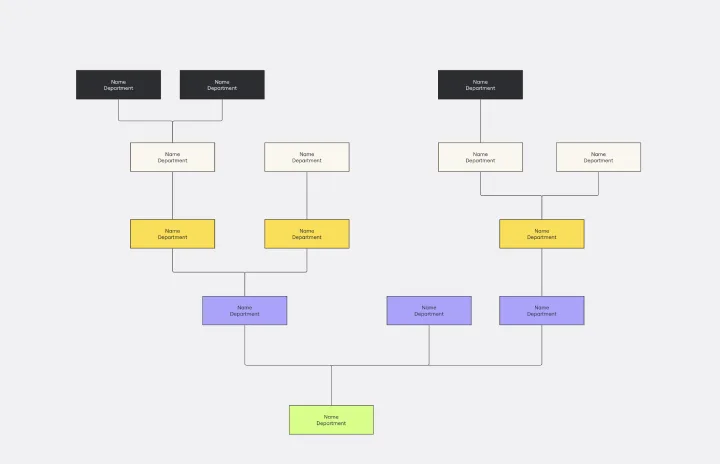
The Inverted Org Chart Template is a tool that reimagines the traditional hierarchical model by placing frontline employees at the top of the organizational structure. This innovative approach highlights the crucial role played by those who interact with customers directly, ensuring that their insights and contributions are not only recognized but also celebrated. One of the key advantages of this template is that it fosters a feedback-driven environment. Prioritizing frontline workers promotes a culture where valuable insights from the ground can quickly reach the top of the hierarchy, streamlining decision-making processes and ensuring that strategies are based on real-world experiences.
Turtle Diagram Template
Works best for:
Diagramming
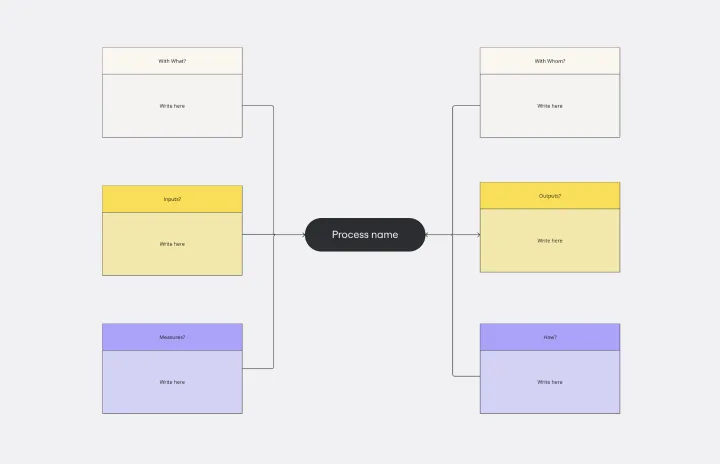
The Turtle Diagram Template is an essential tool for capturing the essence of a process. It offers many benefits, but one stands out: it fosters clear and comprehensive communication within teams. By breaking down processes into digestible components, the template creates a common ground for discussion. It helps team members unfamiliar with certain processes or from different departments collaborate effectively by ensuring everyone's on the same page about the inputs, outputs, roles, resources, and procedures. This is crucial for organizations that aim to maintain coherence in quality management practices and drive collective efforts toward operational excellence.
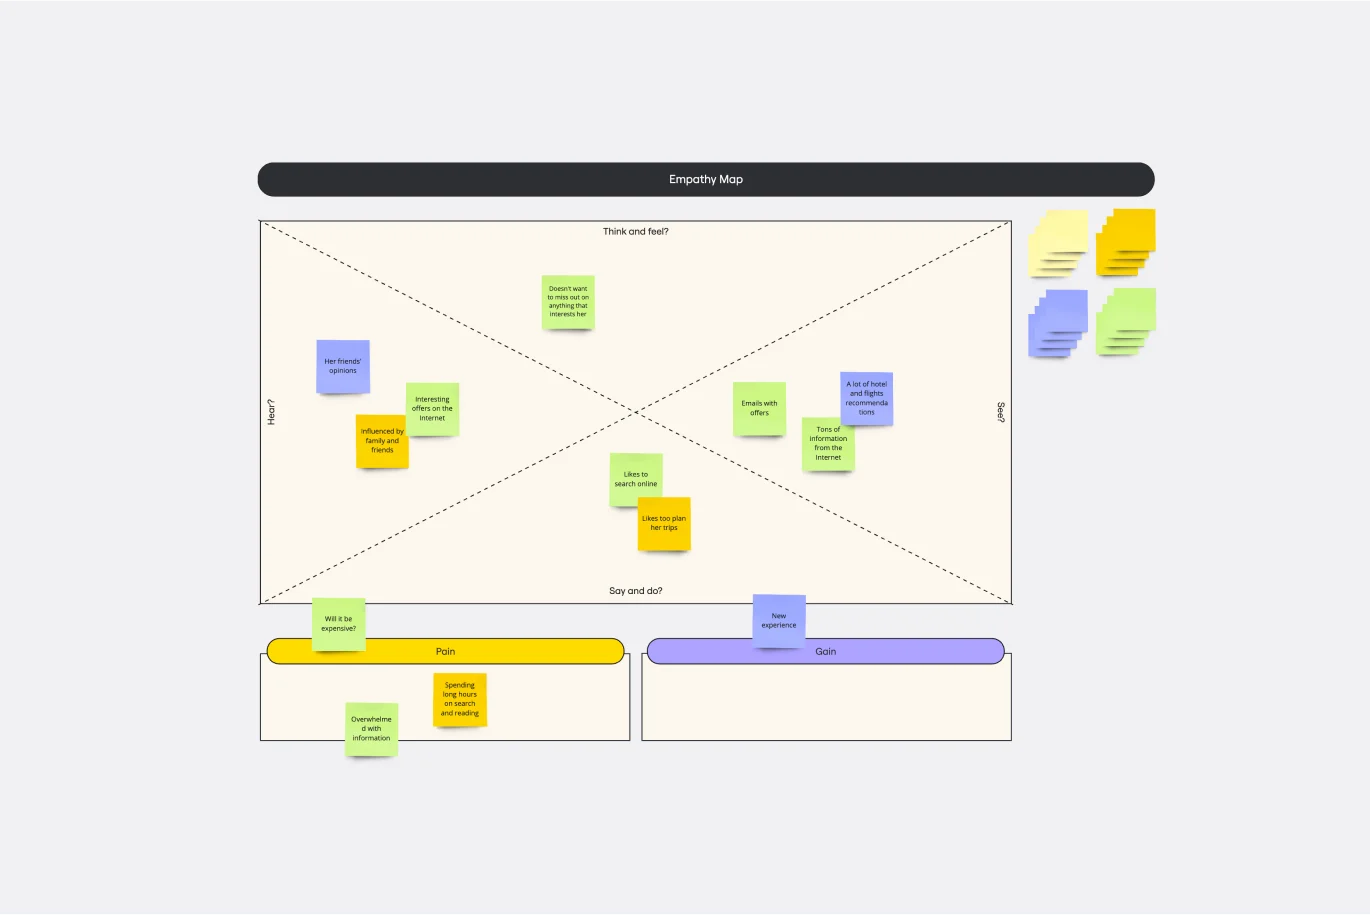
Empathy Map Template
Works best for:
Market Research, User Experience, Mapping
Attracting new users, compelling them to try your product, and turning them into loyal customers—it all starts with understanding them. An empathy map is a tool that leads to that understanding, by giving you space to articulate everything you know about your customers, including their needs, expectations, and decision-making drivers. That way you’ll be able to challenge your assumptions and identify the gaps in your knowledge. Our template lets you easily create an empathy map divided into four key squares—what your customers Say, Think, Do, and Feel.