Milestone Chart Template
Track each project using this milestone template, both on a visual timeline and on a static chart. Use this milestone diagram to plan out significant events scheduled to happen at specific times within the project.
Trusted by 65M+ users and leading companies


About the Milestone Chart Template
A milestone chart is a visual representation of important events, known as milestones, planned in a project’s timeline. Milestone charts show one milestone per vertical line, with a description on the left-hand side of the milestone, and a horizontal timescale for the whole project.
When to use a milestone chart
Anytime your team collaborates on a large project with multiple tasks and deadlines, you can use a milestone chart. You may also find it useful to share the milestone chart with your managers or customers to update them on your progress and the likelihood of meeting your overall deadline.
Benefits of using a milestone chart
Unless your team tracks your milestones, you have no way of knowing whether you’re getting closer to your destination. By deciding on and tracking key milestones for your project, you can stay on schedule and reach your goals on time.
How to create a milestone chart
If your project has been planned or is in the process of being planned, here’s how to create a simple but effective milestone chart.
Step 1: Determine major milestones
For project managers and stakeholders, it can be difficult to parse out milestones from tasks. Milestones are distinct because they signify shifts in a project’s development. Think of them as road signs that help you stay on the right path as you work to complete a project.
To decide on a milestone, you might find it helpful to ask the following questions:
Does this task impact our deadline?
Is this a task or a deliverable?
Will this point in the project signify significant forward progress?
Does this task need to be reviewed by stakeholders?
If this task doesn’t get done, can we still complete the project?
Step 2: Create a milestone chart from a template
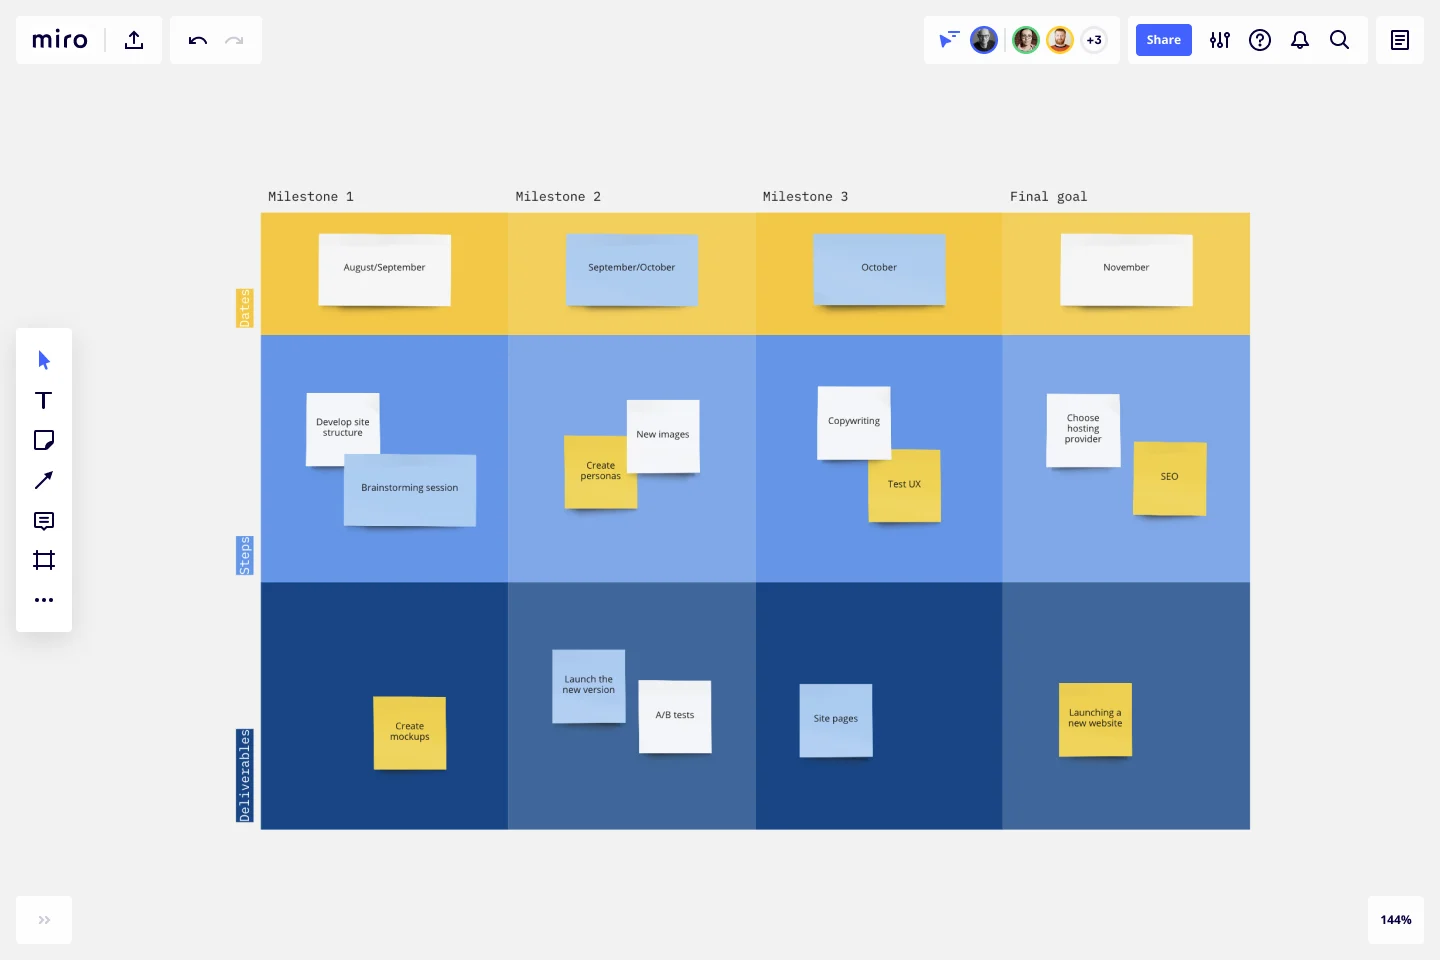
Miro is the perfect tool to create and share your milestone chart. Get started by selecting this milestone chart template. Use our simple template to visually track the smaller steps within a large project. For each milestone, we’ve pre-populated the template with several columns; as well as rows to track deadlines, steps, and deliverables. Then, customize the template to fit the needs of your particular project.
Step 3: Track each major milestone as a column
In our milestone chart template, each column is for a unique milestone. Once created, you can customize the milestone chart by adding as many columns for unique milestones as you need to. Remember, be careful to distinguish between major milestones and minor tasks. The number of milestones you chose to track will vary by project type and size, but it’s generally helpful to isolate only the most important milestones.
Step 4: Define dates, steps, and deliverables
The first row of a milestone chart is dedicated to displaying the date or dates that the particular milestone is expected to be completed. These can be specific dates, or time ranges depending on your need.
The second row of the milestone chart is for the high-level steps that need to be completed in order for the milestone to be reached. These don’t need to be very granular to avoid cluttering the chart.
The third row of the milestone chart is for specific deliverables. Ideally, these deliverables will be used to measure whether or not the milestone has been reached. Take the time to make sure these deliverables account for all major indicators of your milestone completion.
Step 5: Customize and track
Milestone charts are by design customizable for the specific project's needs. As a project progresses, you may find the need to make changes to accommodate for unforeseen problems. Keep track of each milestone’s progress, and make sure to collaborate regularly with your team on new developments.
What is the typical format of a Milestone Chart?
Track each project milestone, both on a visual timeline and on a static chart, with this detailed project milestone template. Identify who is assigned to each task, the status of each task, and any comments that accompany those tasks. Use the status key to see which tasks have yet to be started, which are on hold, and which are in progress.
How do you use a milestone chart?
Map out your project and each individual task across a predetermined timeline with this project timeline with milestones template. Show each task across a certain timeline, such as by month, quarter, or year, so you can get an accurate portrayal of the work left to be completed. Point out specific milestones that your team needs to hit in order to maintain the project timeline.
Get started with this template right now.
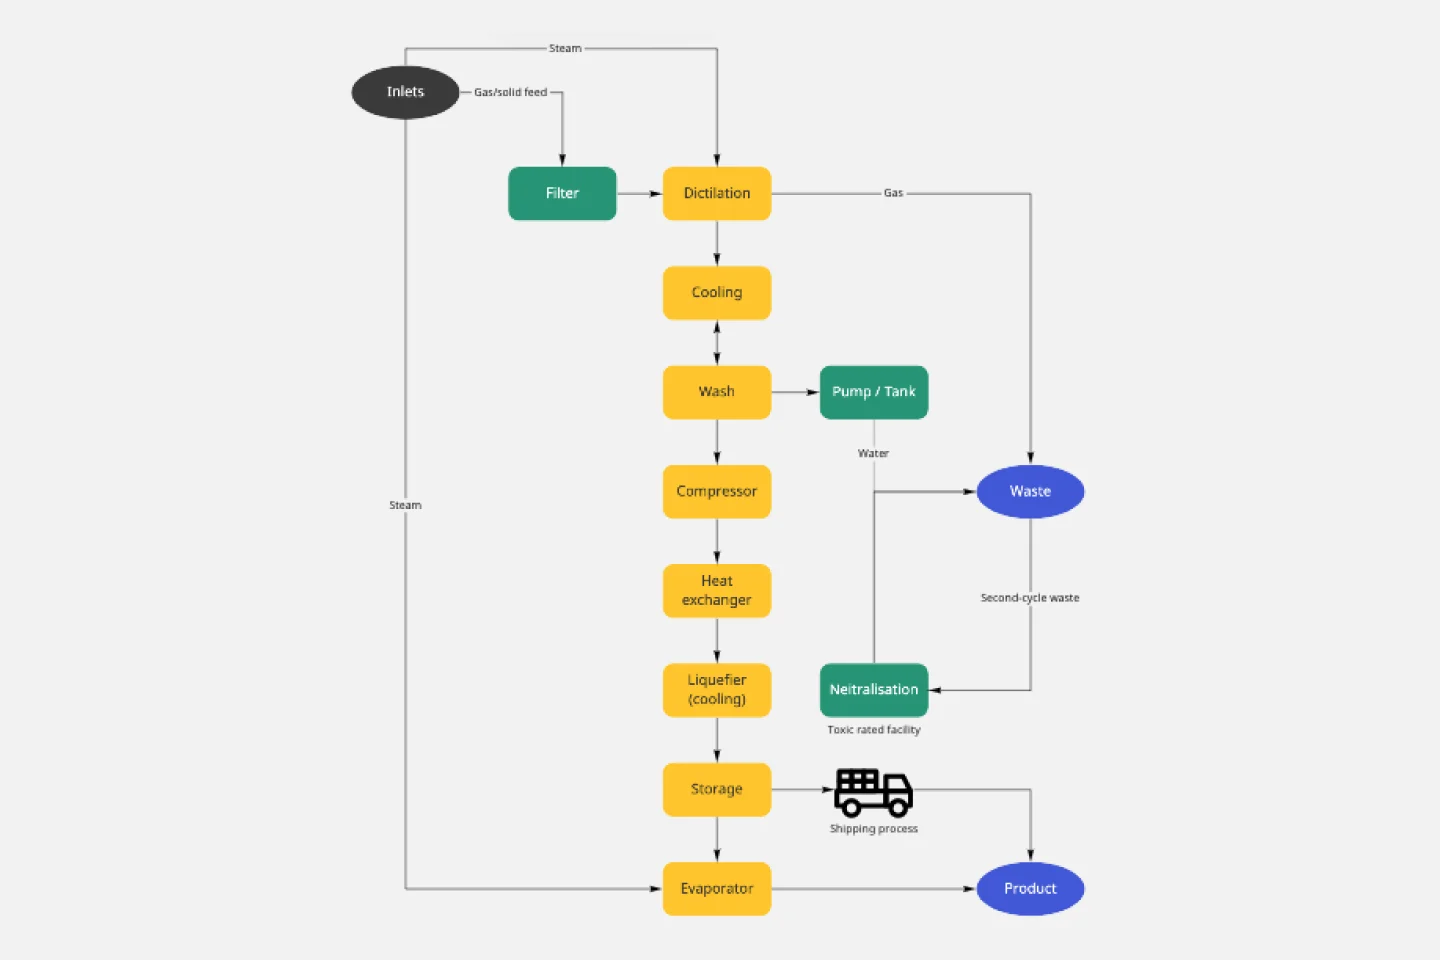
Block Diagram Template
Works best for:
Mapping, Software Development, Diagrams
Use this template to illustrate technical systems. Blocks represent important objects in the system, and arrows demonstrate how the objects relate to each other. Perfect for engineers, workflow managers, or anyone trying to build a better process.
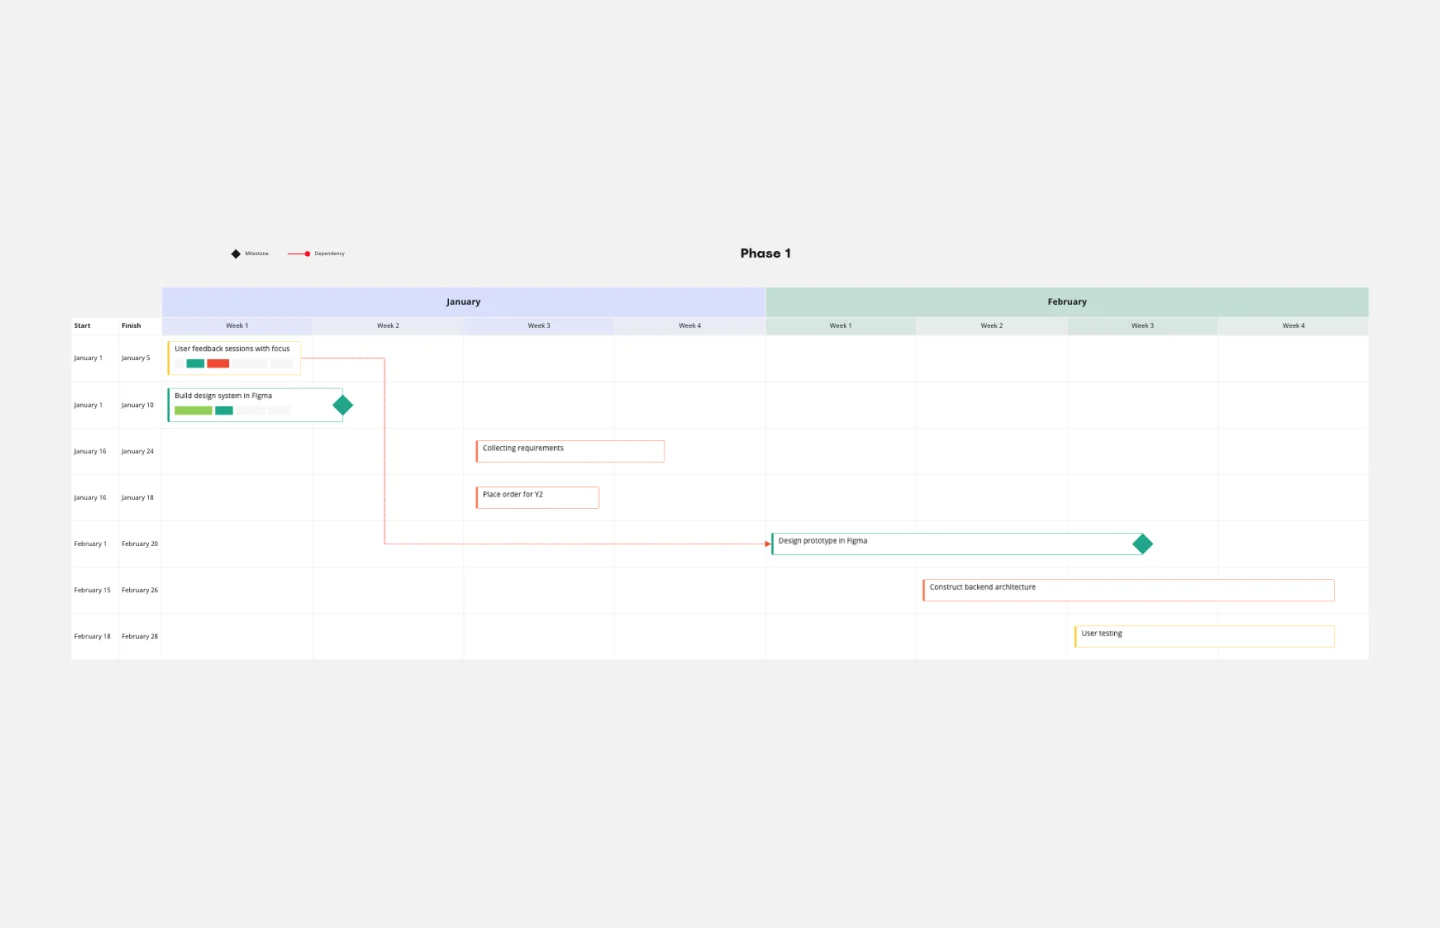
Gantt Chart Template
Works best for:
Project Management, Mapping, Roadmaps
Simplicity, clarity, and power — that’s what make Gantt charts such a popular choice for organizing and displaying a project plan. Built upon a horizontal bar that represents the project progress over time, these charts break down projects by task, allowing the whole team to see the task status, who it’s assigned to, and how long it will take to complete. Gantt charts are also easily shareable among team members and stakeholders, making them great tools for collaboration.
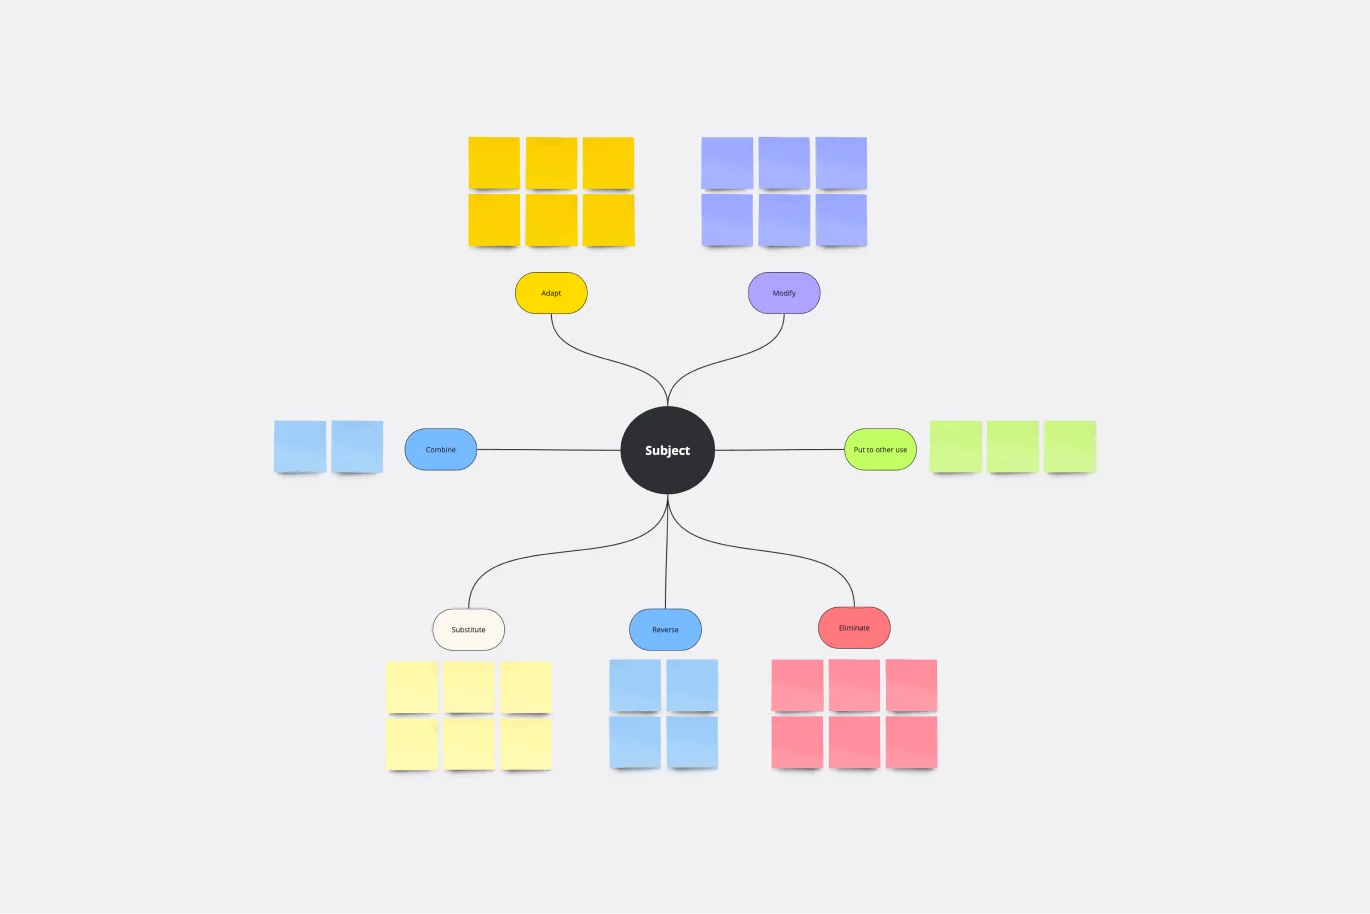
SCAMPER Model
Works best for:
Ideation, Operations, Brainstorming
Is your team in a rut? Have you had a lingering problem that can’t seem to be solved? First introduced in 1972, SCAMPER. is a brainstorming method developed by Bob Eberle, an author of creativity books for young people. This clever, easy-to-use method helps teams overcome creative roadblocks. SCAMPER walks you through seven questions that are meant to encourage your team to approach a problem through seven unique filters. By asking your team to think through a problem using this framework, you’ll unlock fresh, innovative ways to understand the problem you’re trying to solve.
Product Positioning Template
Works best for:
Marketing, Product Management, Desk Research
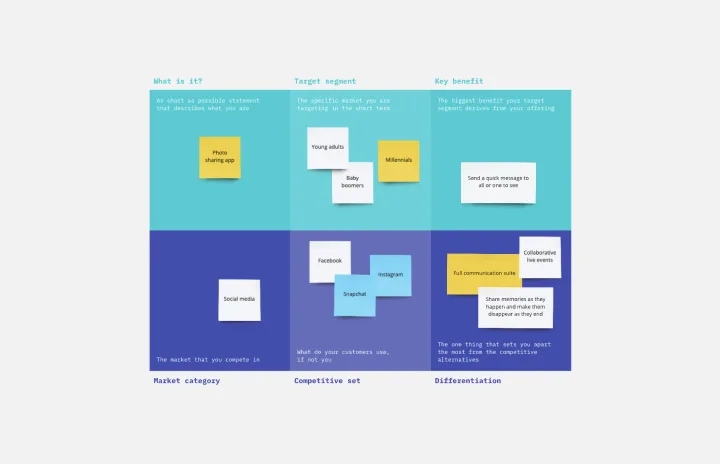
For better or for worse, your company’s chances for success hinge partially on your market. As such, before you start building products and planning strategies, it’s a good idea to conduct a product positioning exercise. A product positioning exercise is designed to situate your company and your offering within a market. The product positioning template guides you to consider key topics such as defining your product and market category, identifying your target segment and competitors, and understanding your key benefits and differentiation.
Agenda Template
Works best for:
Project Management, Meetings, Workshops
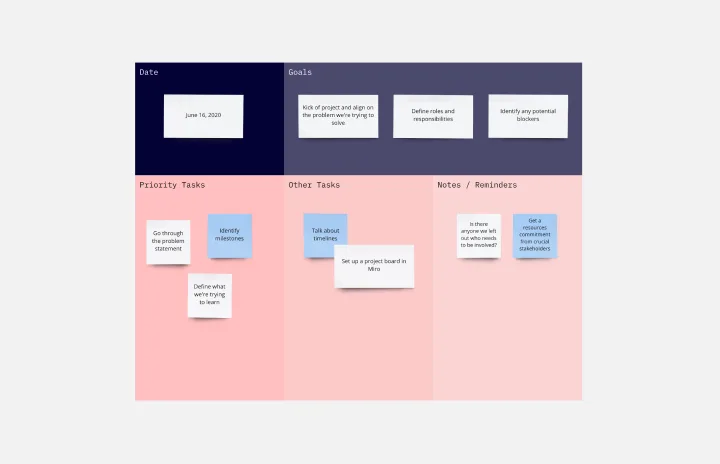
Even when you’ve hosted meetings for years, hosting them online is different. Keeping them structured, purposeful, and on-task is key. That all starts with having a detailed agenda, and this template makes it so easy for you to create one.
One Pager Template
Works best for:
Project Management
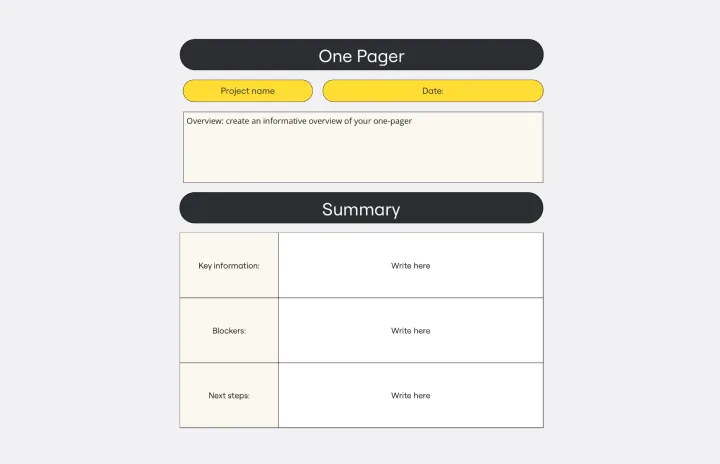
One-page project summaries are essential tools for synthesizing complex information into a clear and concise format. They offer significant benefits by enhancing team alignment. By distilling the core elements of a project or idea onto a single page, these summaries facilitate a shared understanding among team members and stakeholders. This shared understanding is crucial, especially in fast-paced environments where clarity and quick comprehension of key project aspects can dramatically improve decision-making and coordination. The structured yet flexible design of these summaries allows teams to focus on what truly matters, reducing miscommunication and increasing the efficiency of project execution.