Current State vs. Future State Flowchart Template
Strategically allocate tasks, visualize process changes, and identify bottlenecks with the current state vs. future state flowchart template.
Trusted by 65M+ users and leading companies


About the Current State vs. Future State Flowchart Template
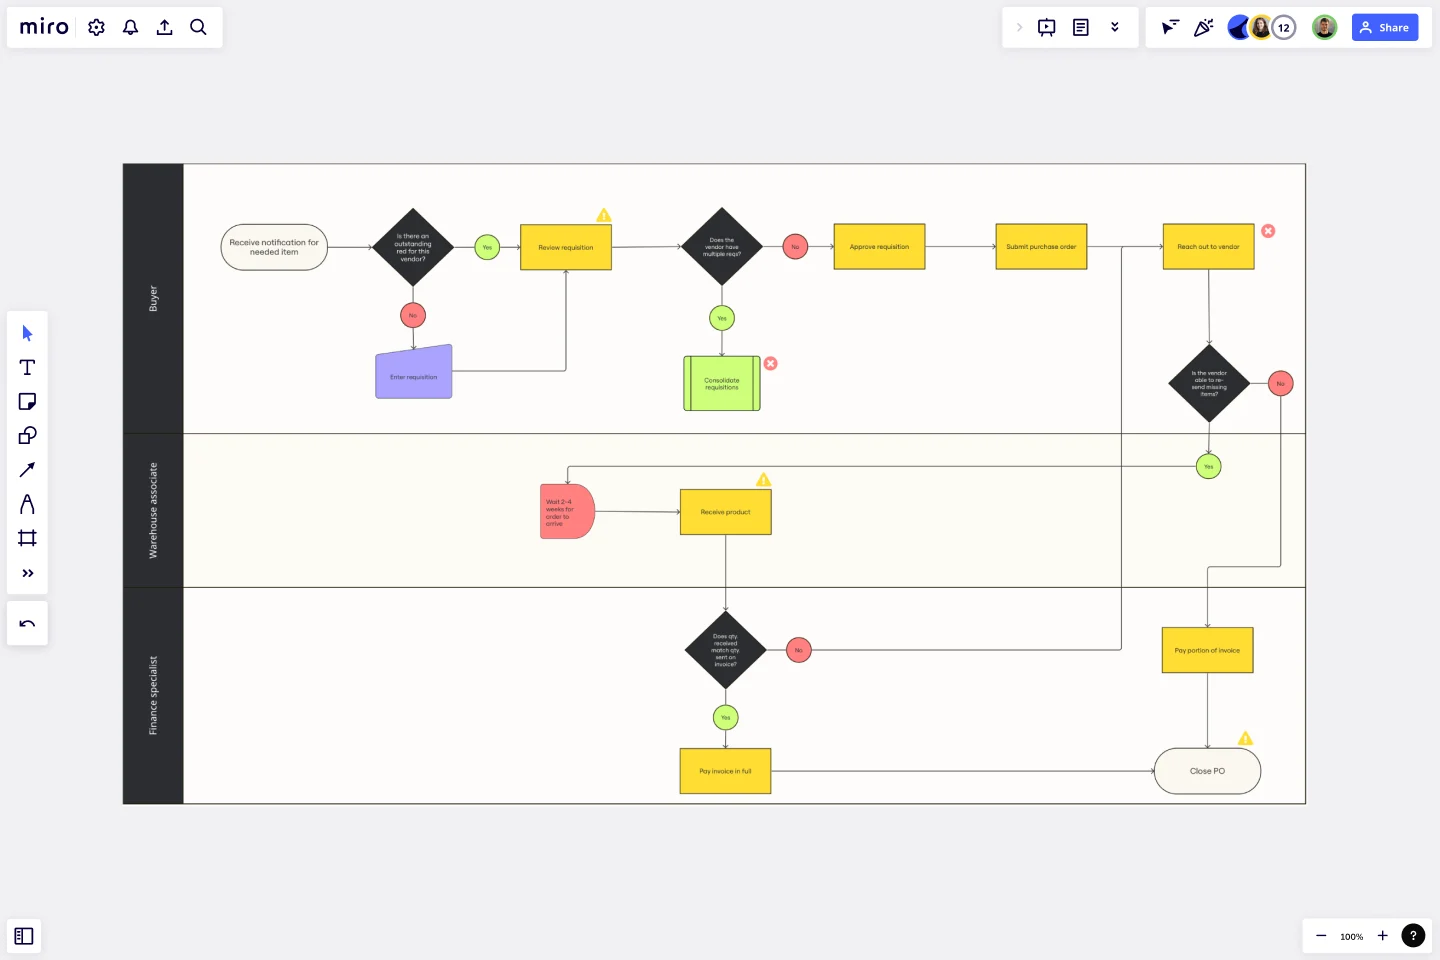
The Current State vs Future State Flowchart Template is essential for teams facing complex processes. This powerful asset provides clarity and structure to workflows, employing swimlanes to clarify departmental responsibilities and layers to offer a nuanced view of process changes. With its strategic guidance, teams can identify and address bottlenecks with precision, empowering them to navigate their transformational journey with confidence and ease. Don't let complex processes slow you down - use the Current State vs Future State Flowchart Template to take control.
Understanding the template
The Current State vs Future State Flowchart Template is designed to allocate tasks to respective departments using swimlanes, which helps to define roles and responsibilities clearly. The template also has layers that allow for dynamic representation of changes between the current and future states. This tool goes beyond just visualizing the process, as it can help teams identify bottlenecks and improve efficiency by streamlining workflows.
How to use the current state vs. future state flowchart template in Miro
Optimize task allocation with swimlanes: Use swimlanes to assign tasks to specific departments, fostering transparency in responsibilities and facilitating streamlined communication.
Enhance visualization with layers: Leverage layers to dynamically represent changes between current and future processes, offering a detailed and adaptable perspective on the transformation journey.
Proactively address bottlenecks: Analyze the flowchart to identify bottlenecks, providing teams with actionable insights to address challenges and optimize workflow efficiency proactively.
Why should you use a current state vs. future state flowchart template?
Precision with swimlanes: Clearly understand and communicate which department is responsible for each task, ensuring accountability and clarity within the team.
Nuanced process visualization: Employ layers to visualize complex changes between current and future processes, offering a comprehensive and adaptable representation of the transformational journey.
Identify bottlenecks: The template serves as a strategic tool, enabling teams to address challenges and optimize workflow efficiency strategically.
Transparent communication: Use swimlanes to precisely define responsibilities, promoting transparent communication and alignment on tasks and objectives.
Efficiency optimization: Pinpointing bottlenecks empowers teams to optimize workflows, enhancing overall efficiency and effectiveness.
If you'd prefer to start from scratch, flowcharting with Miro is easy! You can choose from a wide range of flowchart shapes in Miro's extensive library, so you'll find just what you need.
Can I export the flowchart for external use or presentations?
Miro provides export options, allowing you to save your flowchart as an image or PDF for external sharing or adding to presentations.
Are there any pre-built templates for specific industries or processes?
While the Current State vs Future State Flowchart Template provides a versatile framework, Miro also offers industry-specific templates that can be customized to meet your unique needs.
Get started with this template right now.

Login Sequence Diagram Template
Works best for:
Diagramming, Technical Diagramming
The UML Sequence Login Diagram Template is a valuable tool for visualizing user authentication processes. It breaks down complex login sequences into clear, visual components, facilitating collaborative understanding among team members, regardless of their technical expertise. This shared understanding is crucial for ensuring all stakeholders, from developers to project managers, are on the same page, leading to efficient decision-making and a smoother development process. The template's ability to translate technical details into an accessible format streamlines communication and significantly reduces the likelihood of misinterpretation or oversight, making it an essential asset in any software development project.
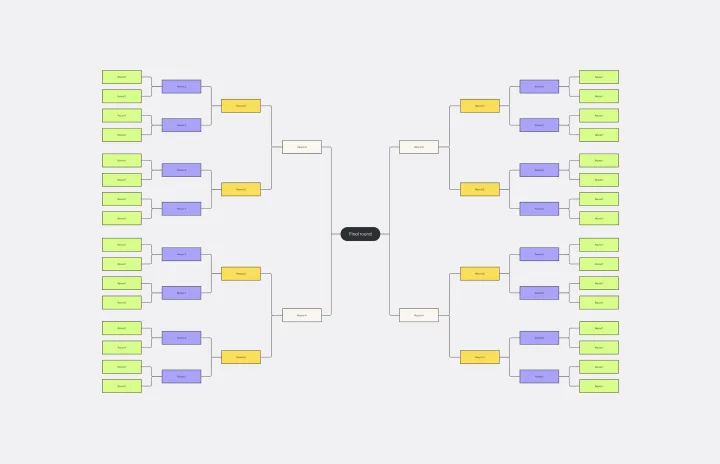
Bracket Template
Works best for:
Diagramming
The Bracket Template is a dynamic visualization tool that helps to organize and rank ideas, entities, or teams in a sequential and competitive manner. It is structured like a tree, starting with multiple entries on either side, which then face off in successive rounds, leading to a single winner or conclusion. One of its standout benefits is its ability to simplify complex decision-making processes. Breaking down choices into smaller, head-to-head comparisons, makes the path to a final decision clearer, ensuring clarity and fostering engagement among participants. Moreover, the Bracket Template is particularly useful when there are multiple options to consider and when there is a need to compare and contrast those options. It is an effective way to streamline decision-making, making it easier and more efficient.
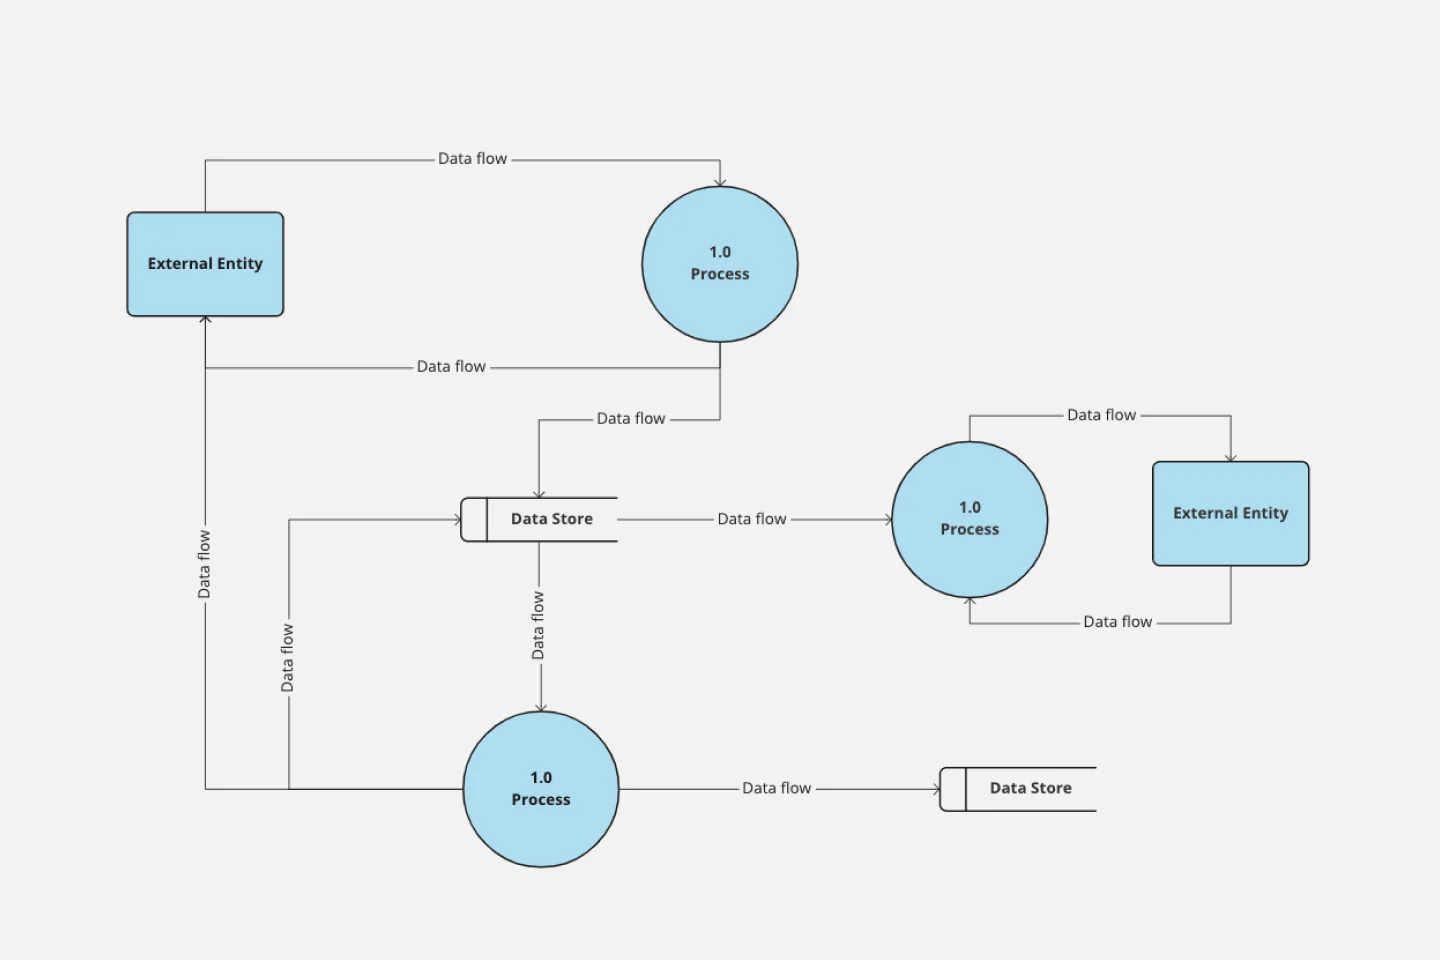
Data Flow Diagram Template
Works best for:
Flowcharts, Software Development, Diagrams
Any process can get pretty complex, especially when it has multiple components. Get a better grasp of your process through a data flow diagram (DFD). DFDs create a simple visual representation of all components in the flow of data and requirements in an entire system. They’re most often used by growth teams, data analysts, and product teams, and they’re created with one of three levels of complexity—0, 1, or 2. This template will help you easily build the best DFD for your process.
Lotus Diagram Template
Works best for:
UX Design, Ideation, Diagrams
Even creative thinkers occasionally need help getting their creative juices flowing. That's where a lotus diagram comes in. It'll empower you to run smoother, more effective brainstorming sessions. This creative-thinking technique explores ideas by putting the main idea at the diagram center and ancillary concepts in the surrounding boxes. This template gives you an easy way to create Lotus Diagrams for brainstorms, as well as an infinite canvas for the endless ideas generated.
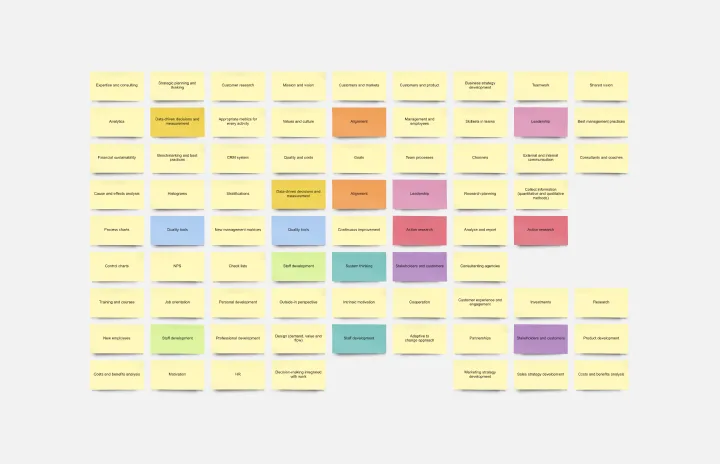
Stakeholder Mapping Template
Works best for:
Business Management, Mapping, Workflows
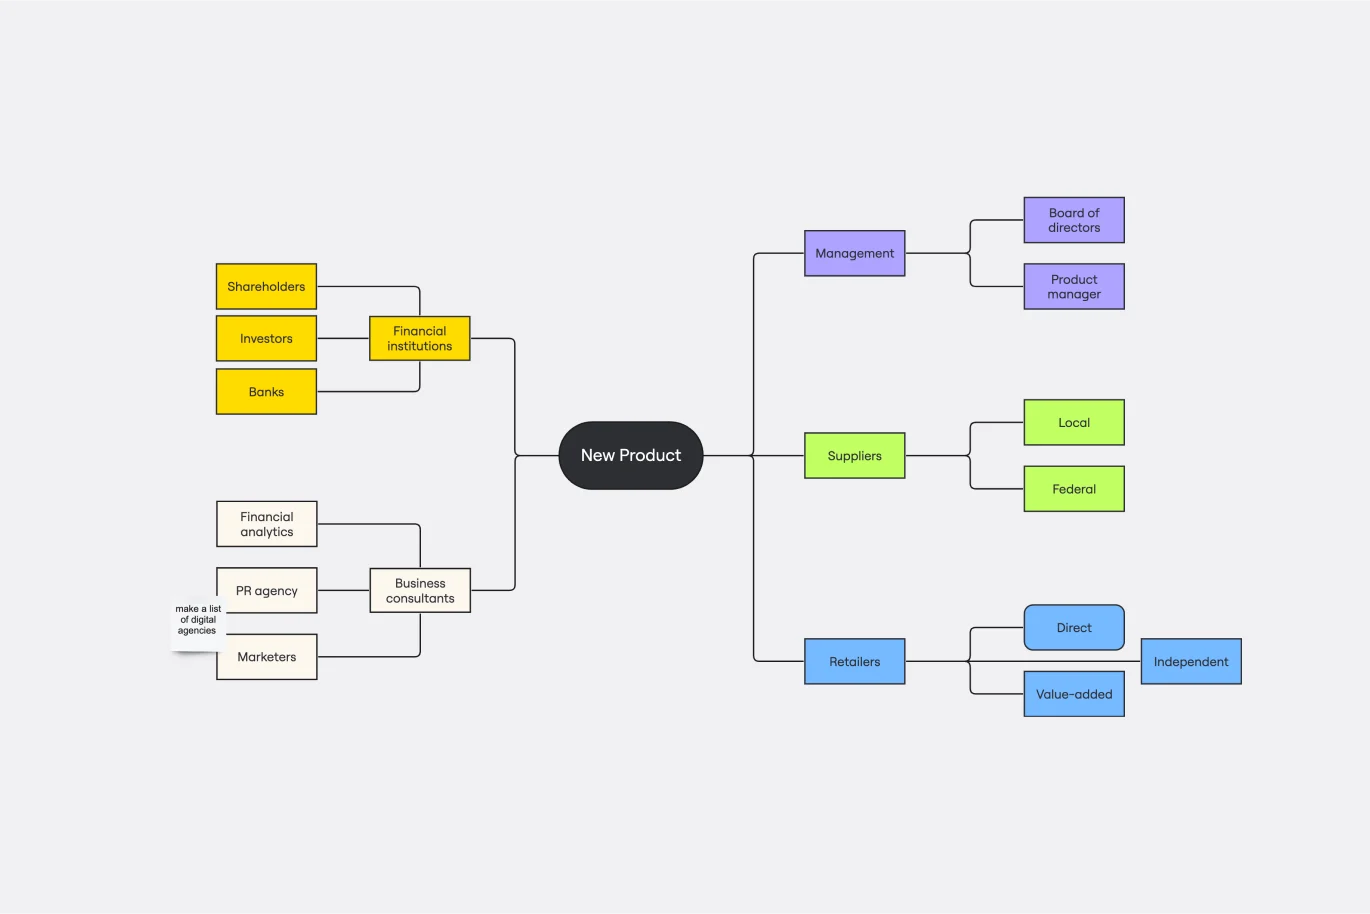
A stakeholder map is a type of analysis that allows you to group people by their power and interest. Use this template to organize all of the people who have an interest in your product, project, or idea in a single visual space. This allows you to easily see who can influence your project, and how each person is related to the other. Widely used in project management, stakeholder mapping is typically performed at the beginning of a project. Doing stakeholder mapping early on will help prevent miscommunication, ensure all groups are aligned on the objectives and set expectations about outcomes and results.
Cluster Diagram Template
Works best for:
Diagramming
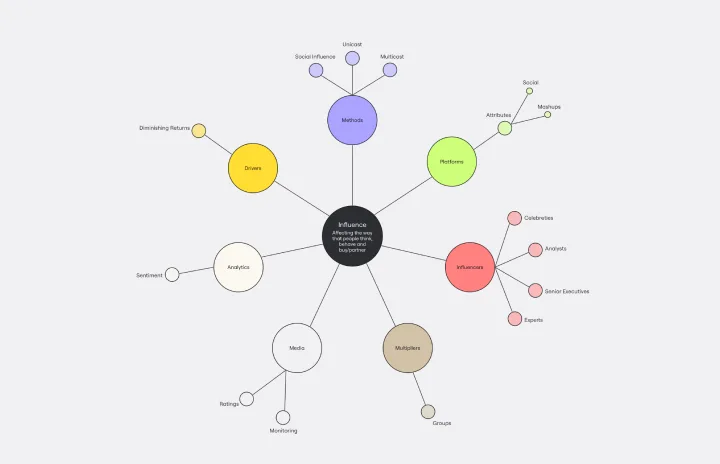
The Cluster Diagram Template is a valuable tool for organizing and connecting ideas, concepts, and information in a visually compelling and coherent manner. The template's design centers on grouping related ideas around a core concept, creating a transparent and hierarchical structure. This clustering not only aids in breaking down complex information into manageable segments but also significantly enhances the process of idea generation and brainstorming. A structured yet flexible visual framework encourages deeper engagement and more precise understanding, making it an essential asset for teams and people looking to bring order to their creative and analytical processes. I have checked the text for any potential spelling, grammar, and punctuation errors, and it's good to go.