Strategic Group Mapping Template
Easily define your competitive landscape using the Strategic Group Mapping Template. From understanding your product position to analyzing competitors, this template empowers anyone to visualize market competition seamlessly.
Trusted by 65M+ users and leading companies


About the Strategic Group Mapping Template
We know that in the complex landscape of business strategy, it's crucial to have tools that can simplify our processes and offer clarity. Enter Miro's Strategic Group Mapping Template - designed to help you visually represent the competitive positions of different companies or products in your market.
What's a Strategic Group Mapping Template?
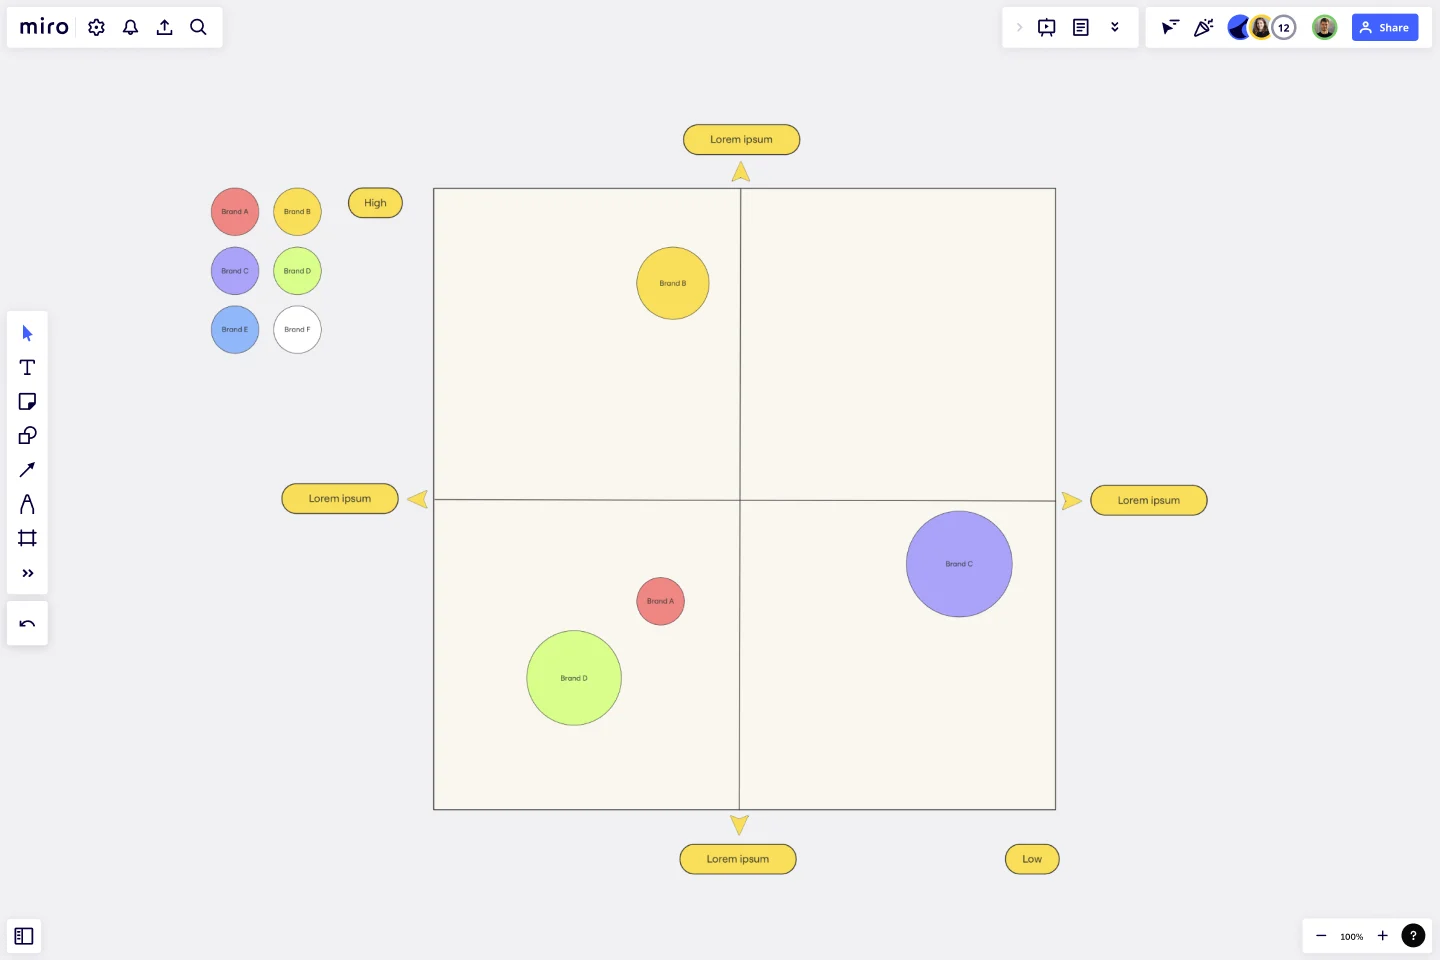
A Strategic Group Mapping Template is a visual tool that helps you plot out the competitive position of various entities within a market based on specific criteria. You can gain insights into market positions, potential market spaces, and competition intensity by placing competitors into different strategic groups based on key dimensions such as price range or product quality.
What are the benefits of using a Strategic Group Mapping Template?
Visual representation: By mapping competitors on a visual workspace, businesses can quickly identify clusters of similar competitors and gaps in the market.
Informed decision-making: It provides a clearer picture of where your business stands, aiding in more strategic decisions regarding market entry or product development.
Facilitates collaboration: As a shared template, teams can collaborate in real time, brainstorming and drawing insights together.
Enhances competitive analysis: Enables companies to identify potential threats or opportunities by visualizing where competitors are clustered and where market spaces are less dense.
How to use a Strategic Group Mapping Template in Miro?
Miro is flexible and interactive, making it a perfect place for strategic mapping. Here's how you can create one:
Open a new board: Select the Strategic Group Mapping Template in the Templates Library.
Use shapes: Edit the shapes on the template, or add more from Miro's shapes library. For your X and Y axis criteria, you can use lines and label them appropriately. Drag circles, rectangles, or other shapes to represent different companies or products.
Customize and position: Adjust the size, colors, and positions of shapes based on the relative position of competitors. The drag-and-drop feature ensures ease of positioning.
Collaborate: Invite team members to join your board and input their insights, ensuring a comprehensive mapping.
What criteria should I use for the axes on the map?
It varies by industry and what you're analyzing. Common criteria include price, quality, market share, product range, and geographical coverage.
How often should I update my strategic group map?
It's essential to update your map periodically, especially when there are significant market changes, new entrants, or shifts in competitor strategies.
Can multiple team members edit the map simultaneously?
Yes, Miro allows real-time collaboration, so multiple members can edit, comment, and brainstorm together on the same map.
Get started with this template right now.
Service Blueprinting Workshop
Works best for:
Agile
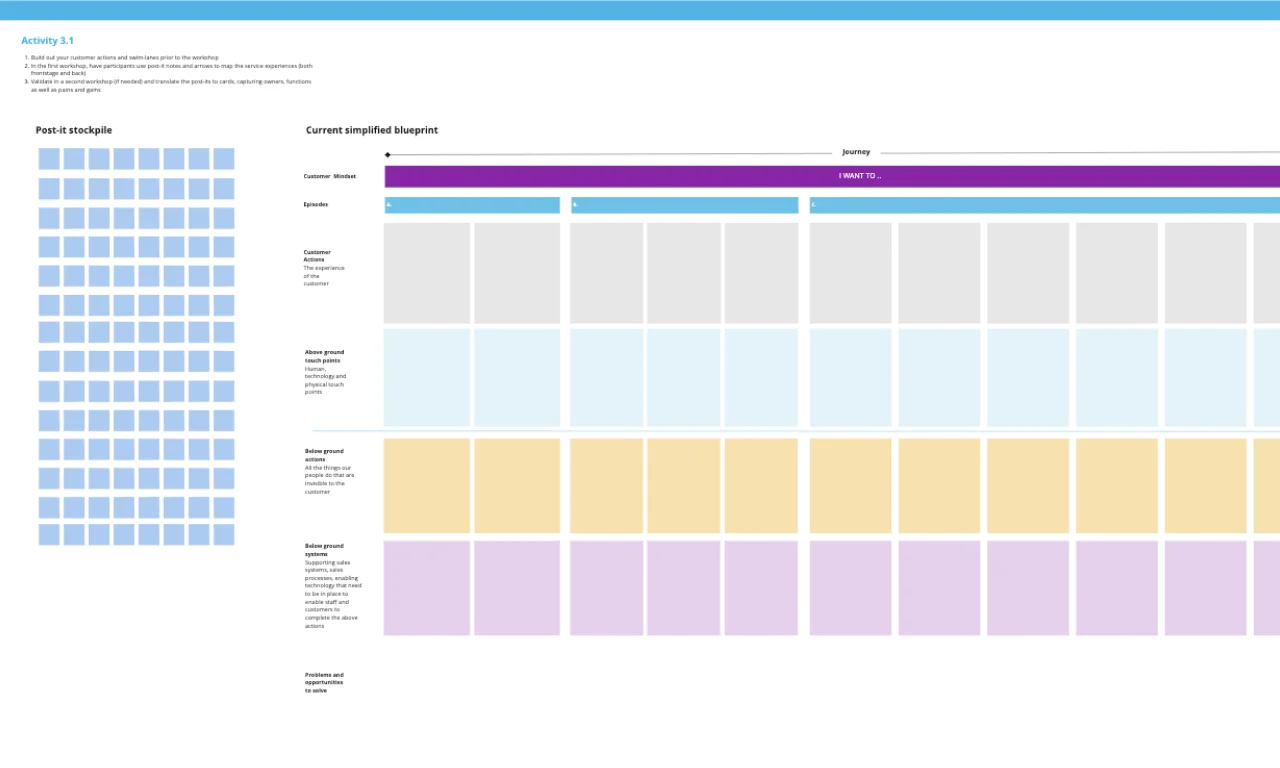
The Service Blueprinting Workshop template facilitates collaborative sessions for designing and optimizing service experiences. It provides a structured framework for mapping customer journeys, identifying pain points, and aligning internal processes. By visualizing the entire service ecosystem, teams can uncover opportunities for innovation and improvement, empowering organizations to deliver exceptional customer experiences. Whether you're designing new services or enhancing existing ones, this template enables cross-functional teams to co-create and innovate, driving sustainable growth and competitive advantage.
Sitemap Template
Works best for:
Mapping, Software Development, Diagrams
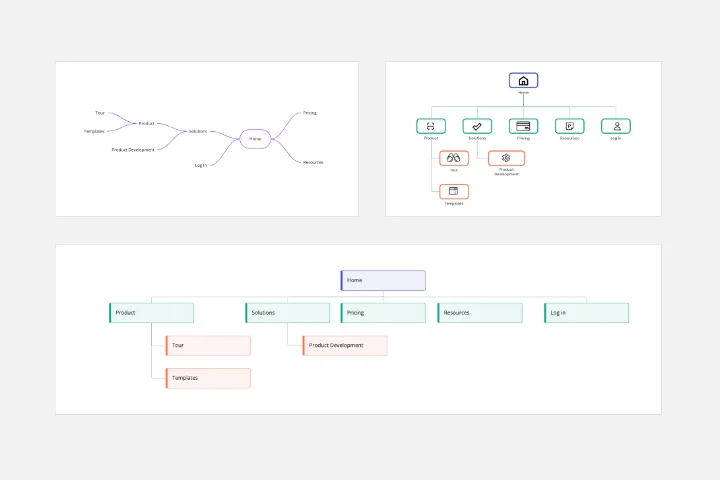
Building a website is a complex task. Numerous stakeholders come together to create pages, write content, design elements, and build a website architecture that serves a target audience. A sitemap is an effective tool for simplifying the website design process. It allows you to take stock of the content and design elements you plan to include on your site. By visualizing your site, you can structure and build each component in a way that makes sense for your audience.
Flowchart Template
Works best for:
Flowcharts, Mapping, Diagrams
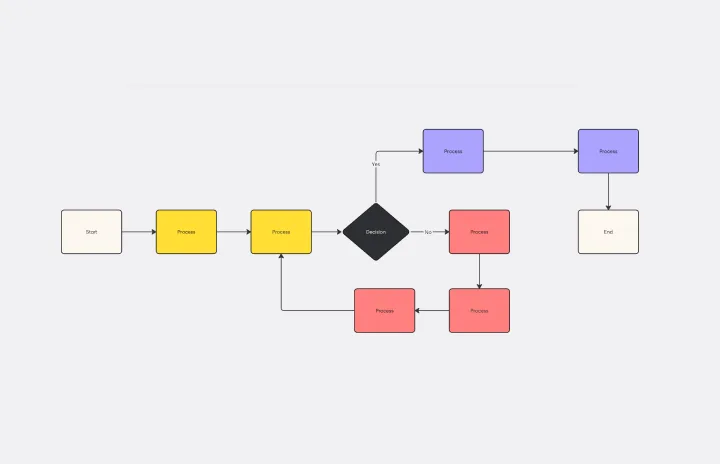
Trying to explain a process or workflow to your team — or just wrap your head around it yourself? Sometimes the best way is to see it, and that’s when you create a flowchart. Using common shapes (generally just ovals, rectangles, diamonds, and arrows), a flowchart shows you the direction a process or workflow goes and the order of steps. Beyond giving you a clear understanding, you’ll also be able to see potential flaws and bottlenecks, which helps you refine and improve your process and create a better product more efficiently.
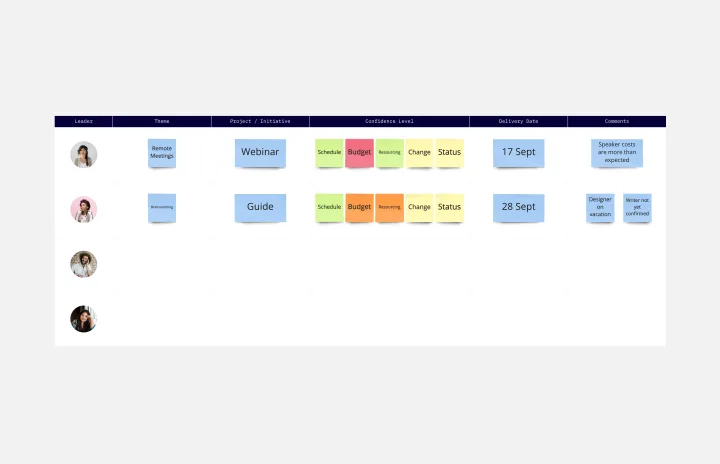
Status Report Template
Works best for:
Project Management, Documentation, Strategic Planning
A status report provides a snapshot of how something is going at a given time. You can provide a status report for a project, a team, or a situation, as long as it emphasizes and maps out a project’s chain of events. If you’re a project manager, you can use this report to keep historical records of project timelines. Ideally, any project stakeholder should be able to look at a status report and answer the question, “Where are we, and how did we get here?” Use this template as a starting point to summarize how something is progressing against a projected plan or outcome.
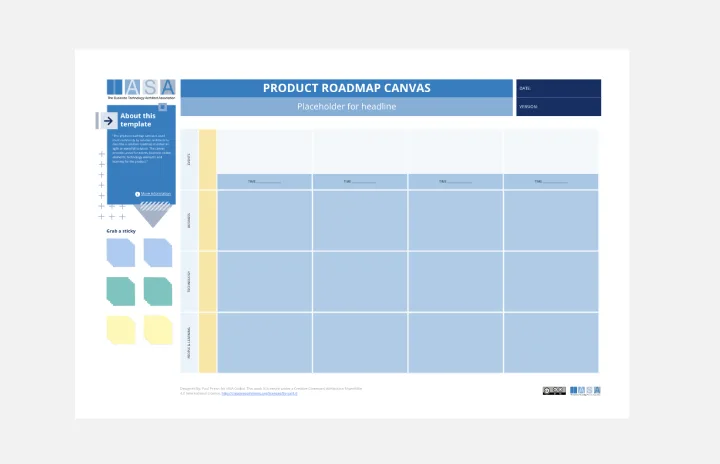
Product Roadmap Canvas Template
Works best for:
Roadmap, Mapping, Planning
The IASA - Product Roadmap Canvas template offers a holistic view of product development by integrating key elements such as customer needs, business goals, and technology requirements. By utilizing this canvas, teams can align their product strategy with market demands and ensure that development efforts are focused on delivering maximum value to customers.
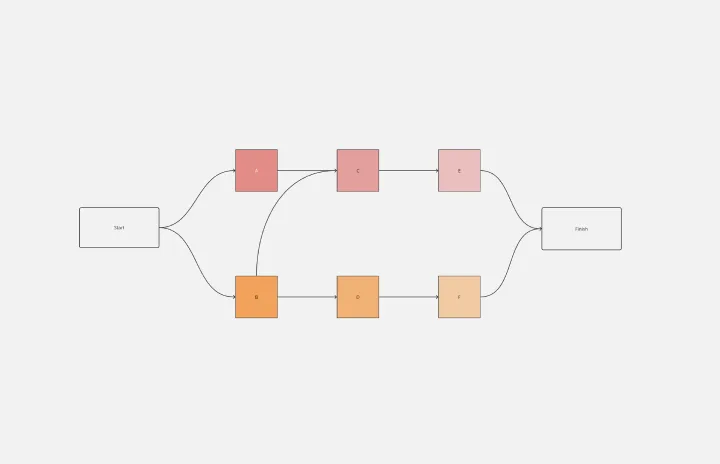
Precedence Diagram
Works best for:
Diagramming, Mapping
The Precedence Diagram Template offers a visual tool that maps out project activities and their interrelated sequences. This diagram empowers teams to recognize and anticipate workflow structures by illustrating the connections and dependencies among tasks.