Onion Diagram Template
Discover the power and precision of the Onion Diagram Template. Visualize the components of a specific concept, system, or process and clarify their hierarchy and importance.
Trusted by 65M+ users and leading companies


About the Onion Diagram Template
At Miro, we always look for innovative ways to visually represent complex ideas, making collaboration more intuitive and productive. Our Onion Diagram Template is yet another tool in our suite designed to help you streamline your processes and achieve clarity in your projects.
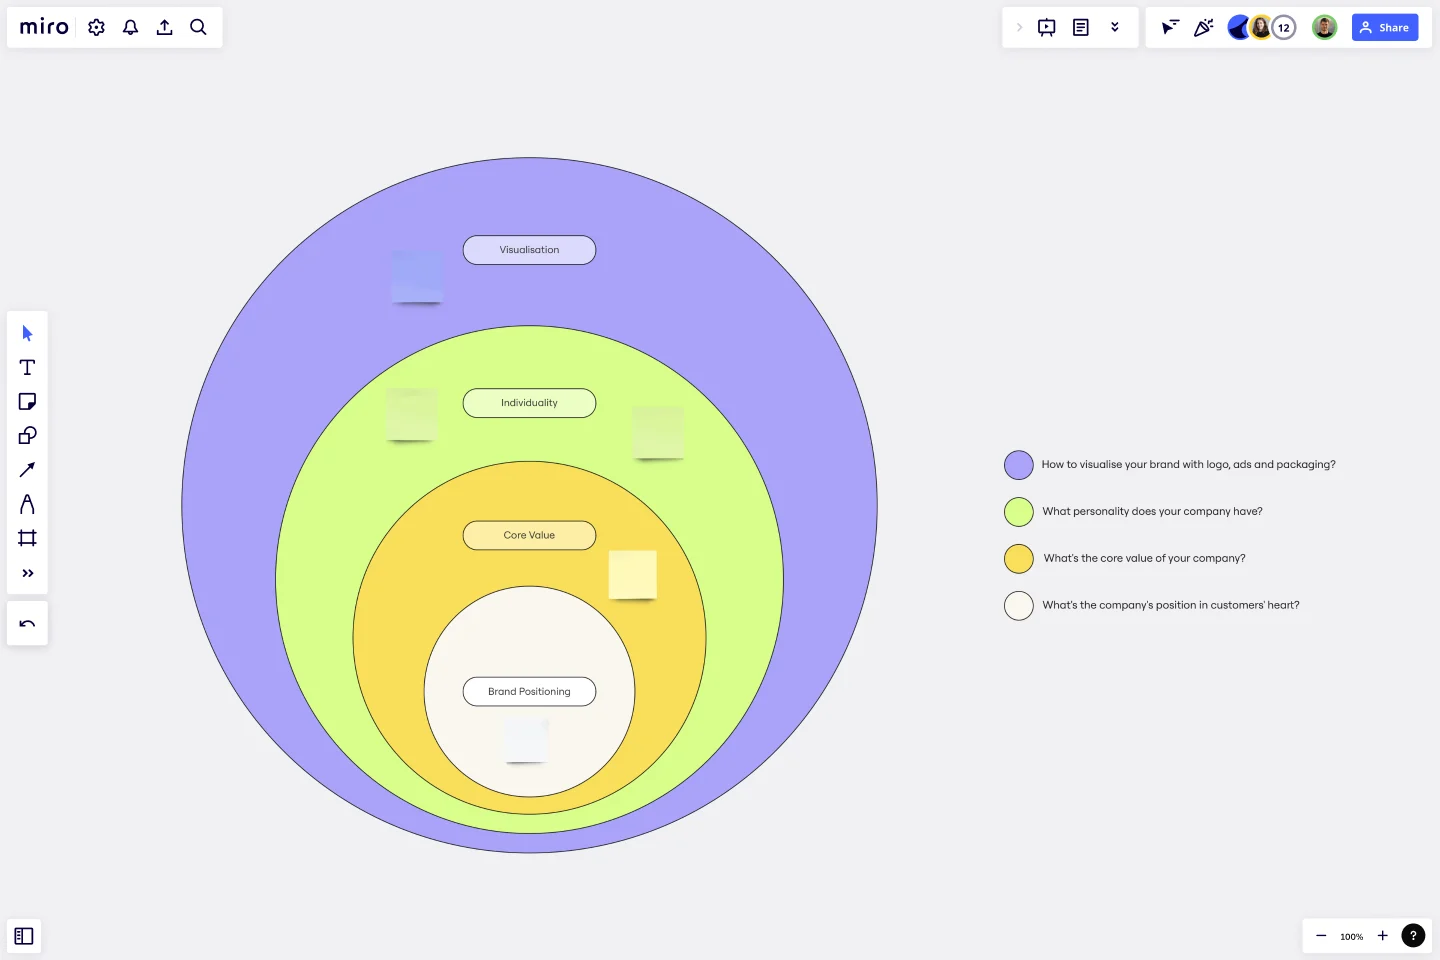
What's an Onion Diagram Template?
An onion diagram is a type of diagram that showcases layers of a concept, system, or process, much like the layers of an actual onion. Each layer of the diagram represents a different aspect or phase, starting from the innermost core and moving outwards to the outer layers. This structure allows viewers to understand relationships, hierarchies, or sequences in a visual, layered format.
What are the benefits of using an Onion Diagram Template?
Hierarchical visualization: Clearly see the priority or sequence of different elements in a process or system.
Easy analysis: Quickly identify bottlenecks, dependencies, or relationships between layers.
Universal usage: Suitable for various industries, including IT, business analysis, and education.
Enhanced collaboration: Team members can collectively analyze and change diagrams in real time.
How to use an Onion Diagram Template in Miro?
Using the Onion Diagram Template in Miro is straightforward:
Select the template: Go to Miro's Template Library and select the Onion Diagram Template.
Explore automated diagramming: Miro has automated diagramming features. Use our ready-made template and edit data as you see fit, or create an onion diagram from scratch using our shapes library. As you create your diagram, it can auto-adjust, making it easier to visualize complex layers.
Customize your diagram: Drag and drop elements, change colors, or add sticky notes to suit your specific needs.
Save and share: Once your onion diagram is complete, share the board link with team members for collaborative viewing and editing.
How many layers can I add to my onion diagram?
There's no strict limit to the number of layers. However, for clarity and usability, it's best to limit the layers to a number that's easily digestible for viewers.
Can I use the Onion Diagram Template on mobile devices?
Yes, Miro's platform is optimized for both desktop and mobile use, ensuring seamless collaboration regardless of the device.
Are there preset color schemes available for the onion diagram?
Yes, Miro provides a range of color palettes. You can also customize colors to align with your branding or preference.
Get started with this template right now.

Production Flowchart Template
Works best for:
Flowcharts
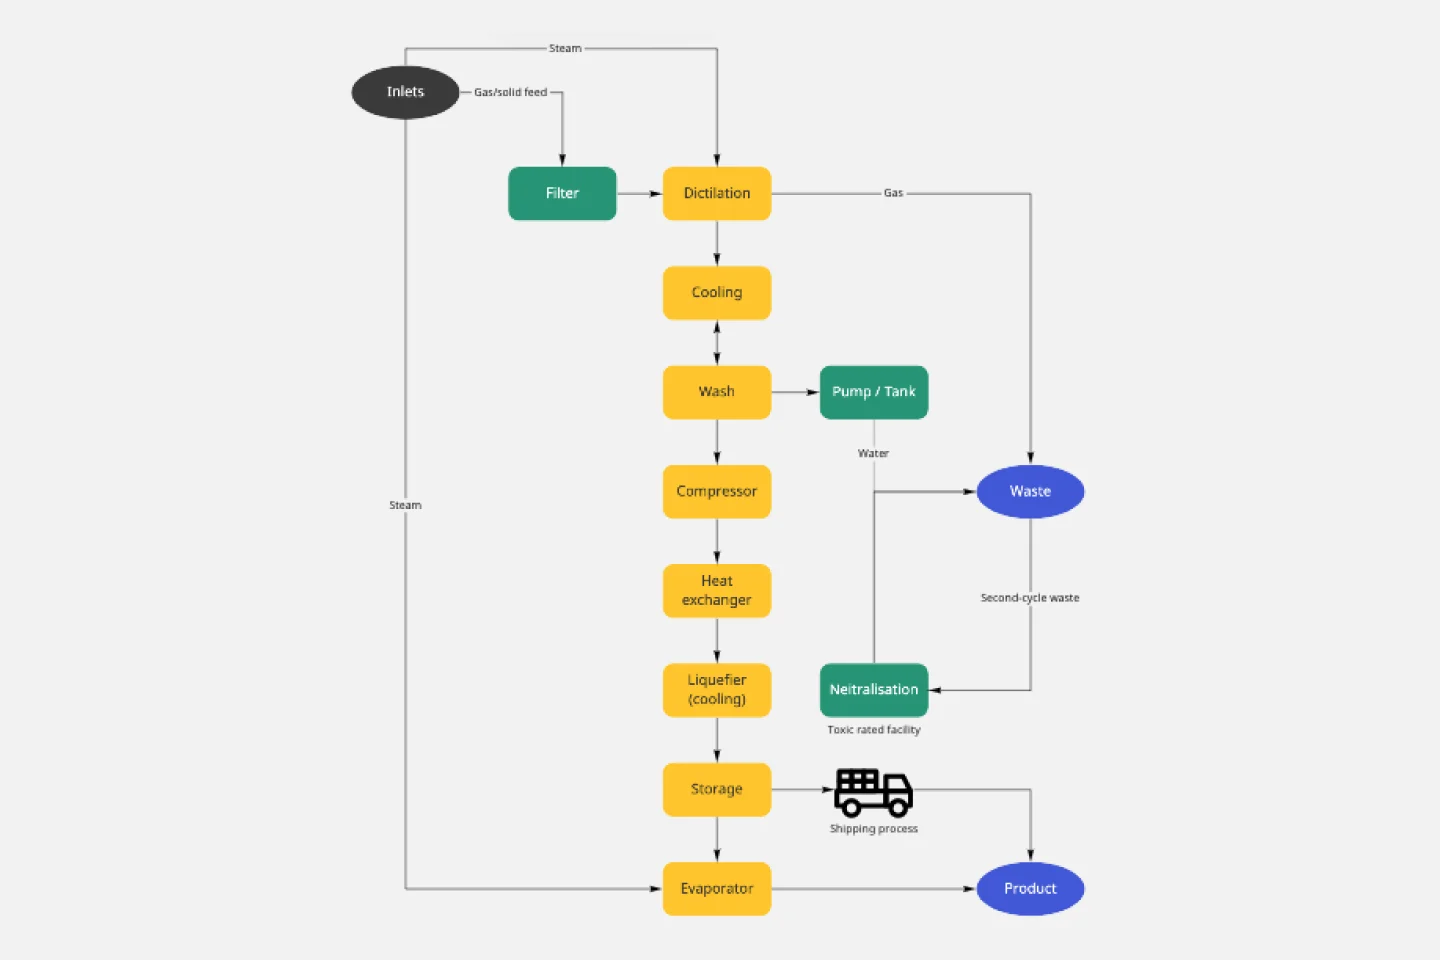
The Production Flowchart Template is a well-crafted tool that clearly represents a production process from start to finish. It breaks down complex procedures into easy-to-understand segments, making it easier for stakeholders to grasp the entire process. One of the key benefits of using this template is that it helps to clarify complex production pathways. By mapping out operations visually, teams can identify potential bottlenecks or inefficiencies, facilitating timely and well-informed decision-making.
UML Diagram Template
Works best for:
Diagrams, Software Development
Originally used as a modeling language in software engineering, UML has become a popular approach to application structures and documenting software. UML stands for Unified Modeling Language, and you can use it to model business processes and workflows. Like flowcharts, UML diagrams can provide your organization with a standardized method of mapping out step-by-step processes. They allow your team to easily view the relationships between systems and tasks. UML diagrams are an effective tool that can help you bring new employees up to speed, create documentation, organize your workplace and team, and streamline your projects.
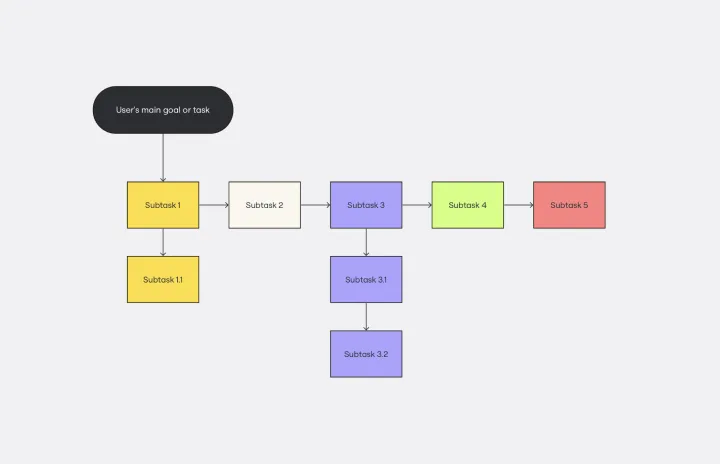
Task Analysis Diagram Template
Works best for:
Diagramming
The Task Analysis Diagram Template is a helpful tool that simplifies complex tasks by breaking them down into smaller, more manageable steps. This strategic approach brings clarity and ensures a systematic method for tackling complex user paths. The template's most significant advantage is its precision, as it maps out every detail of a task to guarantee that nothing is missed. This results in more efficient operations.
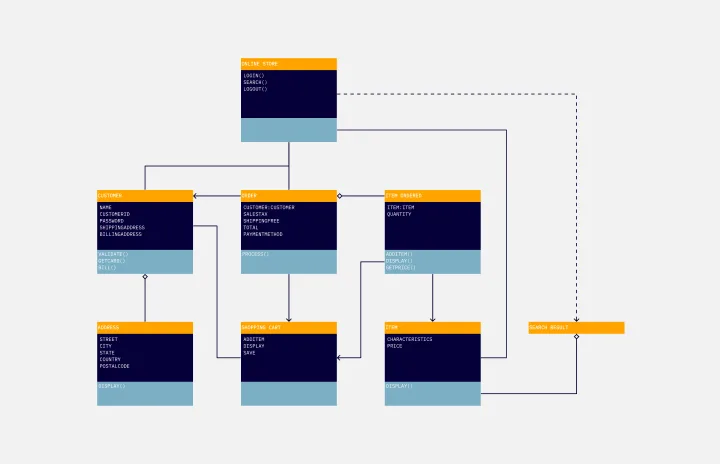
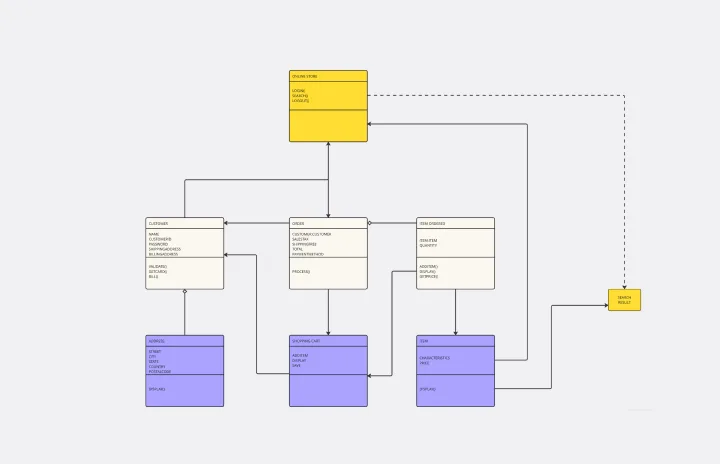
UML Class Diagram Template
Works best for:
UML Class Diagram Template, Mapping, Diagrams
Get a template for quickly building UML class diagrams in a collaborative environment. Use the UML class diagram template to design and refine conceptual systems, then let the same diagram guide your engineers as they write the code.
Block Diagram Template
Works best for:
Mapping, Software Development, Diagrams
Use this template to illustrate technical systems. Blocks represent important objects in the system, and arrows demonstrate how the objects relate to each other. Perfect for engineers, workflow managers, or anyone trying to build a better process.
Vertical Organizational Chart
Works best for:
Organizational Charts, Organizational Design
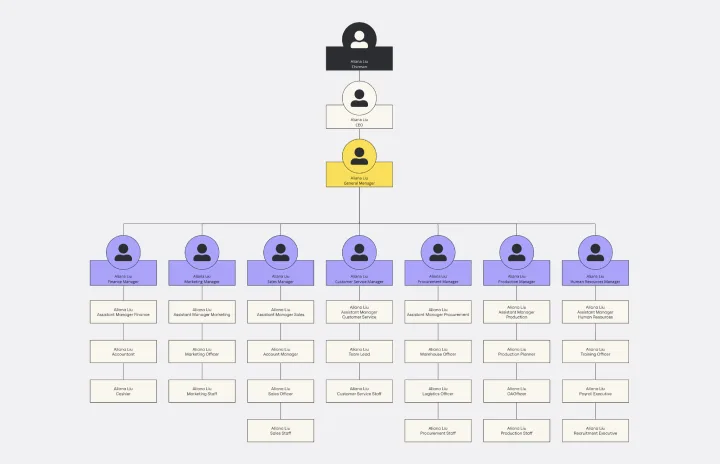
The Vertical Organizational Chart Template is an efficient way to illustrate the hierarchy of an entity in a top-down format. This tool helps represent roles and relationships in a clear manner, starting from the topmost authority and branching downwards. It allows for a better understanding of the flow of responsibilities and communication channels within the organization. One of its most significant advantages is promoting clear communication. Depicting the organization's structure helps avoid misunderstandings and ensures everyone is on the same page regarding the chain of command.