Fibonacci Scale Template
Estimate how much effort it takes to perform tasks and assign teams during a work sprint efficiently with the Fibonacci Scale Template.
Trusted by 65M+ users and leading companies


About the Fibonacci Scale Template
The Fibonacci scale is a series of numbers based on the Fibonacci sequence (0, 1, 2, 3, 5, 8, 13, 21, etc.). In the context of Agile, these numbers are used to estimate and agree upon the amount of effort required to complete a specific task. At the beginning of an Agile sprint, a team will discuss the various tasks that need to be completed and assign points to each task based on the Fibonacci scale.
What is the Fibonacci scale?
The Fibonacci sequence contains numbers that exhibit exponential growth, where each number is the sum of the two previous ones. That’s why Agile teams have come to use the Fibonacci scale for business because it’s easier to evaluate task efforts when you don’t have many numbers close to each other to choose from, as opposed to an even scoring scale. When managing a team, it’s often important to estimate how long it might take to complete a given task. More complex tasks are assigned more points, and smaller tasks are assigned fewer points. Managers can then review and prioritize tasks depending on their points. The Fibonacci scale is used to assign those point values.
How does the Fibonacci scale work?
The numbers in the Fibonacci scale are based on the Fibonacci sequence. In this sequence of numbers, each number is the summation of the two previous numbers. In the context of Scrum, the numbers represent the level of complexity and degree of difficulty involved in completing a task. For example, a task assigned “0” points would be very simple and quick to complete, a task assigned “1” point would be slightly more complex or time-consuming, and so on and so forth. Since the Scrum approach generally works in one-week sprints, it’s unlikely that many tasks will be assigned “21.”
Why use the Fibonacci scale?
The Fibonacci scale is a useful tool for a variety of reasons. For one, its growth is exponential. When estimating how long it might take to complete a task, estimating time for shorter tasks is much easier than estimating time for longer tasks. An exponential scale reflects that growing uncertainty. As you move up the scale, the numbers quickly become much larger.
Relatedly, the Fibonacci scale forces your team to make a choice. For example, when estimating time for a complex task, you ask, “is it an 8, 13, or 21?” and there is no in-between. This intuitive anchoring mechanism cuts down on debate and helps you make clear judgment calls.
Overall, the Fibonacci scale is a powerful method to ensure that work is distributed evenly and can help ensure that everyone is accurate when estimating the work and time involved in a project. If your team uses this approach on an ongoing basis, you will likely become more accurate and avoid overcommitting during each sprint.
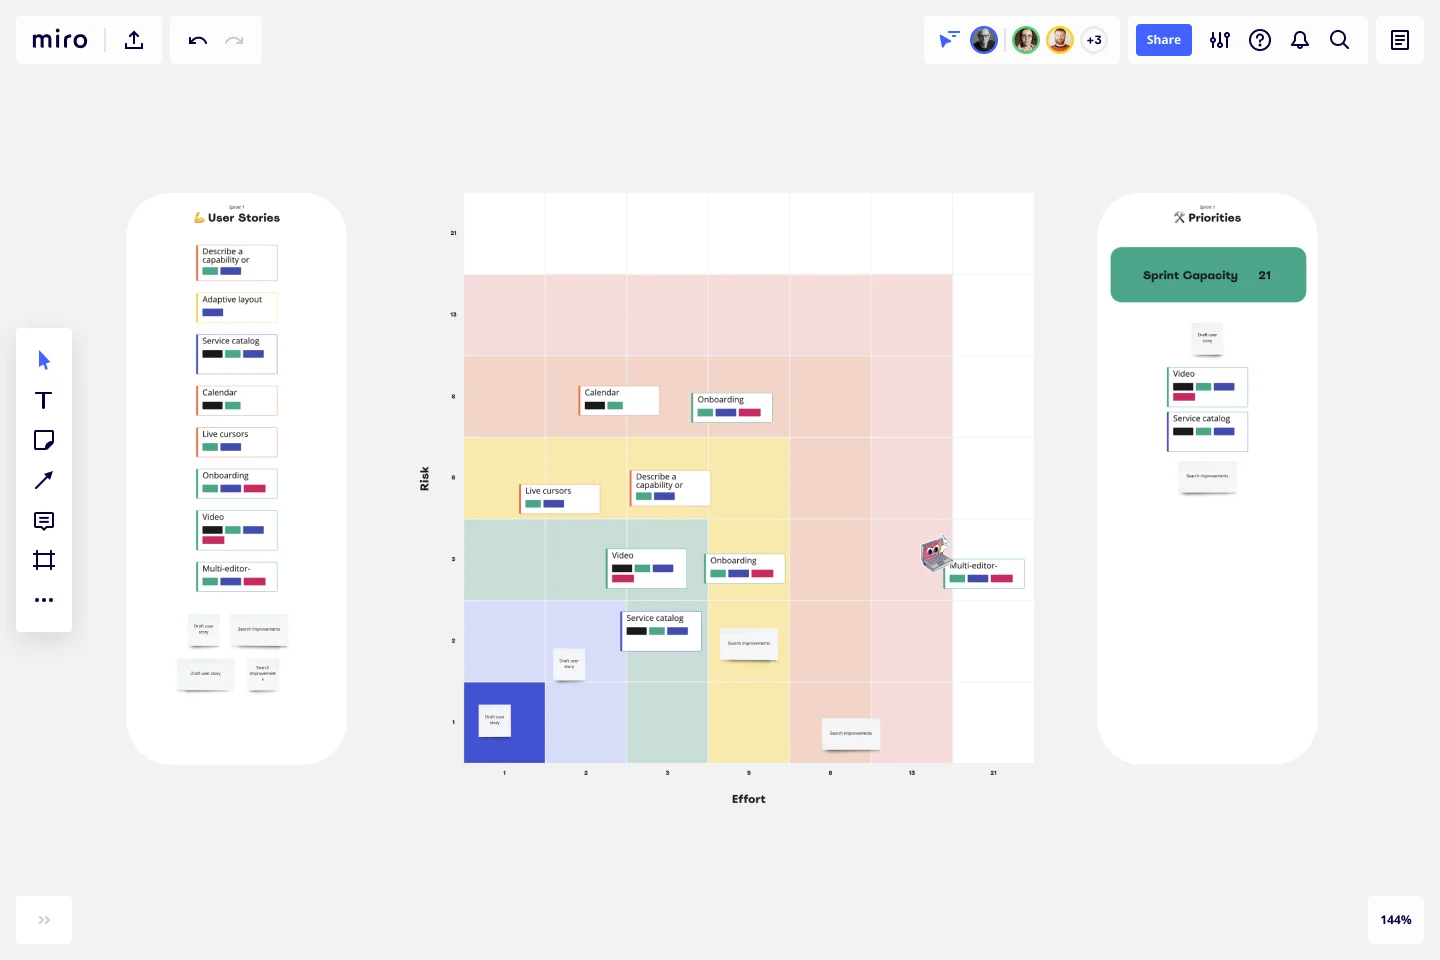
How to use the Fibonacci Scale Template in Miro
Start selecting our ready-made Fibonacci Scale Template. It will help you visualize your team’s tasks, evaluate efforts and prioritize them.
The Fibonacci Scale Template is divided into three sections:
User stories
Here is where you list tasks or user stories you want to estimate. If you use Jira, import stories as cards directly with the Jira app. Afterward, discuss with your team the risk and effort for each story.
Fibonacci Scale
Place the stories previously added to the sprint onto the Fibonacci scale matrix. Following your discussion, add them to the appropriate region according to their effort and risk levels.
To get perspectives and assess correctly how much effort and risk a task might take, allow each member to vote on the tasks with a unique emoji or sticker.
Priorities
Based on the Fibonacci scores and the team's prioritization, copy or drag stories onto the priorities frame. Be mindful of your team's capacity, and prioritize taking everyone’s opinions and schedules into consideration.
If you’re finding it hard to estimate task points, Artem Shein, Agile coordinator, created an interesting and fun template to help you and your team give points to tasks. Try it out!
Example of the Fibonacci Scale Template in action
Let’s say you are launching different product functionalities. You have user stories that look like this:
Service catalog
Calendar integration
Video integrations
Live cursors
After everyone has added their tasks to the Fibonacci scale, these are the points each task has:
Calendar integration: 8
Live cursors: 5
Video integration: 3
Service catalog: 2
To prioritize this list, start with the tasks with the least effort and lower risk. Those are the ones that your team will be able to deliver quicker. Afterward, list the ones that range from medium to high effort.
If you think a task that is higher up on the scale might not require so much effort, discuss it with your team to see what you can do to make its completion easier.
Create your priority list according to your team’s feedback and assign each task to its owner via Jira cards or tagging the stickies on your Fibonacci Scale Template.
Get started with this template right now.
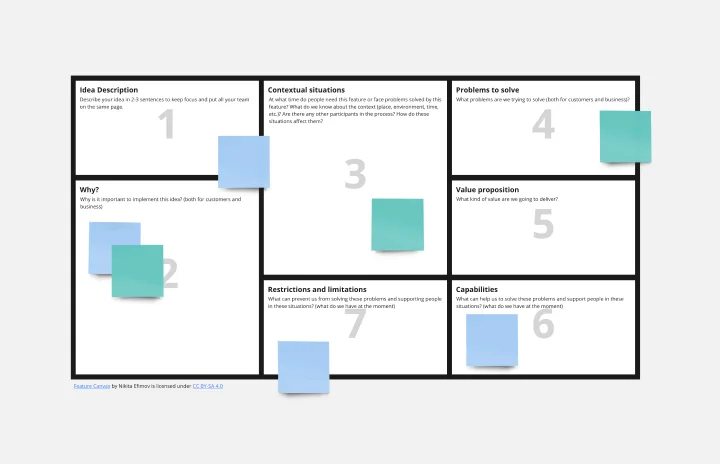
Feature Canvas Template
Works best for:
Design, Desk Research, Product Management
When you’re working on a new feature that solves a problem for your users, it’s easy to dive right in and start looking for solutions. However, it’s important to understand the initial user problem first. Use the Feature Canvas template to do a deep-dive into the user’s problems, the context in which they will use your feature, and the value proposition you will deliver to your users. The template enables you to spend more time exploring the problem to anticipate any potential blind spots before jumping into solutions mode.
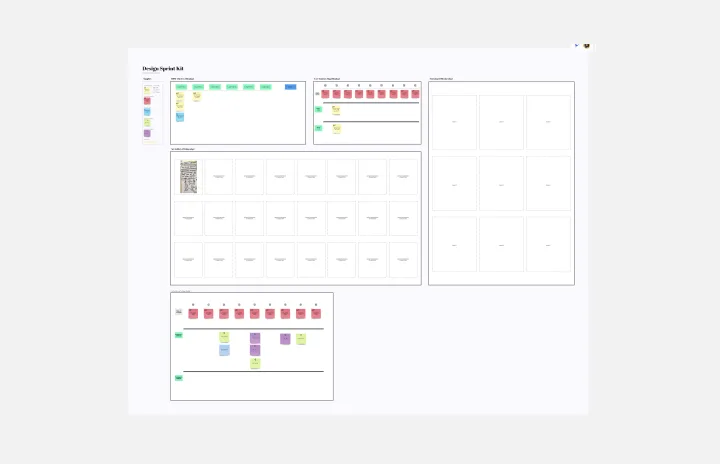
Design Sprint Kit Template
Works best for:
Agile Methodology, UX Design, Sprint Planning
With the right focused and strategic approach, five days is all it takes to address your biggest product challenges. That’s the thinking behind Design Sprint methodology. Created by Tanya Junell of Blue Label Labs, this Design Sprint Kit provides a set of lightweight templates that support the Design Sprint’s collaborative activities and voting—and maintains the energy, team spirit, and momentum that was sparked in the session. Virtual sprint supplies and prepared whiteboards make this kit especially useful for remote Design Sprint Facilitators.
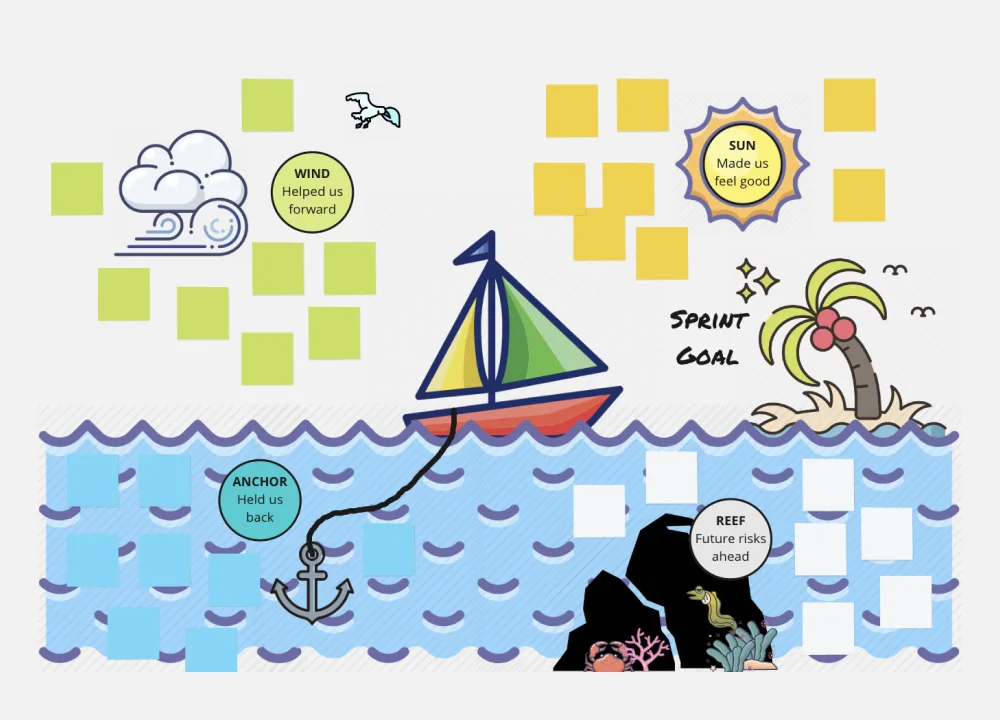
Sailboat Retro
Works best for:
Retrospectives, Agile Methodology, Meetings
The Sailboat Retrospective template offers a metaphorical journey through past iterations and future goals, likening the retrospective process to sailing a boat. It provides elements for identifying driving forces (winds), restraining forces (anchors), and destination (goal). This template enables teams to reflect on what propels them forward, what holds them back, and where they want to go next. By promoting visualization and metaphorical thinking, the Sailboat Retrospective empowers teams to navigate challenges, set sail towards their objectives, and steer towards success effectively.

Competitive Analysis Template
Works best for:
Marketing, Decision Making
Developing a great product starts with knowing the lay of the land (meaning who you’re up against) and answering a few questions: Who are your competitors? How does your product or service compare? What makes you stand out? A competitive analysis will help find the answers, which can ultimately shape your product, value prop, marketing, and sales strategies. It’s a great exercise when a big business event is about to occur — like a new product release or strategic planning session.
A Halloween Retro
Works best for:
Retrospectives, Meetings, Agile Methodology
The Retrospective Halloween template offers a themed approach to retrospectives, perfect for the spooky season. It provides elements for reflecting on past iterations, identifying scary issues, and brainstorming solutions. This template enables teams to have fun while addressing serious topics, fostering creativity and collaboration. By promoting a playful yet productive atmosphere, the Retrospective Halloween empowers teams to tackle challenges, drive improvement, and strengthen team cohesion effectively.
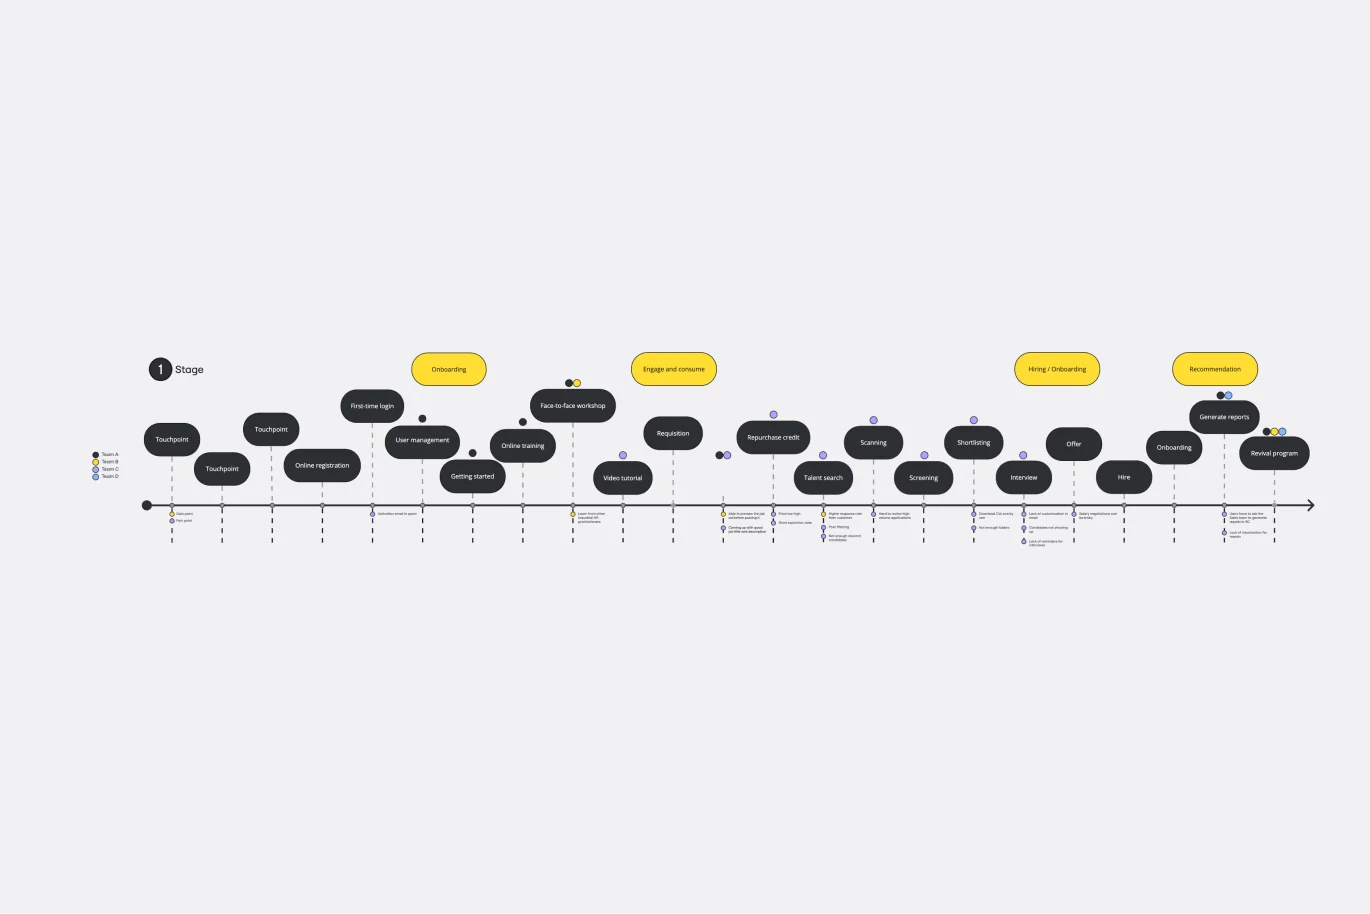
Customer Touchpoint Map Template
Works best for:
Desk Research, Product Management, Mapping
To attract and keep loyal customers, you have to truly start to understand them—their pain point, wants, and needs. A customer touchpoint map helps you gain that understanding by visualizing the path your customers follow, from signing up for a service, to using your site, to buying your product. And because no two customers are exactly alike, a CJM lets you plot out multiple pathways through your product. Soon you’ll be able to anticipate those pathways and satisfy your customers at every step.