Critical Path Method Template
Visualize project timelines, identify critical tasks, and foster seamless collaboration with the critical path method template.
Trusted by 65M+ users and leading companies


About the Critical Path Method Template
The Critical Path Method (CPM) Template is your key tool if you're looking to orchestrate projects with precision and efficiency. In project management, time is of the essence, and it's paramount to understand the critical path. Our CPM Template simplifies project scheduling, providing a visual roadmap to success. With this template, you can easily manage your project schedule and stay on top of deadlines.
What's the critical path method template?
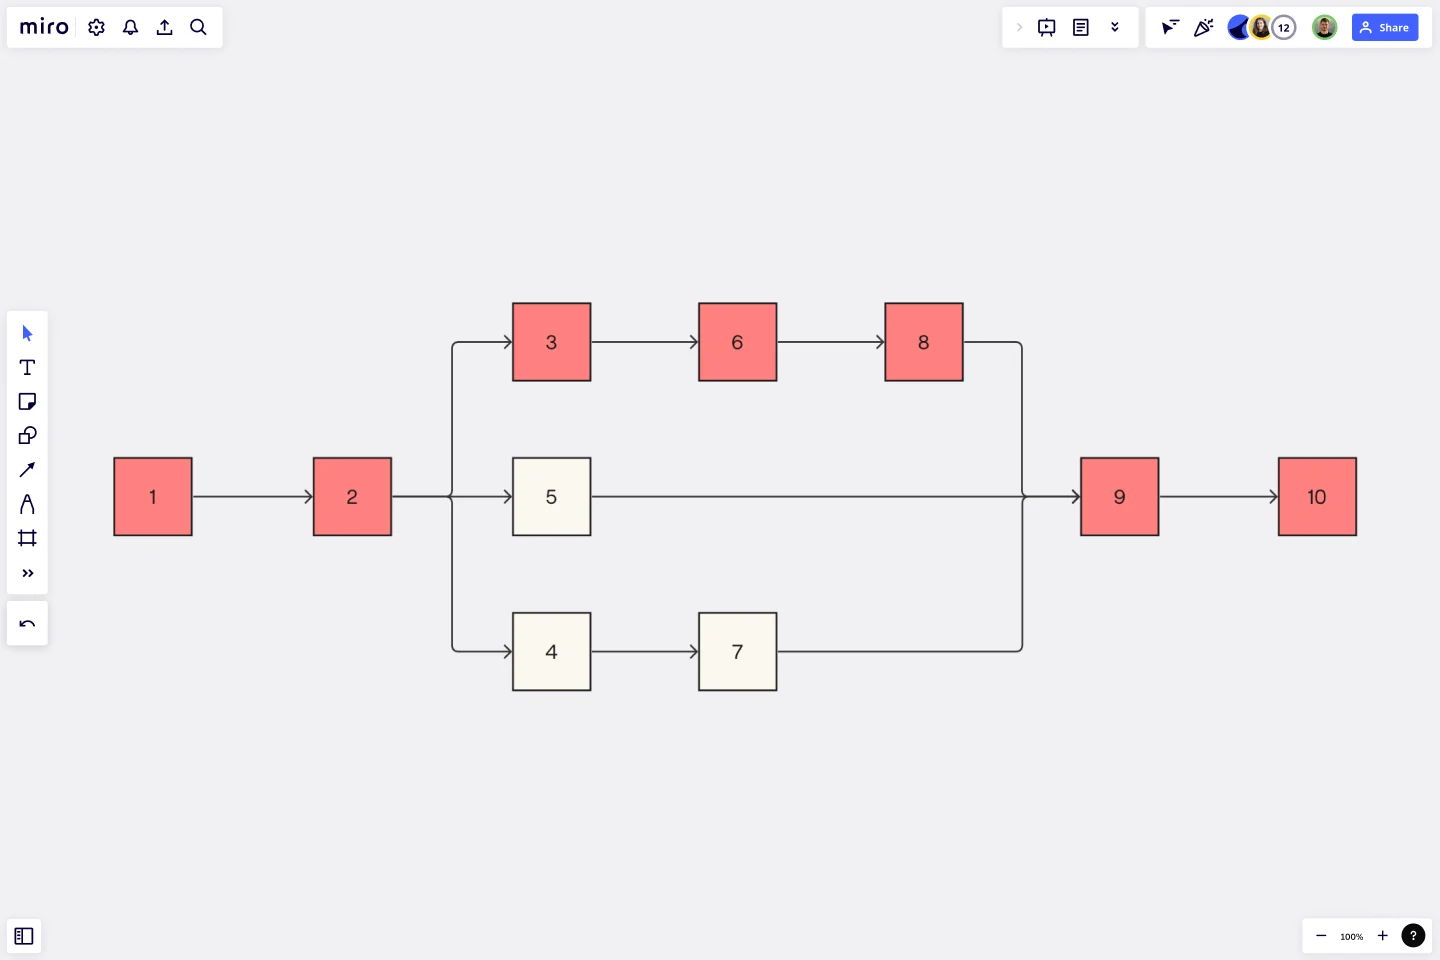
The Critical Path Method (CPM) Template is a powerful tool designed to simplify the complexities of project timelines. The CPM is a project management technique that identifies the sequence of tasks crucial for project completion. This template presents the method in a visual format, enabling you to easily see dependencies, estimate project duration, and identify the critical path. It aims to help teams manage time effectively, avoid delays, and ensure project success.
How to use the critical path method template in Miro
Add tasks and dependencies: Easily populate the template with your project tasks and establish dependencies by connecting the corresponding elements.
Add context: Enhance your project board by adding artifacts, such as documents, images, or comments, providing additional context to team members.
Collaborate: Leverage Miro's collaborative capabilities to work seamlessly with your team in real time. Changes made are instantly visible to all members, fostering efficient communication and coordination.
Why should you use a critical path method template?
Precision planning: Identify the most critical tasks and streamline your project timeline for best efficiency.
Risk mitigation: Anticipate potential delays and bottlenecks, allowing for proactive problem-solving and risk mitigation.
Enhanced communication: Visualize your project timeline, making it accessible and understandable for all team members, fostering clear communication.
Time optimization: Allocate resources effectively by focusing on tasks directly impacting project completion, minimizing unnecessary delays.
Adaptability: Respond swiftly to changes in project scope or timelines, ensuring adaptability in dynamic project environments.
Explore Miro's Critical Path Tool and start diagramming in seconds.
Can I customize the template to match my project's specific needs?
The Miro critical path method template is completely customizable, allowing you to tailor it to your project needs by double-clicking shapes to adjust them.
Is the Critical Path Method suitable for all types of projects?
Yes, the critical path template is versatile and can be applied to various projects, regardless of size or complexity.
Get started with this template right now.

Causal Loop Diagrams (1.0)
Works best for:
Diagramming
The Causal Loop Diagrams (1.0) template offers a visual tool for modeling complex systems and understanding the feedback loops that drive behavior. It provides a structured framework for identifying causal relationships, reinforcing loops, and balancing feedback within a system. This template enables teams to analyze system dynamics, anticipate unintended consequences, and formulate effective strategies for intervention. By promoting systems thinking and understanding of interdependencies, Causal Loop Diagrams empower organizations to navigate complexity and drive sustainable change.

Azure Demand Forecasting Template
Works best for:
Software Development, Diagrams
The Azure Demand Forecasting diagram will show the architecture of a demand forecast, making it easier for you to predict data consumption, costs, and forecast results. Azure is Microsoft’s cloud computing platform, designed to provide cloud-based services such as remote storage, database hosting, and centralized account management. Azure also offers new capabilities like AI and the Internet of Things (IoT).
Fishbone Diagram Template
Works best for:
Operations, Diagrams, Workflows
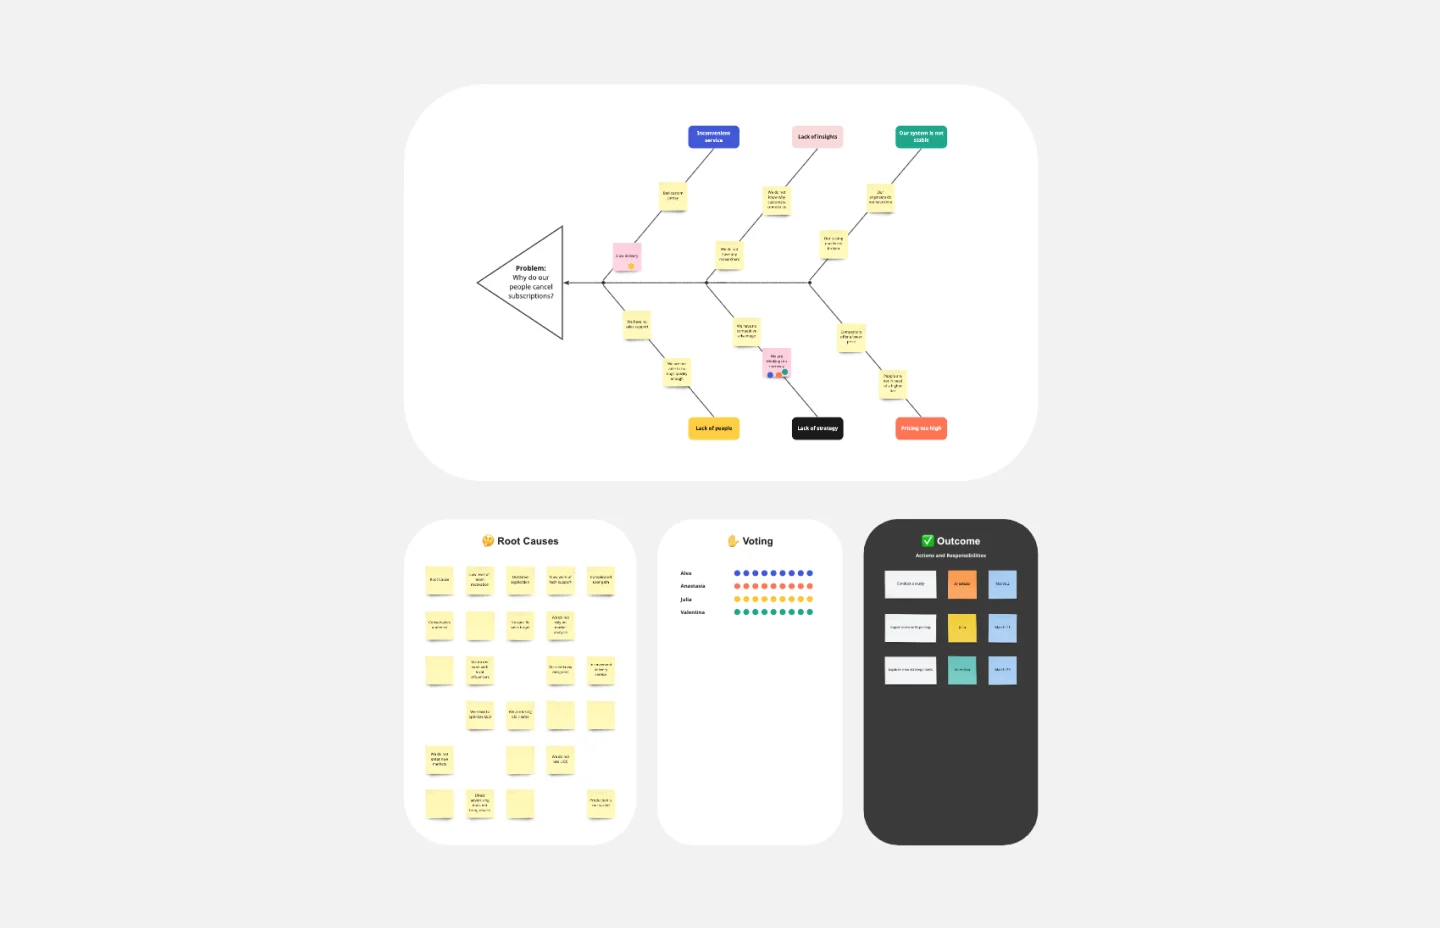
What is the best way to solve any problem your team faces? Go straight to the root. That means identifying the root causes of the problem, and fishbone diagrams are designed to help you do it best. Also known as the Ishikawa Diagram (named after Japanese quality control expert Kaoru Ishikawa), fishbone diagrams allow teams to visualize all possible causes of a problem, to explore and understand how they fit together holistically. Teams can also use fishbone diagrams as a starting point for thinking about what the root cause of a future problem might be.
Chat-Bot
Works best for:
Diagramming
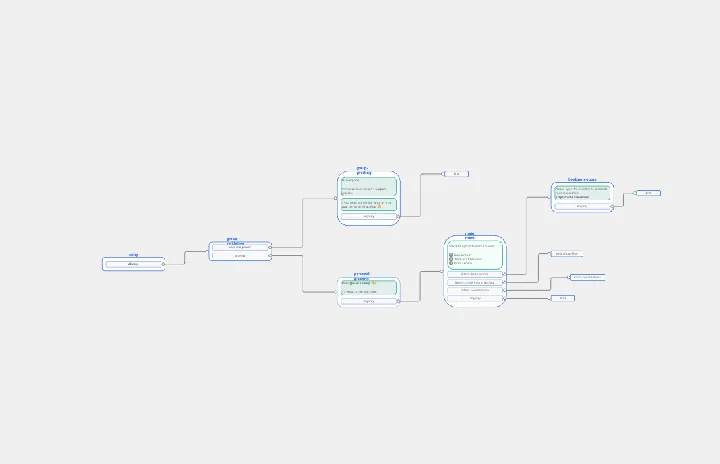
The Chat Bot template is a visual tool for designing and mapping out chatbot interactions and functionalities. It provides a structured framework for visualizing conversation flows, user inputs, and bot responses. This template enables teams to collaborate on designing chatbot experiences that are intuitive and user-friendly, driving engagement and satisfaction. By promoting clarity and alignment, the Chat-Bot template empowers organizations to create effective chatbot solutions that meet user needs and business objectives.

20/80 Process Diagram - EOS Compatible
Works best for:
Diagramming
The 20/80 Process Diagram - EOS® Compatible template is a visual tool for mapping out processes and workflows aligned with the Entrepreneurial Operating System (EOS®) methodology. It provides a structured framework for identifying core processes and key activities that drive business outcomes. This template enables organizations to streamline operations, clarify roles and responsibilities, and enhance accountability. By promoting alignment with EOS® principles, the 20/80 Process Diagram empowers teams to achieve organizational excellence and drive sustainable growth.
BPMN Template
Works best for:
Mapping, Diagrams, Business Management
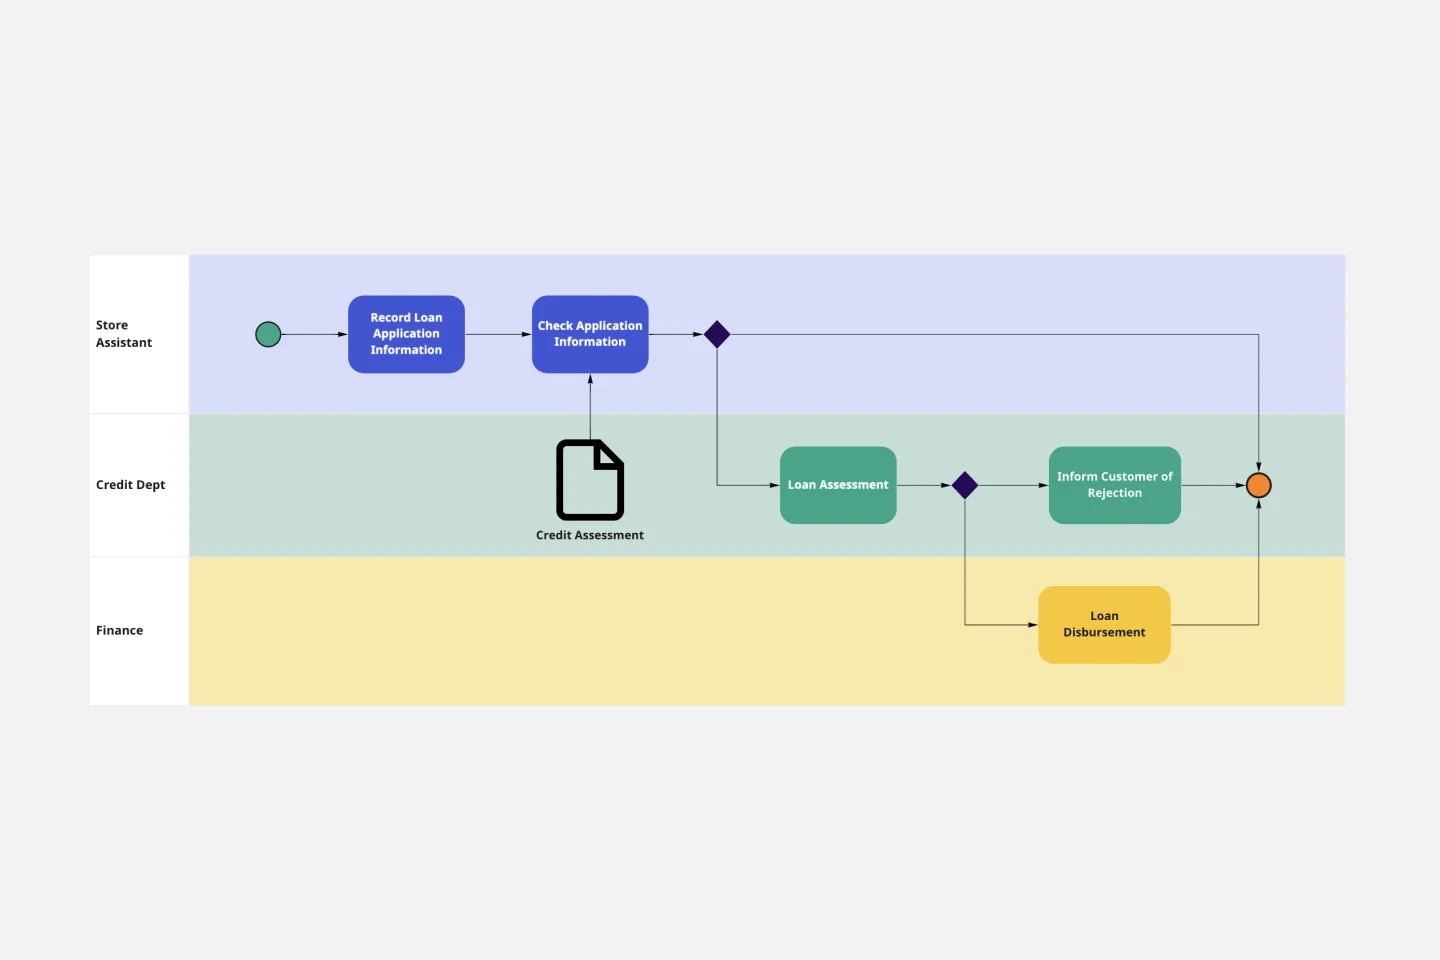
The BPMN template helps you track and get an overview of your business processes. It’s a great way to identify any bottlenecks and make your operations more efficient. The BPMN methodology became a universal language when managing business processes, and multiple industries use it as a management tool. Project managers, business analysts, and IT administrators use the BPMN process flow diagram to manage projects, visually communicate the process flows, and keep track of process constraints. Try it for yourself and see improvements in your organization’s agility.