Impact Mapping Template
Set business goals and outline how to achieve them.
Trusted by 65M+ users and leading companies


About the Impact Mapping template
What is Impact Mapping?
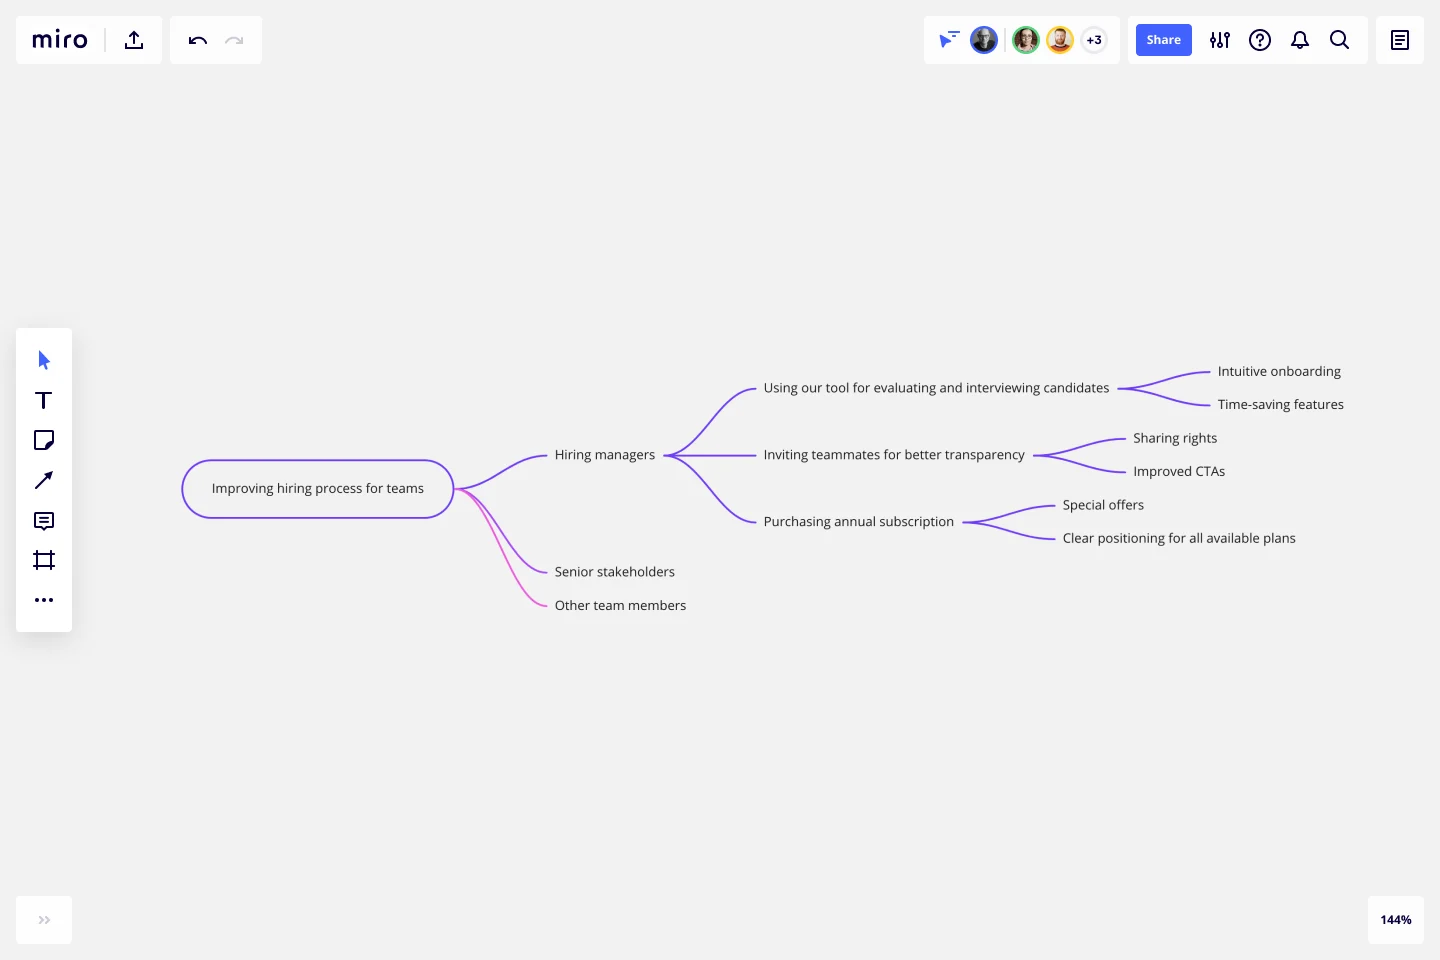
Impact mapping is a strategic planning technique. It allows organizations to stay on track while building products and shipping goods and services. An impact map is a graphical representation of your goals and the steps you must take to deliver on them. By creating an impact map, you can clearly communicate with your teammates, align on business objectives, and build better roadmaps.
When building products or working on projects, it can be easy to lose sight of your role within the broader organization. But your projects have a dynamic relationship with everything else in the organization, including other projects, teams, products, and functions. Many planning techniques lack this big-picture view. Impact maps, by contrast, help you visualize the relationship between your project roadmaps and the rest of your organization. You can therefore capture key assumptions and scope so you can deliver solutions without waste or over-engineering.
When should you use Impact Mapping?
You can use Impact Mapping to help you decide what should be in a product, prove to a client that it’s not worth investing in a particular feature and plan your next sprint or release. You can also use Impact Mapping for any type of project planning.
What are the key steps of Impact Mapping?
Impact Mapping is generally broken into 4 key steps: setting and describing business goals, identifying the personas, defining the actions these personas will take, and brainstorming the deliverables that will prompt these actions to take place.
How do you create an Impact Map?
Creating an impact map is simple and easy to do if you follow these steps. You can use our Impact Mapping Template and discuss everything with your team in real-time using Miro’s virtual collaboration platform.
Step 1: Decide on your goals
Start by drawing a box that contains your goal. Why are we doing this project? What do we hope to achieve?
Step 2: Identify the actors
Draw a branch that links your goal to your next box: the actors. Who can produce the effect we’re looking for? Who can obstruct who? Who are our customers or users? Who will be impacted by our goal? Many people choose to have a box for each actor. Connect each box to your goal.
Step 3: Determine the impacts or actions
The second branch brings the impact of your goal into sharper focus. How should our actors’ behavior change as a result of this goal? How can they help us achieve our goal? How might they prevent us from achieving our goal? Draw a box for each potential impact and connect them to your actors.
Step 4: Define the deliverables
Once you have answered those questions, you can start thinking about the scope of your project. The third branch of the map deals with deliverables. What can we do to increase the likelihood that this goal will be achieved? How do we support the desired impact? These are your deliverables -- what you can hope to achieve within the scope of this project.
Get started with this template right now.

Azure Demand Forecasting Template
Works best for:
Software Development, Diagrams
The Azure Demand Forecasting diagram will show the architecture of a demand forecast, making it easier for you to predict data consumption, costs, and forecast results. Azure is Microsoft’s cloud computing platform, designed to provide cloud-based services such as remote storage, database hosting, and centralized account management. Azure also offers new capabilities like AI and the Internet of Things (IoT).
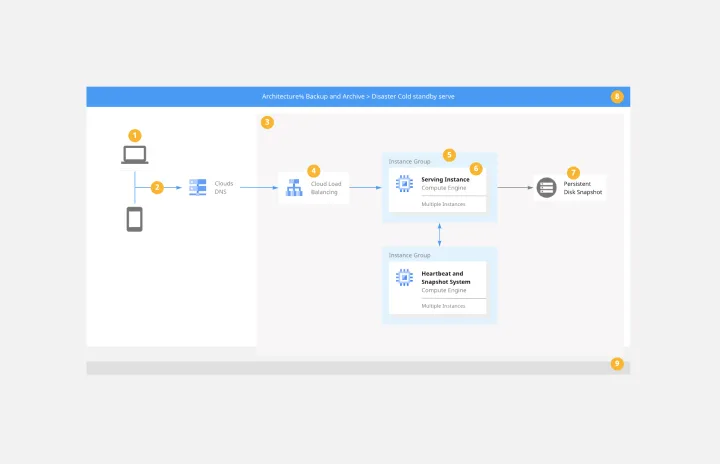
Google Cloud Architecture Diagram Template
Works best for:
Software Development, Diagrams
Use the Google Cloud Architecture Diagram template to clearly visualize the deployment of your application and allow you and your team to optimize processes. The GCP template gives you a great overview of your application architecture, and it helps you to iterate quickly and better manage your application development, deployment, and documentation. Try it out and see if it works for you.
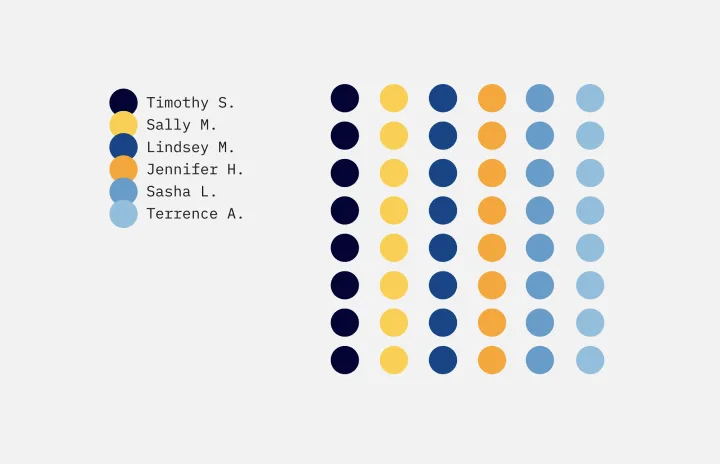
Dot Voting Template
Works best for:
Decision Making, Meetings, Workshops
Dot voting, also known as “sticker voting,” “dotmocracy,” or “voting with dots”, allows teams to point out issues in a series of potential solutions or to prioritize tasks when presented with various options. Dot voting is different from the default “one-share” or “one-vote” rule. Instead, each person in the group is given as many votes (or “points”) as can be filled. Those votes can either all be cast for one idea, or distributed among many ideas. You can use dot voting any time your team prioritizes options or agrees on a direction to take for a high-stakes project.
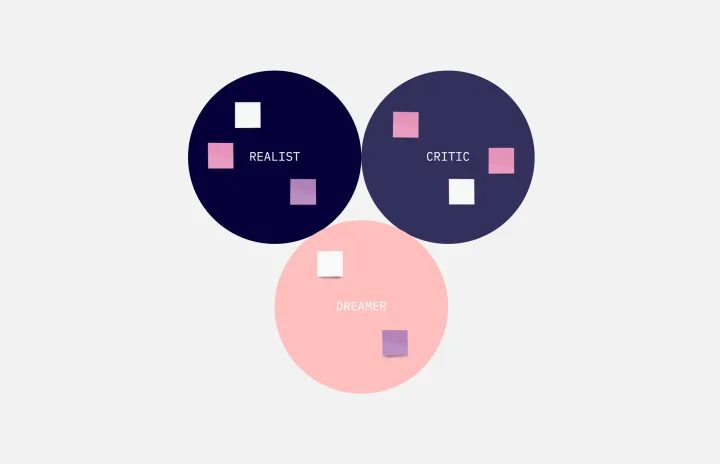
Disney Creative Strategy Template
Works best for:
Business Management, Ideation, Brainstorming
Know who knew a little something about coming up with ideas that set imaginations alight? Walt Disney. And he inspired the Disney Creative Strategy, an approach that establishes three types of thinkers—dreamers, realists, and critics—and gives each the space to do clear thinking. Your team will go through an engaging exercise of adopting the three mindsets, where they’ll focus on a specific aspect of the idea. The Disney Creative Strategy has a way of yielding brilliant ideas and great products. That’s why it’s used successfully by organizations of all kinds and sizes.
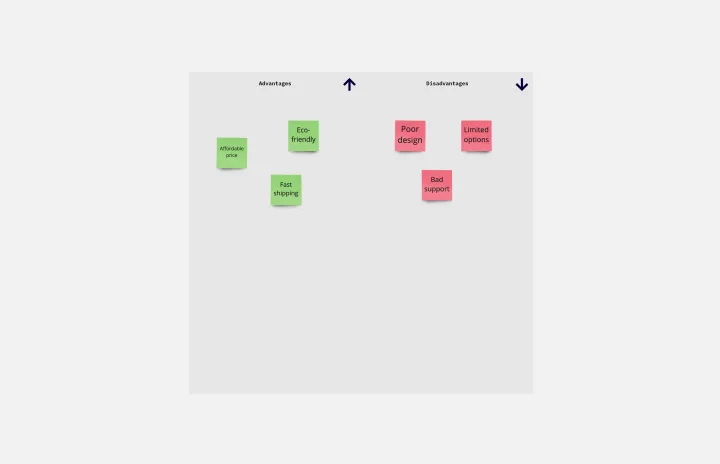
T-Chart Template
Works best for:
Ideation, Operations, Strategic Planning
T-Charts can help you compare and contrast two different ideas, group information into different categories, and prove a change through “before” and “after” analysis. T-Charts are visual organizational tools that enable you to compare ideas, so you can evaluate pros and cons, facts and opinions, strengths and weaknesses, or big-picture views versus specific details. Designers and content creators can use T-Charts to turn possibilities into actionable ideas. T-Charts are useful for discussing differences and similarities with your team or clients and can help you to reach a decision together.
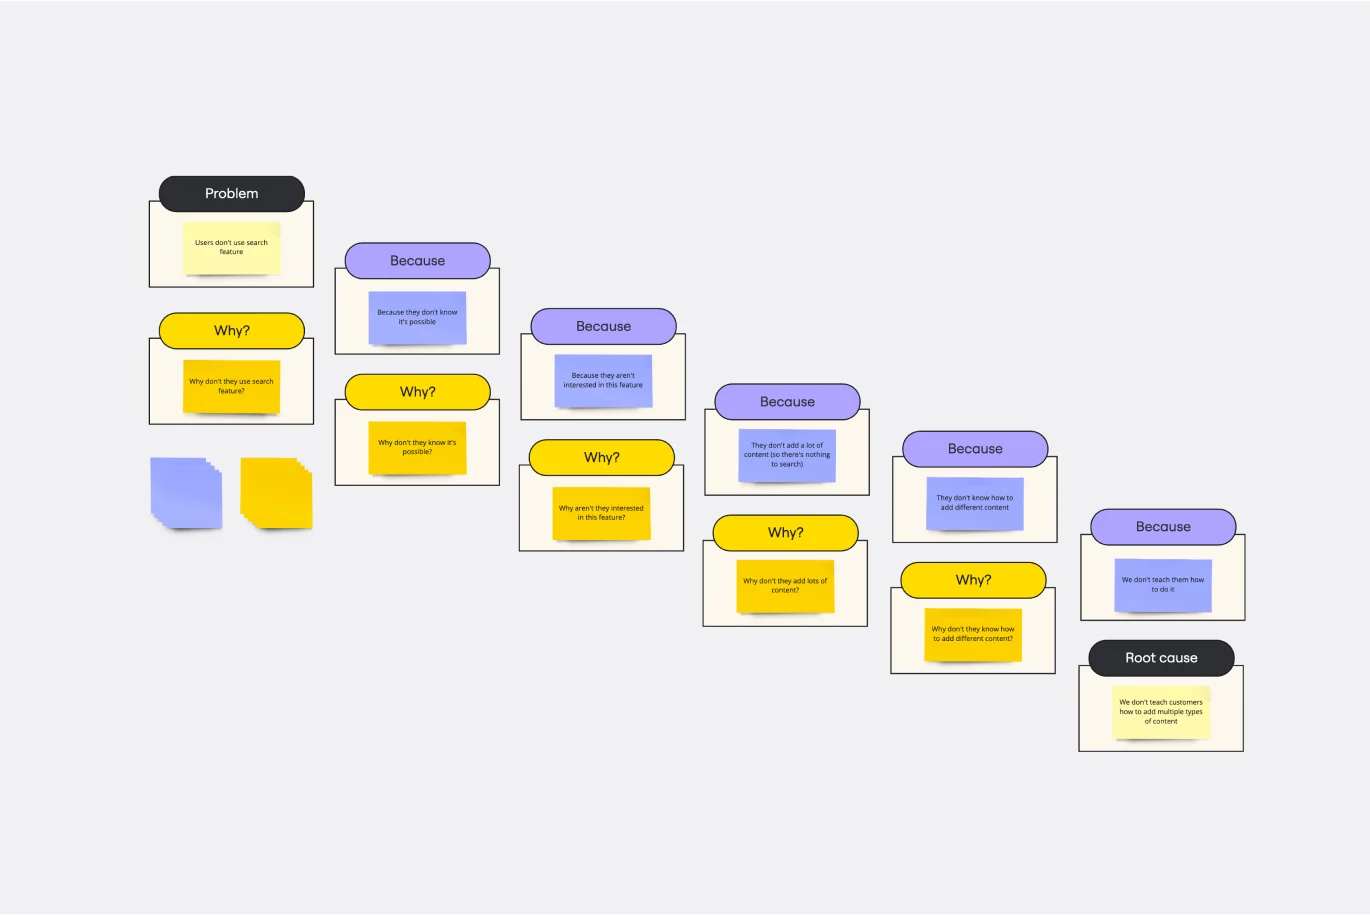
5 Whys Template
Works best for:
Design Thinking, Operations, Mapping
Ready to get to the root of the problem? There’s no simpler way to do it than the 5 Whys technique. You’ll start with a simple question: Why did the problem happen? Then you’ll keep asking, up to four more times, until the answer becomes clear and you can work toward a solution. And Miro’s features enhance the approach: You can ask team members questions in chat or @mention them in comments, and use color-coded sticky notes to call out issues that are central to the problem at hand.