
Darts Template
Prioritize items using a target diagram with the Darts Template.
Trusted by 65M+ users and leading companies


About the Darts Template
When working on a project, it is expected to assume that all ideas, tasks, or features hold the same significance level. However, to achieve best results and concentrate on the most crucial elements, it is necessary to determine what takes precedence. This approach enables prioritization, allowing you to focus on what requires immediate attention while deferring the remaining aspects for later.
The Darts Template, by design, restricts the amount of content that can be placed in the center, compelling your team to deliberate on priorities before taking any action.
Benefits of using the template
Prioritizes what is most important.
Promotes effective dialogue.
Fosters agreement.
Assists in creating a strategic roadmap.
How to use the template in Miro
Collect or create elements beyond the boundaries.
Discuss the significance of each item. Place primary items in the center.
Secondary elements in the second circle. Third-level elements in the third circle.
Organize and categorize clusters. Utilize this to determine task priority.
Setup
Collect the data that requires prioritization.
Add data using the properly sized stickies provided.
Establish the factors for ranking.
Gather a group of colleagues.
Useful tips
Collect information to rank asynchronously.
Avoid reducing the size of the stickies to accommodate more in the center.
Get started with this template right now.
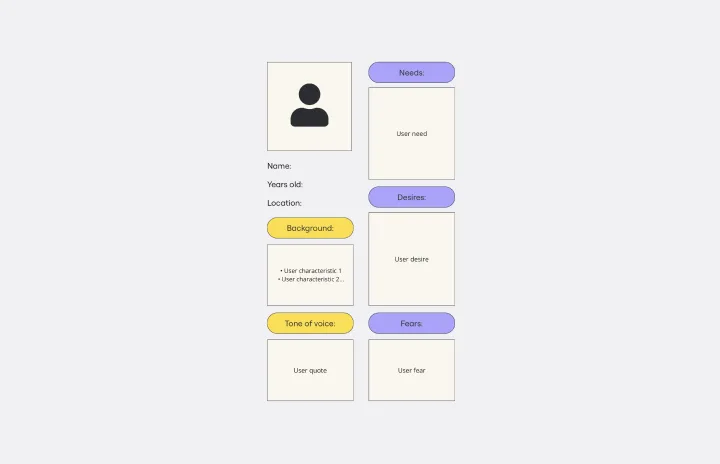
Proto Persona Template
Works best for:
UX, UX Research, Product Design
The Proto Persona Template is tailored to capture the essence of hypothetical user segments. It encapsulates key attributes such as user needs, behaviors, and potential pain points. One of its standout benefits is its ability to foster empathy. By visualizing and understanding these preliminary user profiles, design and strategy teams can tap into a deeper connection with their target audience, ensuring that solutions resonate authentically and address genuine needs.
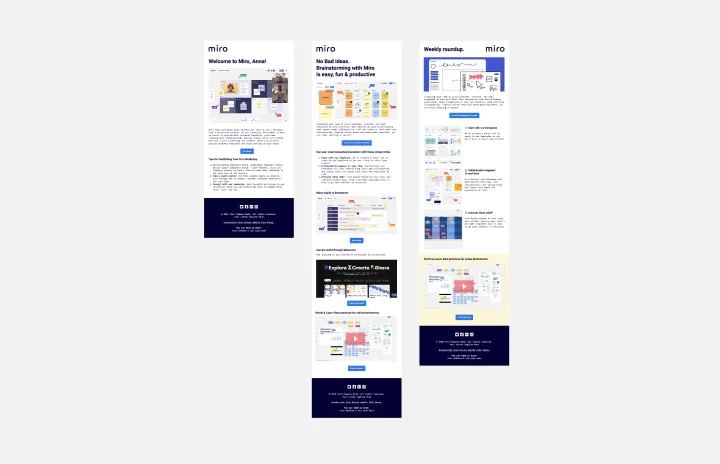
Newsletter Template
Works best for:
Design, Marketing, Desk Research
Using a newsletter template allows you to create a structured and eye-catching newsletter for your subscribers. Add images, text, a call-to-action, and anything else that’ll keep your audience engaged. Take a look at Miro’s newsletter template to start creating unique and distinctive emails today.
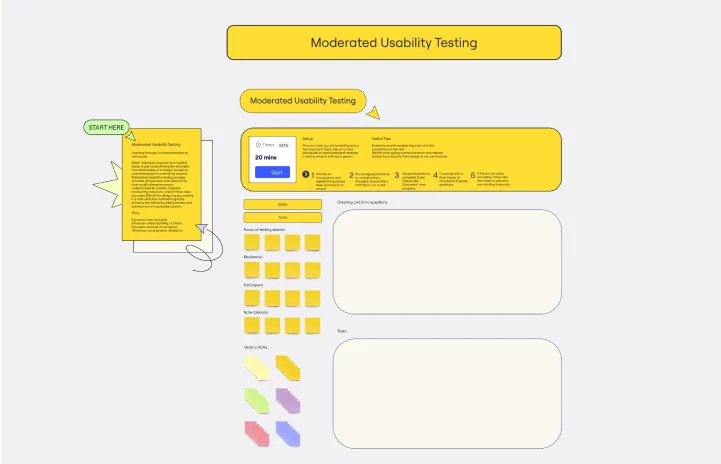
Moderated Usability Testing Template
Works best for:
Design
Encouraging individuals to express their implicit ideas helps identify the strengths and weaknesses of a design, and Moderated Usability Testing Template provides valuable perspectives. Typically, conducting only six to nine of these tests uncovers 80% of design issues, making it a cost-effective method to enhance potential solutions.
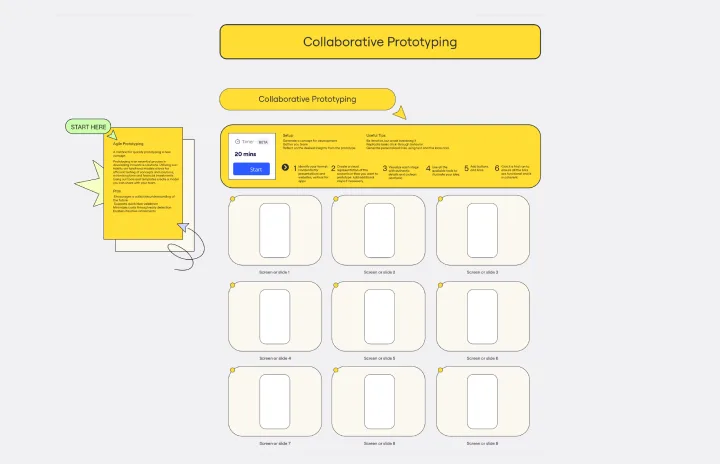
Collaborative Prototyping Template
Rapid prototyping quickly tests concepts and solutions with low-fidelity functional models, reducing investments by identifying issues early. The Collaborative Prototyping Template generates ideas and tests them with a framework for sharing prototypes and getting feedback.
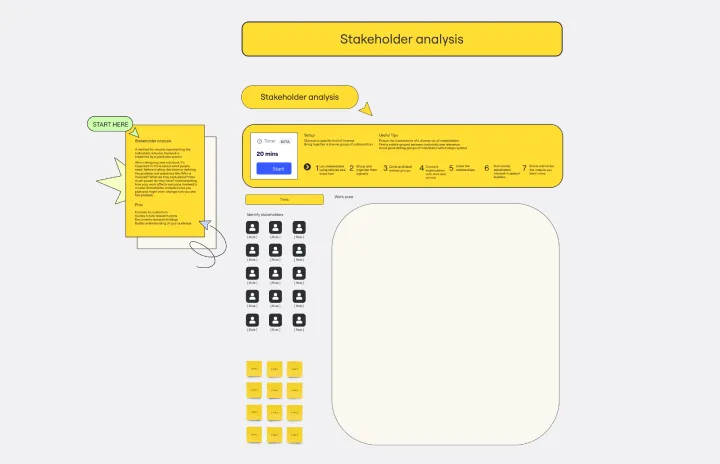
Stakeholder Analysis Template
Works best for:
Design
When designing new solutions, thinking about what people need is important. Before deciding or defining the problem, ask questions like: Who is involved? What do they care about? How much power do they have? Understanding how your work affects everyone involved is crucial. Stakeholder analysis helps you plan and might change how you see the problem.
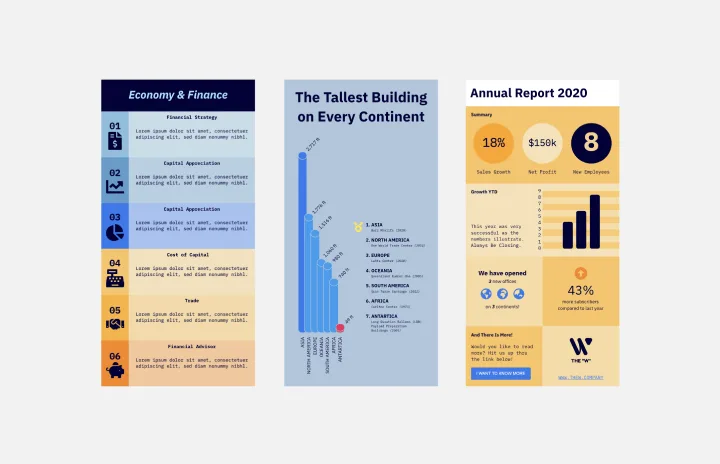
Infographic Template
Works best for:
Marketing, Desk Research, Documentation
As we bet you’ve experienced, data can get pretty dense and dry. But you need it to be compelling, memorable, and understandable. The solution? Infographics. These are tools that let you present information in a visually striking way and turn quantitative or qualitative data into stories that engage and resonate. Whoever you’ll be presenting to — customers, donors, or your own internal teams — our template will let you design an infographic that combines text and visuals to break down even the most complicated data.