Mind Map Template
Show the connections between different ideas with the Mind Map Template.
Trusted by 65M+ users and leading companies


About the Mind Map Template
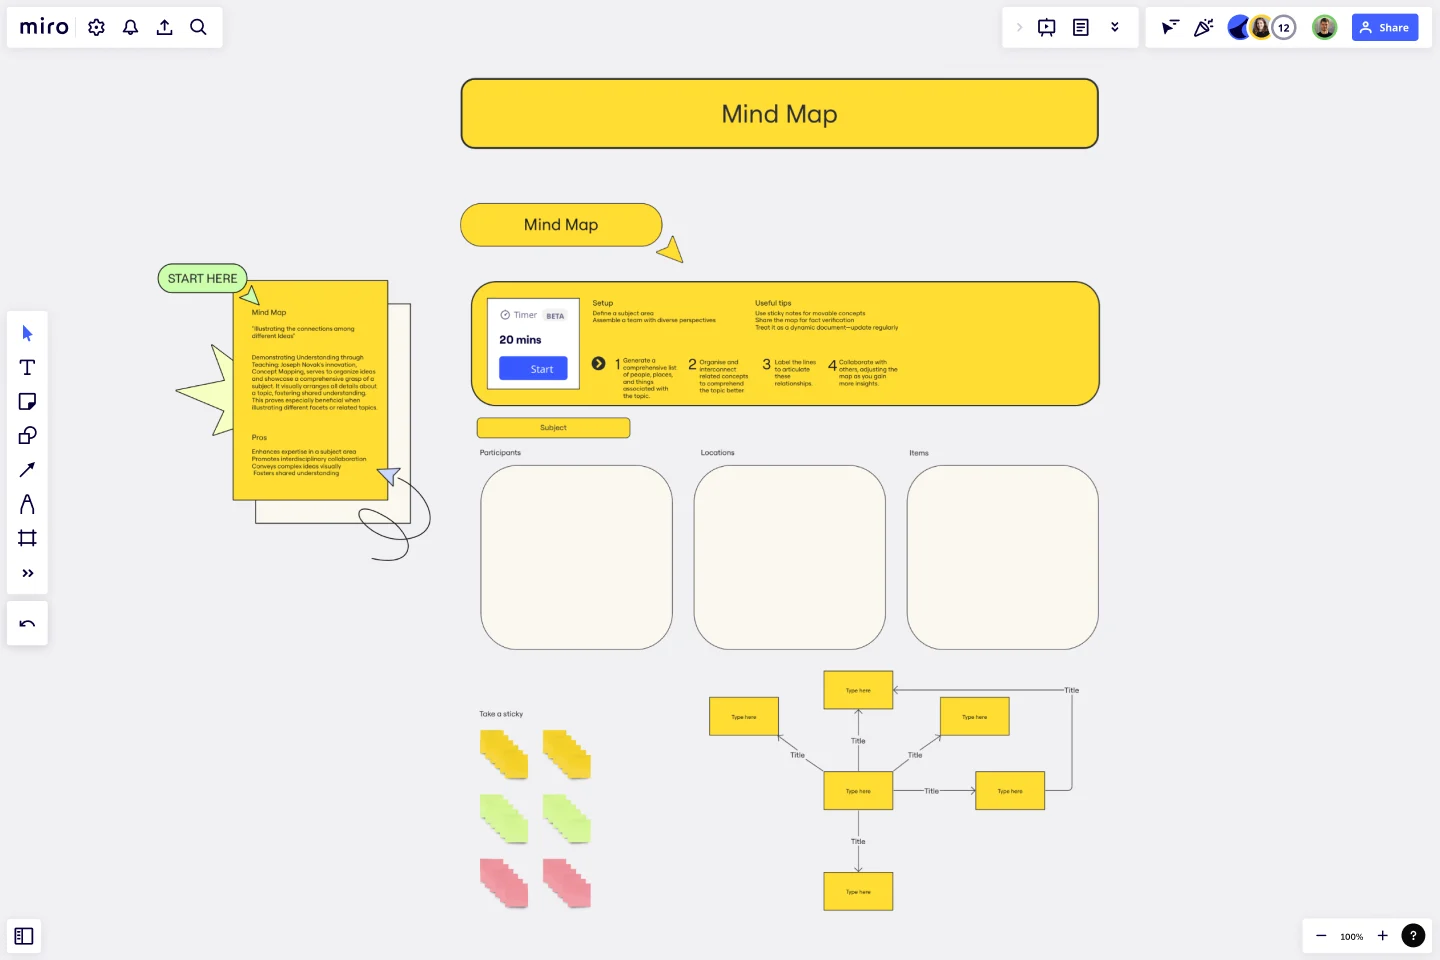
The Mind Map Template is a tool that is based on the Concept Mapping technique developed by Joseph Novak. It helps you organize and present your understanding of a subject in a visually appealing and comprehensive manner. This technique represents a topic by hierarchically connecting different ideas and concepts.
The main advantage of this technique is that it fosters shared understanding among people by visually arranging all the details about a topic. This method is particularly useful when explaining complex topics with multiple facets or related issues.
Benefits of using the template
Enhance expertise in a subject area.
Promote interdisciplinary collaboration.
Convey complex ideas visually.
Foster shared understanding.
How to use the template in Miro
Generate a comprehensive list of people, places, and things associated with the topic.
Organize and interconnect related concepts to comprehend the topic better.
Label the lines to articulate these relationships.
Collaborate with others, adjusting the map as you gain more insights.
Setup
Define a subject area.
Assemble a team with diverse perspectives.
Useful tips
Use sticky notes for movable concepts.
Share the map for fact verification.
Treat it as a dynamic document—update regularly.
Get started with this template right now.
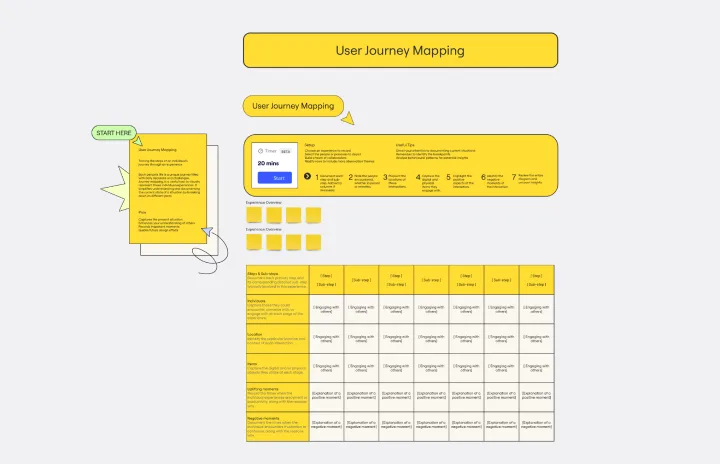
User Journey Mapping Template
Works best for:
Design
Each person's life is a unique journey filled with daily decisions and challenges. The User Journey Mapping Template is a useful tool to visually represent these individual experiences. It simplifies understanding and documenting the current state of a situation by breaking down its different parts.
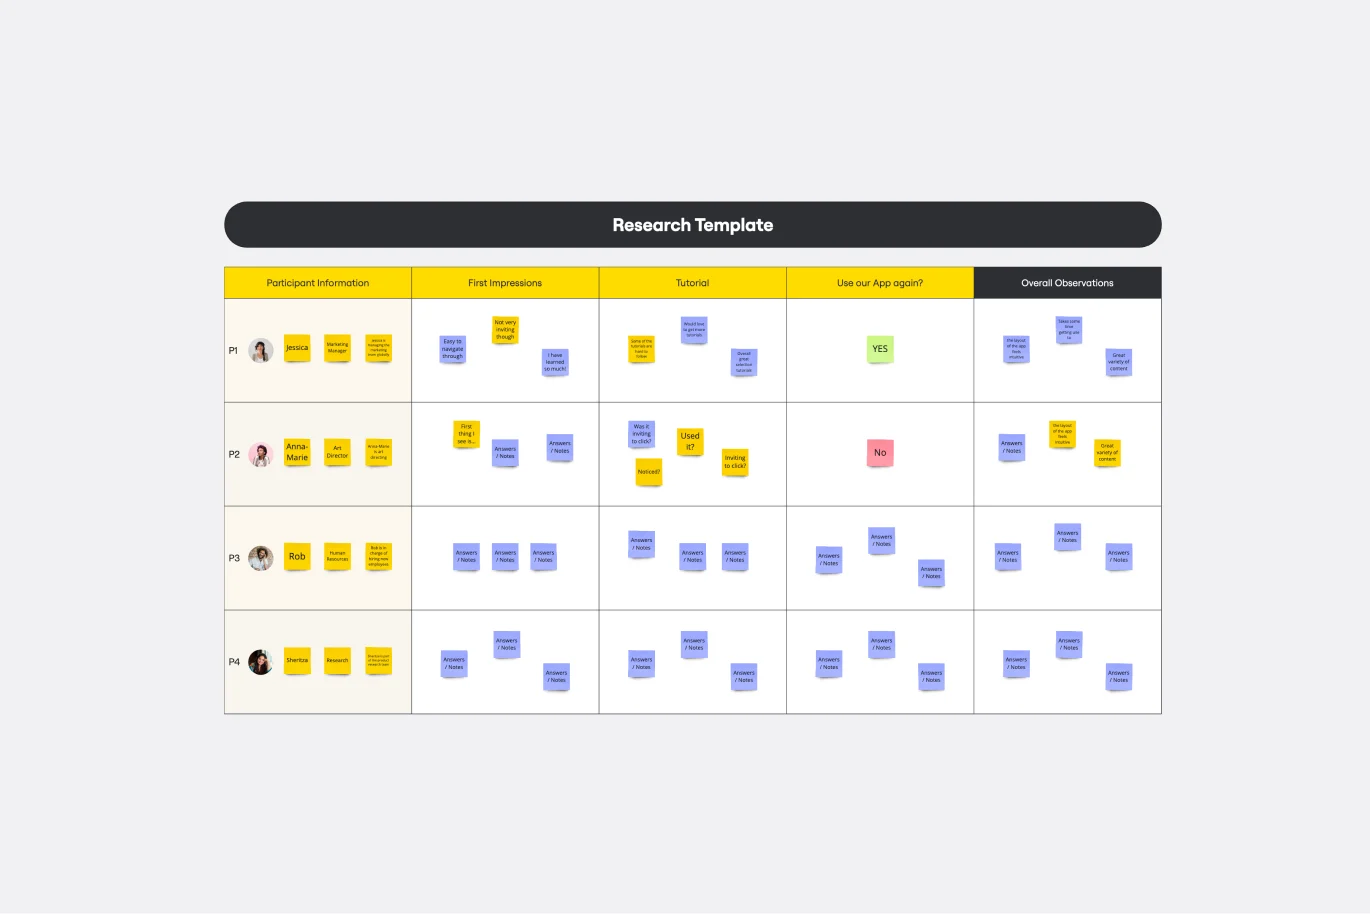
Research Template
Works best for:
Education, Desk Research, Product Management
Teams often need to document findings from usability testing sessions and customer interviews into a systematic, flexible user research template. Collecting everyone’s observations into a centralized location makes it easier to share insights company-wide and suggest new features based on user needs. Research templates can be used to record quantitative or qualitative data.. When it’s your job to ask questions, take notes, learn more about your user, and test iteratively, a Research Template can help you validate your assumptions, find similarities across different users, and articulate their mental models, needs, and goals.
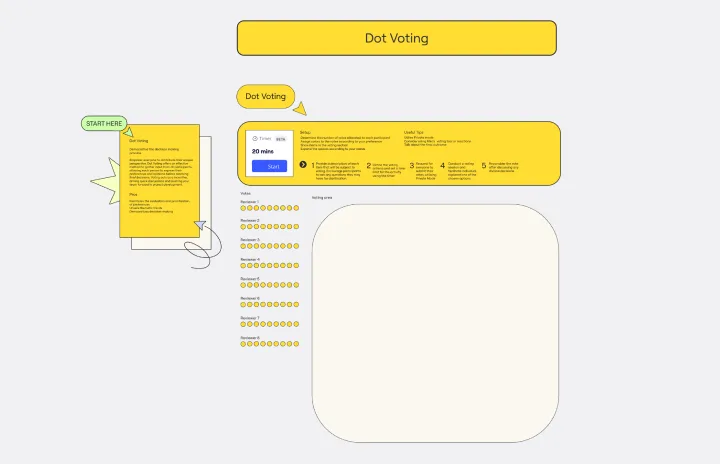
Dot Voting Template
Works best for:
Design
The Dot Voting Template is an excellent tool to gather input from all participants, enabling each person to express their preferences and opinions before reaching final decisions. Voting acts as an incentive, driving quick discussions and pushing your team forward in project development.
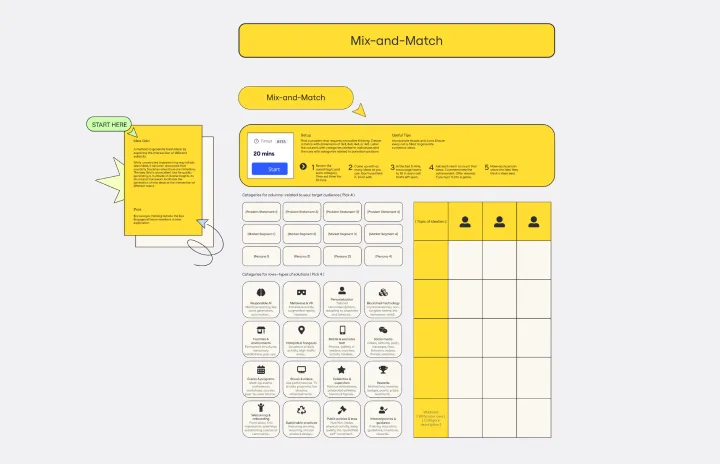
Mix-and-Match Template
While unrestricted brainstorming may initially seem ideal, it has been discovered that creativity flourishes when there are limitations. The Mix-and-Match Template is an excellent tool for quickly generating diverse insights. Its structured framework facilitates the generation of new ideas at the intersection of different topics.
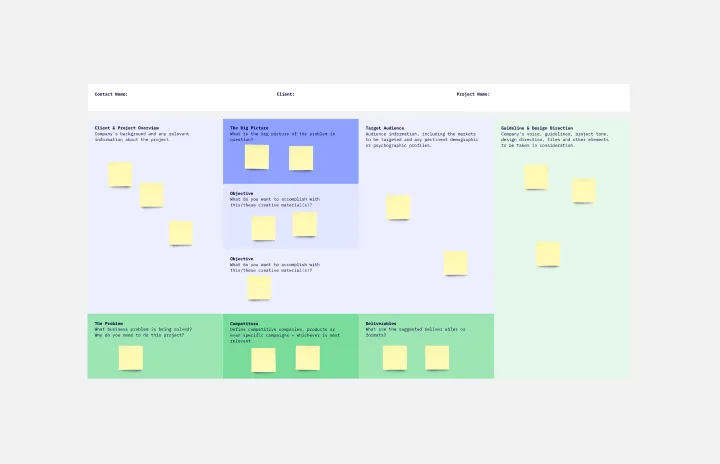
Design Brief Template
Works best for:
Design, Marketing, UX Design
For a design to be successful, let alone to be great, design agencies and teams have to know the project’s goals, timelines, budget, and scope. In other words, design takes a strategic process—and that starts with a design brief. This helpful template will empower you to create a brief that builds alignment and clear communication between your business and your design agency. It’s the foundation of any creative project, and a single source of truth that teams can refer to all along the way.
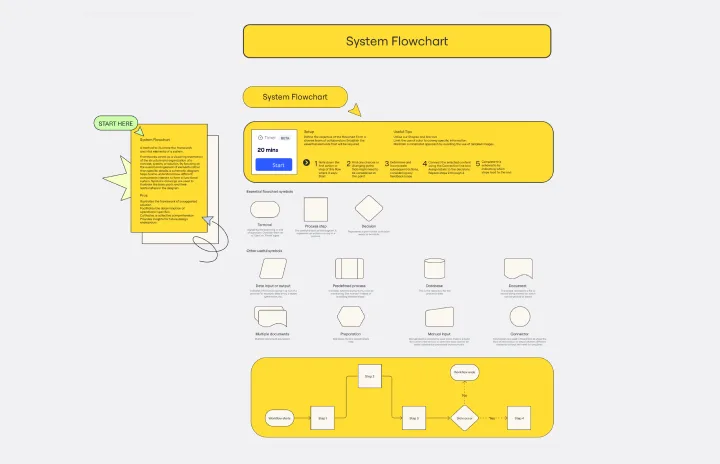
System Flowchart Template
The System Flowchart Template is a visual representation of the structure and organization of a concept, system, or solution. It helps teams understand how different components interact to form a functional system by focusing on the overall arrangement of elements rather than specific details. Symbolic drawings are used to illustrate the basic parts and their relationships in the diagram.