Yes No Flowchart Template
Improve decision-making with the yes no flowchart template.
Trusted by 65M+ users and leading companies


About the Yes-No Flowchart Template
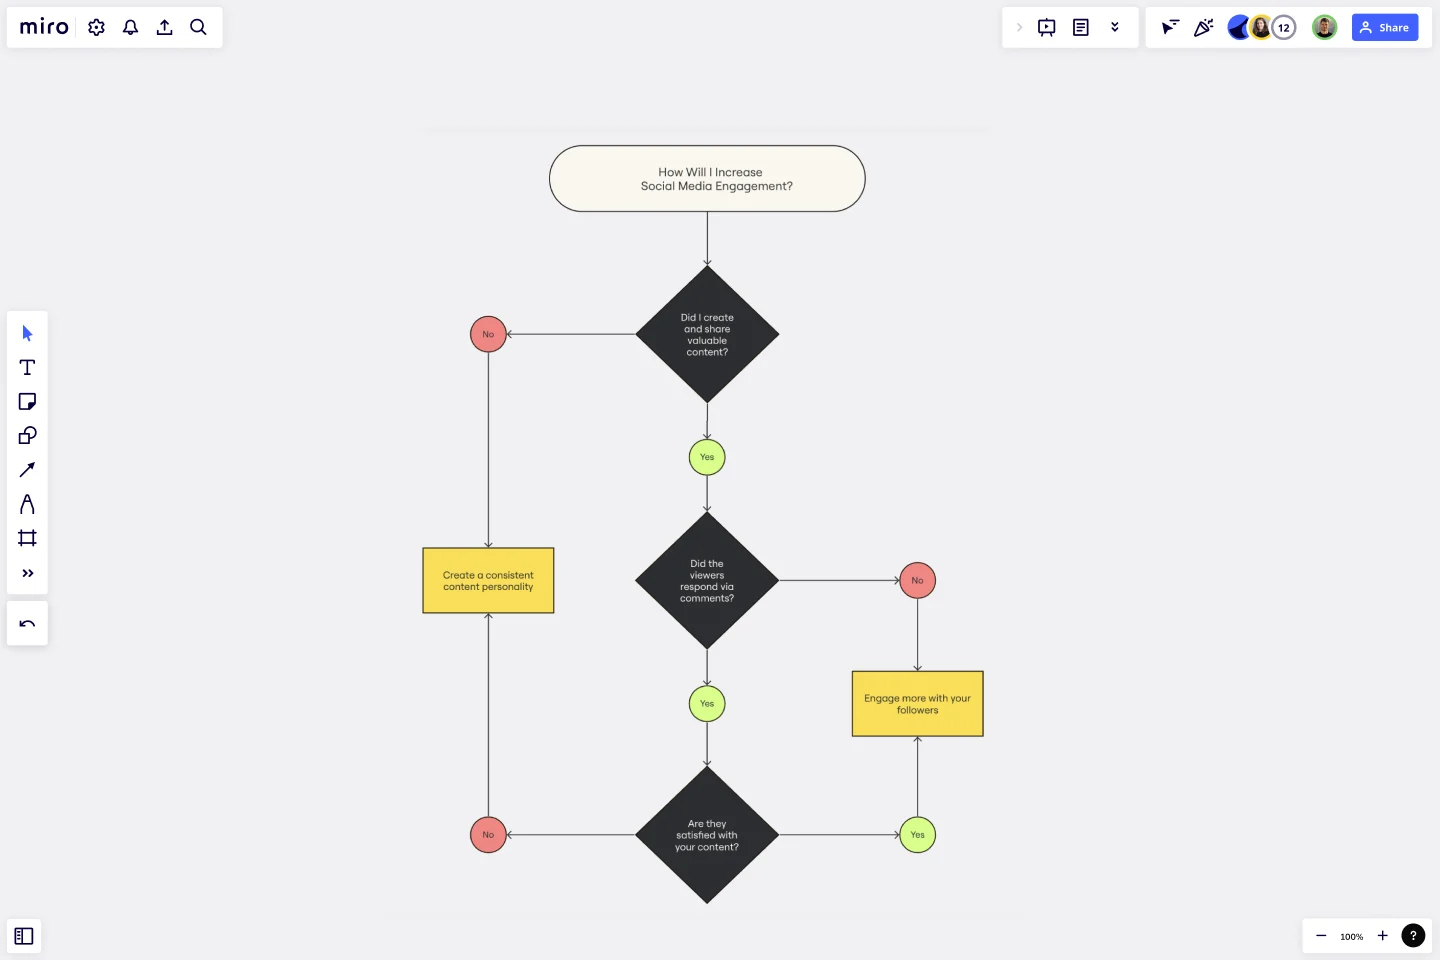
Taking a logical and systematic approach to decision-making can significantly improve the efficiency of project planning and execution. One helpful tool for this is the use of a yes-no flowchart template. These flowcharts offer an easy-to-understand way to visualize decision points and their subsequent outcomes. By using predefined graphical representations, people and teams can map out binary decisions and actions with ease.
The flowcharts use standard shapes such as rectangles, diamonds, and ovals to represent processes, decisions, and endpoints. With arrows connecting each shape, viewers can effortlessly navigate from one step to the next based on their yes or no decisions.
Overall, using yes-no flowcharts is a simple yet powerful way to streamline project planning and execution.
How to use the yes-no flowchart template
Edit easily: Start by clicking on any shape or text. Change the content to suit your specific process or decision point.
Expand the flow: If your decision-making process is more complex, add more shapes by clicking on the shape's blue dots. The automated diagramming feature ensures that connector lines adjust themselves automatically.
Add context: Enrich your flowchart by dragging any artifact onto your workspace. This can be images, documents, or links that give additional information or clarity about a particular step or decision.
Why should you use a yes-no flowchart template?
Clarity: Flowcharts break down complex processes into simple, visual steps everyone can understand. This promotes clear communication and ensures that everyone knows exactly what needs to be done.
Efficiency: Visual representations are faster and more effective in conveying processes than lengthy explanations or written documents. This helps teams to save time and effort while ensuring that nothing is overlooked.
Flexibility: Flowchart templates can be tailored to fit any process or decision-making sequence, regardless of the industry or domain. This means they can be used in various contexts and adapted to suit specific needs.
Collaboration: Flowcharts promote collaboration by allowing team members to work on, comment on, and review the same document simultaneously. This makes it easier to incorporate feedback and ensures that everyone is on the same page.
Error reduction: By mapping out all possible outcomes in advance, teams can identify potential problems and address them proactively. This helps to reduce the risk of errors, bottlenecks, and other issues that can derail a process.
If you'd prefer to diagram from scratch, Miro's easy-to-use flowchart creator will help you build an online flowchart in no time. With Miro's collaboration features, you can workshop it with your team and easily share it with others for feedback.
What shapes are commonly used in the yes-no flowchart template?
The commonly used shapes are rectangles (for processes or actions), diamonds (for decision points), and ovals (for start or endpoints). Each shape serves a distinct purpose in the flowchart.
Can I integrate external data or links into the flowchart?
Absolutely! You can drag and drop any external artifact onto the workspace. This can include, but is not limited to, images, documents, or web links.
Is the template adjustable in size and layout?
Yes, the template is fully customizable. You can adjust the size of shapes, reposition them, or change the flow direction as per your needs.
How do I share or present the completed flowchart to my team?
Once you've tailored the flowchart to your satisfaction, you can present it within the platform or export it in various formats for sharing or printing.
Get started with this template right now.
Intent to Outcome Diagram
Works best for:
Diagramming
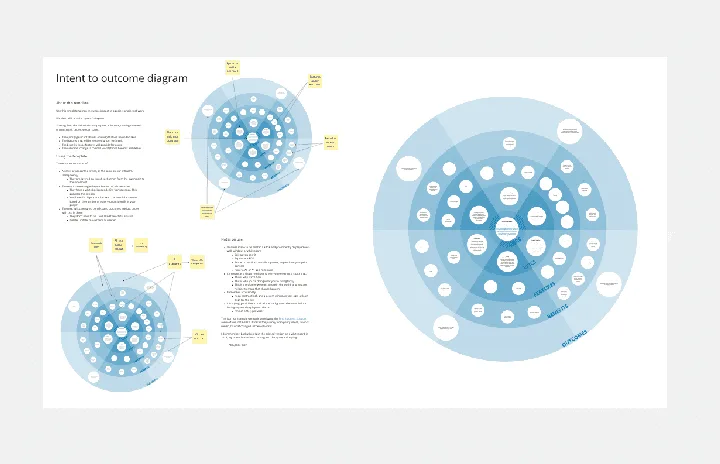
The Intent to Outcome Diagram template is a visual tool for mapping out the relationship between desired outcomes and the actions required to achieve them. It provides a structured framework for defining intentions, outcomes, and key activities. This template enables teams to align on goals, track progress, and identify areas for improvement. By promoting clarity and alignment, the Intent to Outcome Diagram empowers organizations to set strategic direction and drive results effectively.
Block Diagram Template
Works best for:
Mapping, Software Development, Diagrams
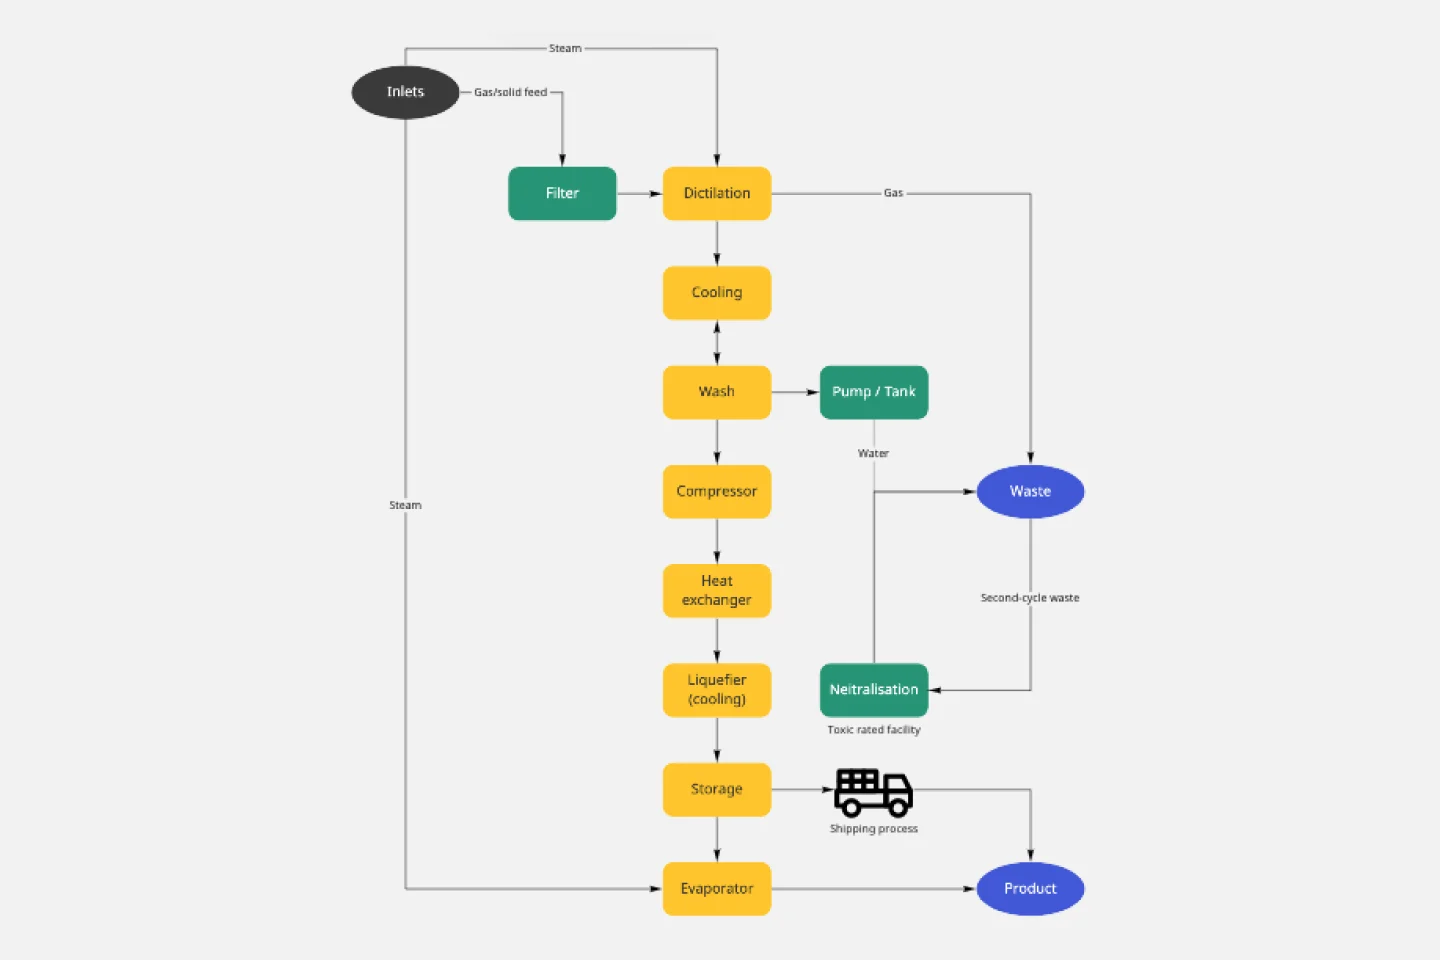
Use this template to illustrate technical systems. Blocks represent important objects in the system, and arrows demonstrate how the objects relate to each other. Perfect for engineers, workflow managers, or anyone trying to build a better process.

Stage-Gate Process Flowchart Template
Works best for:
Diagramming, Project Management
The Stage-Gate Process Flowchart Template structures a project into distinct stages separated by decision-making gates, enhancing the quality of decisions and leading to more successful project outcomes.

Onion Diagram Template
Works best for:
Diagramming, Mapping and Diagramming
The Onion Diagram Template is a distinct tool designed to visually represent layers of a specific concept, system, or process, akin to the layers of an onion. Each concentric layer of the diagram provides insights into a different aspect or phase of the topic at hand, moving from the core foundational element outwards to more peripheral components. One of the prime benefits of this template is its ability to offer hierarchical clarity. Users can immediately discern the importance, sequence, or interrelation of different elements within a system, facilitating enhanced comprehension and efficient decision-making.
Bank Mobile App User Journey
Works best for:
Diagramming
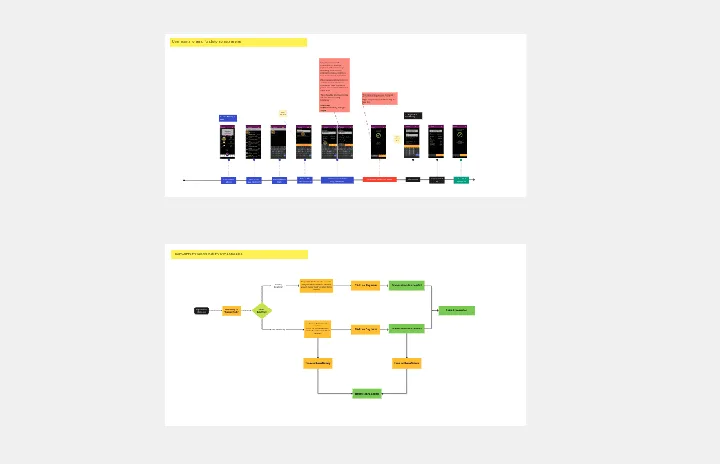
The Bank Mobile App User Journey template offers a visual framework for mapping out the user experience journey within a banking mobile application. It provides elements for visualizing user interactions, touchpoints, and emotions throughout the journey. This template enables teams to understand user needs, pain points, and opportunities for improvement, facilitating the design of user-friendly and intuitive banking apps. By promoting empathy and user-centric design, the Bank Mobile App User Journey template empowers teams to create digital experiences that meet customer expectations and drive engagement.
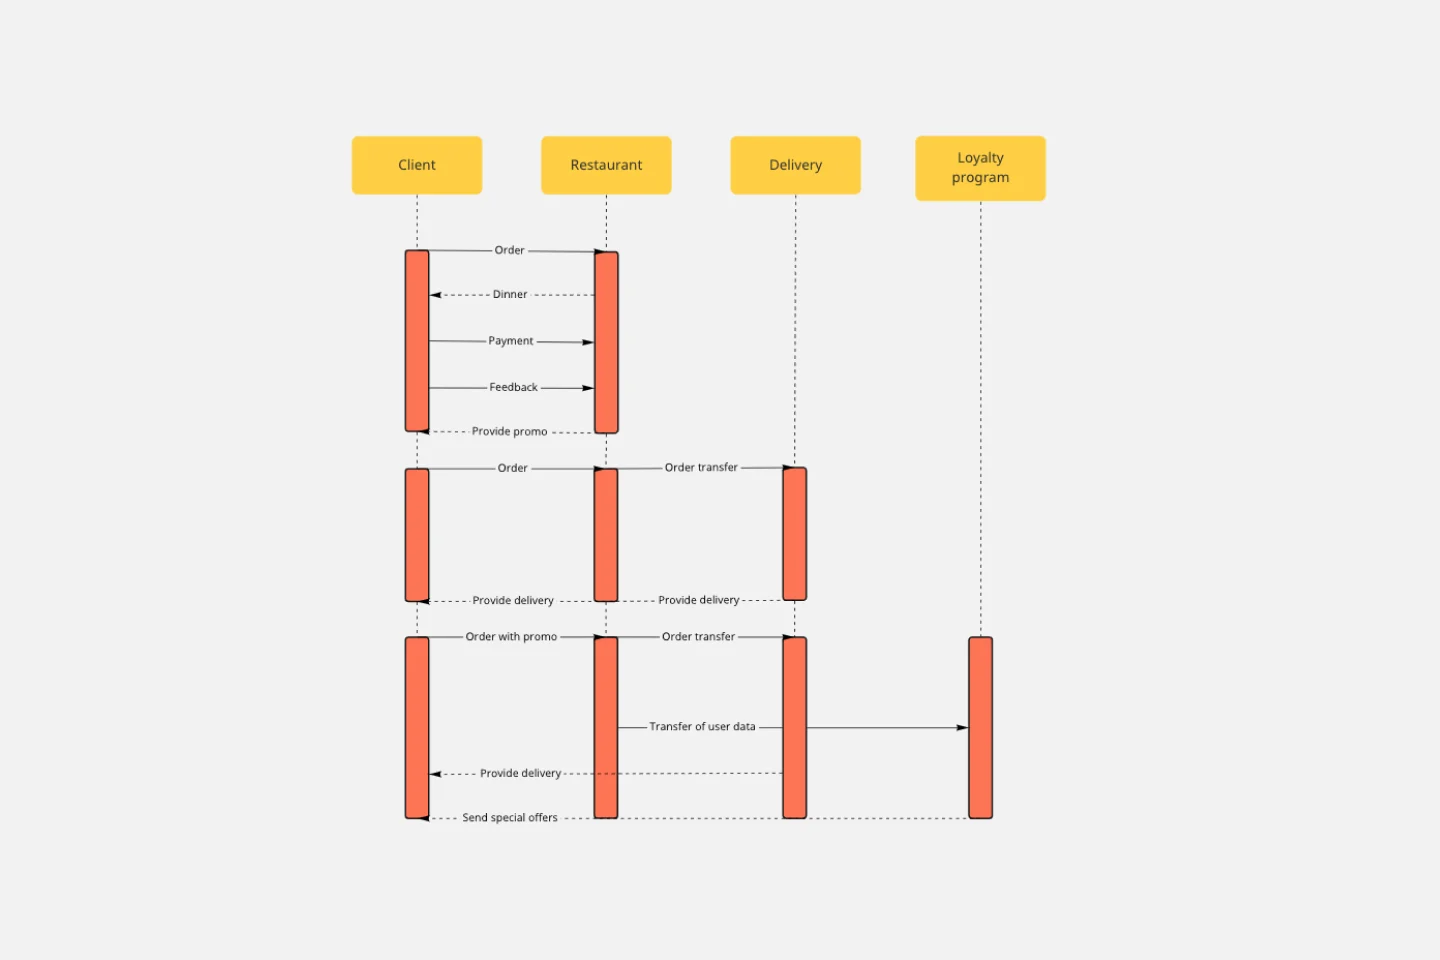
UML Sequence Diagram Template
Works best for:
Software Development, Mapping, Diagrams
Analyze and showcase how external entities interact with your system using a sequence diagram. Get a bird’s-eye view of your work processes, business functions, and customer interactions using this diagram. Also, identify any potential problems early and solve them before implementation.