Workflow Diagram Template
Bring clarity to teams with the workflow diagram template. By translating processes in a visual way, everyone gains a comprehensive understanding, reducing complexity and maximizing efficiency.
Trusted by 65M+ users and leading companies


About the Workflow Diagram Template
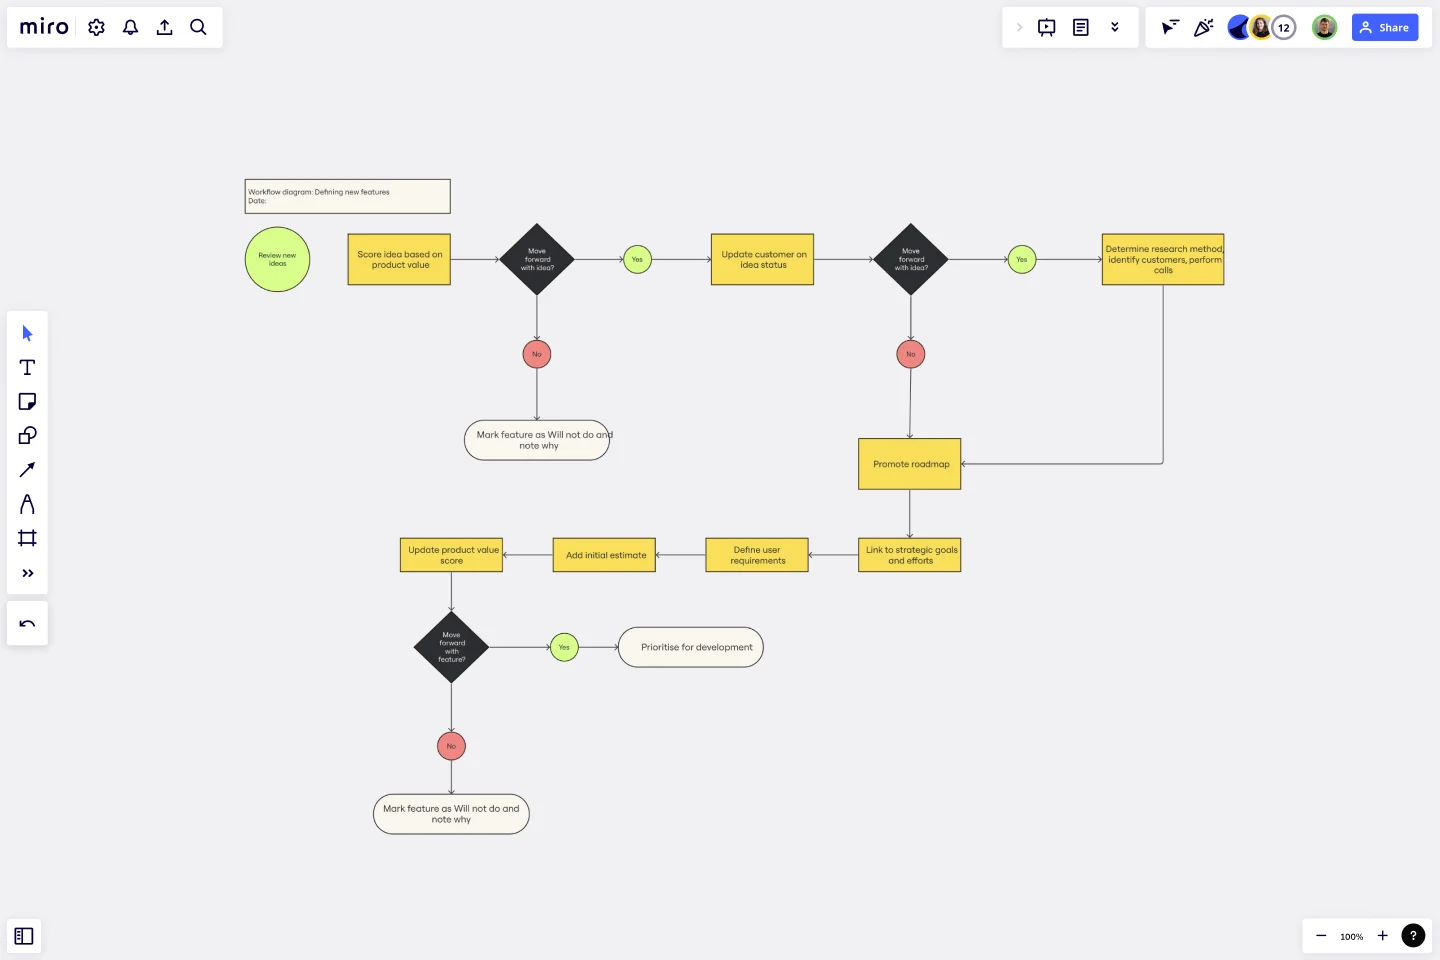
When seeking clarity in processes, visual assets often come to the rescue. Enter the workflow diagram template. This tool is designed to streamline operations, elucidate roles, and illuminate the path from task initiation to completion. It's a bridge between mere ideas and actual, tangible results, ensuring seamless progress for projects of all scales.
Using standardized symbols and shapes, the workflow diagram template depicts a process's various steps or stages and the flow of tasks between them. This is crucial for understanding, analyzing, and optimizing processes to enhance efficiency and ensure clarity among all team members.
How to use the workflow diagram template?
1. Add the template
Select the template in the Templates Library.
2. Customize it
Tailor the template to your needs effortlessly. Add, remove, or rearrange stages and steps by clicking on the shapes and connection lines. Edit color, font, and shape size using the context menu bar above the shape.
3. Expand your workflow diagram
As your process grows or changes, click on the shapes to expand or adapt your diagram.
4. Embed artifacts
Enhance your workflow diagram by adding any required artifacts. Be it documents, images, links, or notes – integrate them by uploading via a link or with the drag and drop feature.
Why should you use a workflow diagram template?
Increase clarity and understanding: By visually representing tasks and the flow between them, everyone gets a clearer picture of what needs to be done and how.
Optimize processes: Visualizing a process can help identify redundancies, bottlenecks, and inefficiencies. Once identified, steps can be rearranged, removed, or streamlined as needed.
Promote consistency: A standardized process ensures that tasks are executed consistently, resulting in predictable outcomes.
Increase collaboration: By laying out the entire process, team members can see where their tasks fit into the bigger picture, fostering collaboration and unity.
Use as a training tool: For newcomers or those unfamiliar with the process, a visual workflow can act as a guide, helping them learn and understand their roles and responsibilities faster.
Using process mapping software can be a game changer when you need to connect teams, optimize business processes, and scale your organization.
Is the template suitable for complex processes?
The template can be expanded and customized to cater to simple and complex processes. The automated diagram feature ensures that complexity doesn't interfere with clarity.
Can multiple team members work on the template simultaneously?
The platform supports real time collaboration, allowing multiple team members to edit, comment, and view the diagram simultaneously.
Can I integrate the workflow diagram with other tools?
Yes, the platform offers seamless integration capabilities, allowing you to link your workflow diagram with other tools and platforms you might be using, making it a central hub for all your process-related needs.
Get started with this template right now.
Web Diagram Template
Miro's Web Diagram Template simplifies complex project organization and promotes effective communication. It allows users to easily connect elements and gain a comprehensive understanding of complex relationships, making it a versatile and invaluable asset for diverse projects.
SDLC Template
Works best for:
Diagramming
The Software Development Life Cycle (SDLC) template is a well-designed visual tool that helps software development teams follow a structured approach from the initial concept to the final deployment of the software. One of the most significant benefits of using this template is that it promotes clear, streamlined communication among team members. By breaking the development cycle into distinct phases, all stakeholders can stay informed about the progress of the project and understand their responsibilities within the larger context. This enhanced communication reduces the chances of misunderstandings and ensures that everyone works together towards the common goal of delivering high-quality software. The template acts not only as a roadmap but also as a shared language for the team, improving collaboration and the efficient progression of the project through each critical stage.
Outcome Mapping Template
Works best for:
Diagrams, Mapping, Project Management
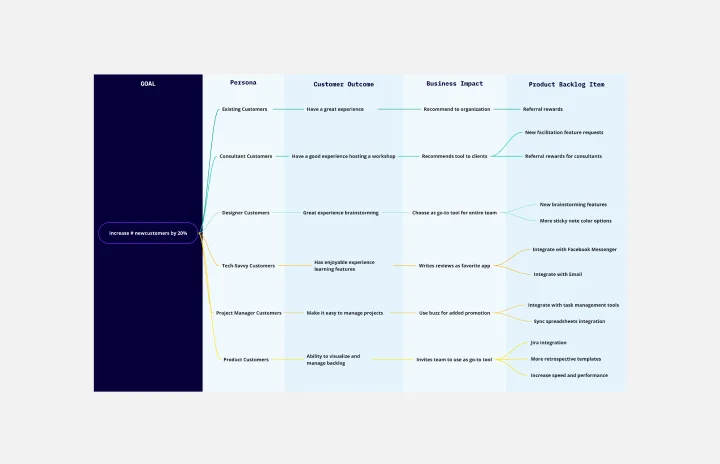
Use Miro’s outcome mapping template to improve your operational efficiency. Outcome mapping will help you visualize all the possible strategic outcomes for your upcoming project, allowing you to see into the black box to identify any potential challenges along the way.
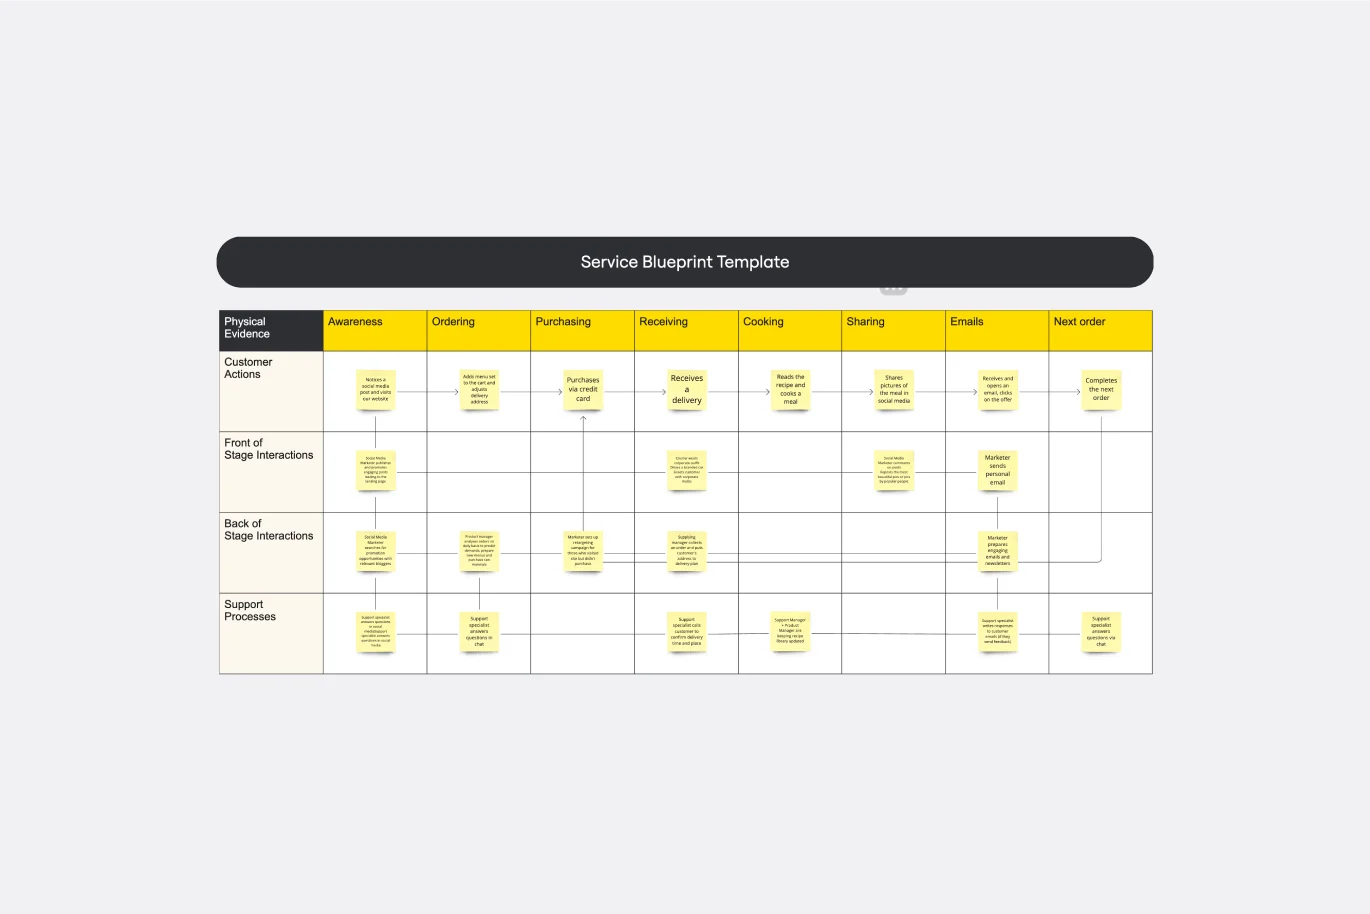
Service Blueprint Template
Works best for:
Desk Research, Operations, Market Research
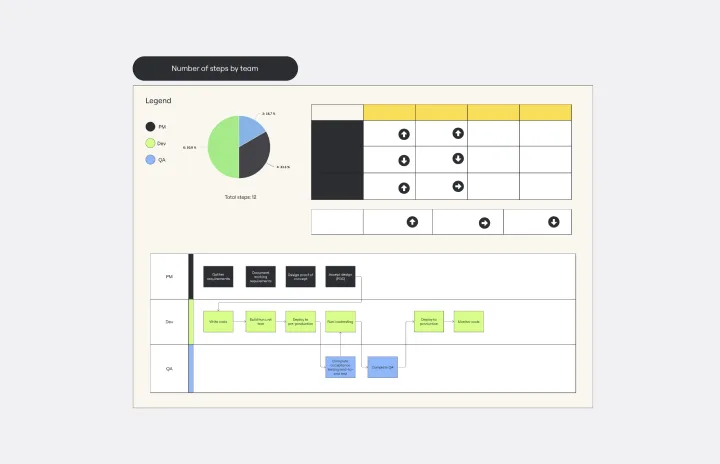
First introduced by G. Lynn Shostack in 1984, service blueprints allow you to visualize the steps that go into a service process from the customer’s perspective. Service blueprints are useful tools for understanding and designing a service experience – and finding ways to improve it. Service blueprint diagrams make it simpler for teams to design new processes or improve existing ones. To create a service blueprint, map out each process and actor that contributes to the customer experience, from in-house contributors to third-party vendors.

3-Circle Venn Diagram
Works best for:
Education, Diagrams, Brainstorming
Venn diagrams have been a staple of business meetings and presentations since the 1800s, and there’s a good reason why. Venn diagrams provide a clear, effective way to visually showcase relationships between datasets. They serve as a helpful visual aid in brainstorming sessions, meetings, and presentations. You start by drawing a circle containing one concept, and then draw an overlapping circle containing another concept. In the space where the circles overlap, you can make note of the concepts’ similarities. In the space where they do not, you can make note of their differences.
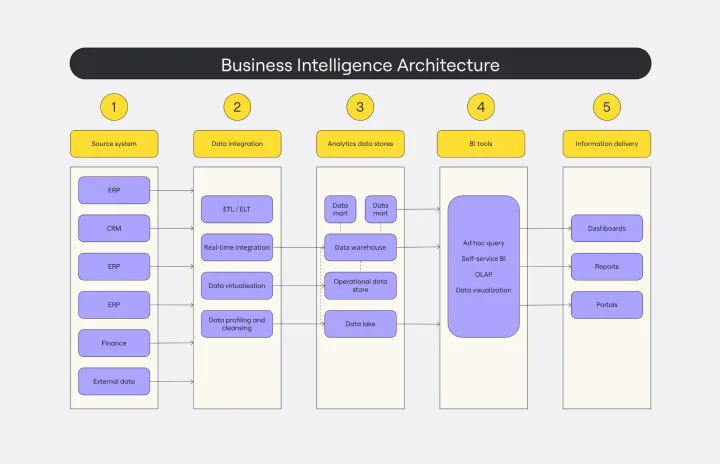
Business Intelligence Architecture Template
Works best for:
Diagramming
The Business Intelligence Architecture Diagram Template in Miro visually maps the complex landscape of business intelligence systems. With elements encompassing data sources, warehouses, ETL processes, tools, and end-user interfaces, the template enables users to communicate complex concepts with clarity. One standout feature is the template's dynamic adaptability, empowered by Miro's automated diagramming capabilities. This feature ensures that the diagram remains up-to-date with minimal effort, allowing users to effortlessly incorporate changes in data structures and processes, thus maintaining the relevance and accuracy of their visual representations over time.