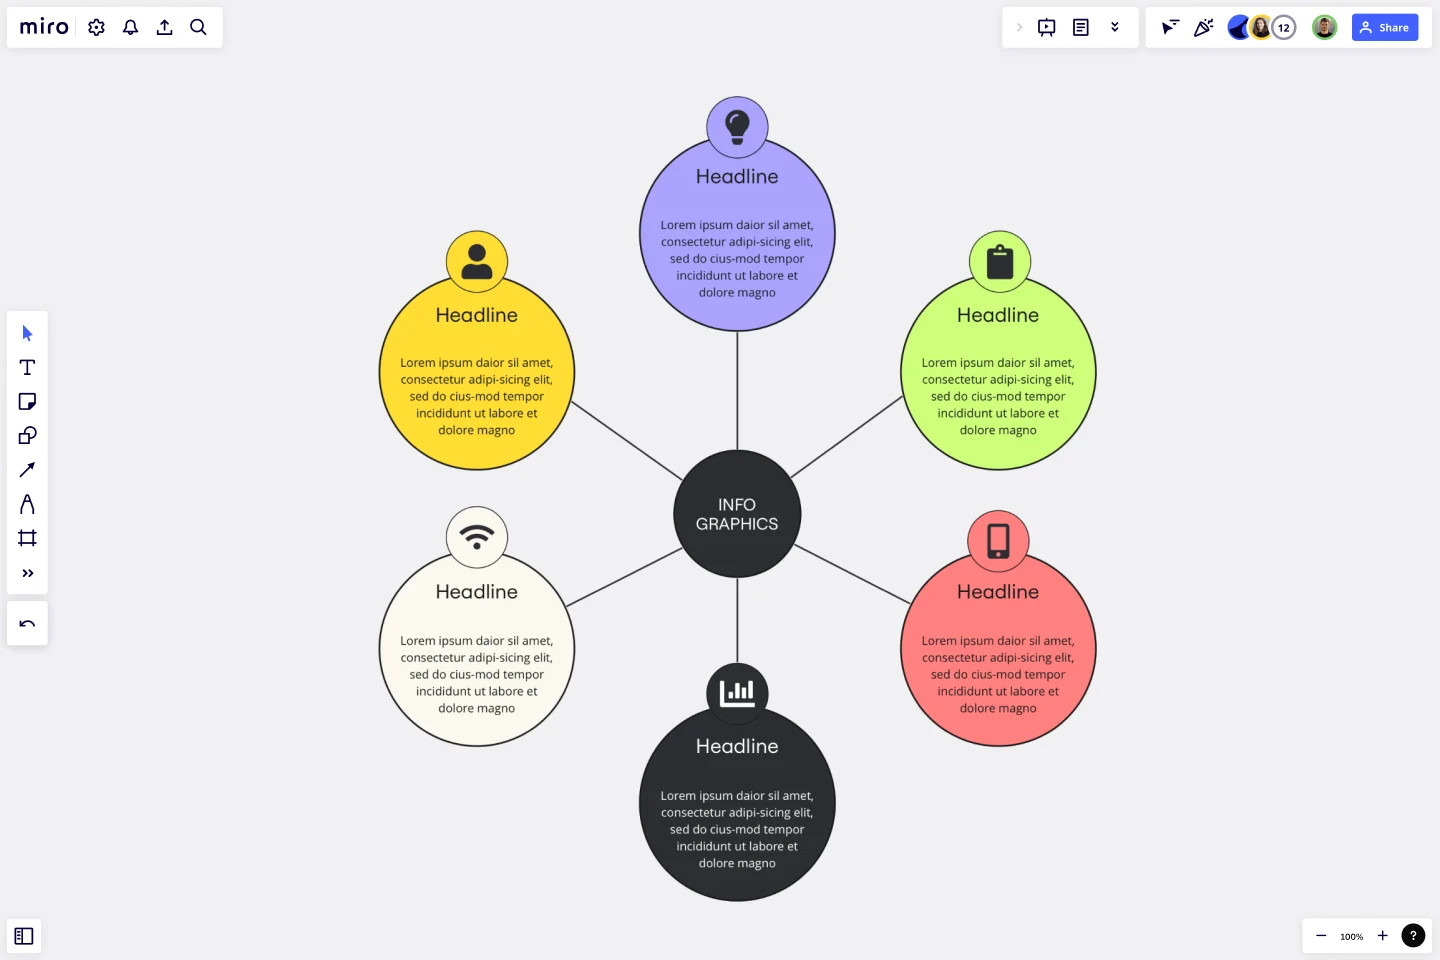
Web Diagram Template
Effortlessly interconnect elements and bring clarity to your ideas across diverse projects with the web diagram template.
Trusted by 65M+ users and leading companies


About the Web Diagram Template
The web diagram template is a useful visual tool that works like a spider diagram. It helps in connecting various elements to create a comprehensive visual story. Whether you are working on web projects, brainstorming sessions, or strategic planning, this template can help you explore and weave a network of ideas that is clear and coherent. It helps in presenting your concepts in a more organized and easy-to-understand manner.
Understanding the web diagram template
The web diagram template is an adaptable canvas that enables you to delineate relationships and connections among diverse elements, encouraging a comprehensive overview of your ideas. The template's flexibility makes it a valuable asset for various projects, allowing you to navigate complexities and showcase the intricate web of relationships inherent in any concept or strategy.
How to use the web diagram template in Miro
Easy editing: Customize your diagram easily by adding, removing, or repositioning elements. Miro's intuitive interface ensures seamless editing with just a few clicks.
Flexible diagram: As your project progresses, dynamically expand your diagram. The template accommodates the growth of your ideas, ensuring your interconnected web remains a vivid and accurate representation.
Add context: Enhance your diagram with contextual artifacts such as notes, comments, or attachments. This adds depth and clarity, ensuring your visual narrative is informative and interconnected.
Why should you use a web diagram template?
Clear relationships: Demonstrate the connections between different elements to help you better understand your concepts.
Flexible: It can be applied to various scenarios where interconnectedness is essential.
Efficient creation: Use Miro's automated diagramming tools to save time and effort while creating your interconnected web.
Collaborative space: Foster a collaborative environment where team members can contribute and provide insights into the interconnected nature of your ideas.
Adaptability: Navigate through the complexity of any project, adapting your interconnected web as it evolves to ensure relevance and accuracy.
Can I collaborate in real-time on the web diagram with team members?
Yes, Miro's real-time collaboration features allow multiple users to work seamlessly on the same diagram, fostering teamwork and shared insights.
How does the web diagram template maintain clarity as the diagram expands?
Miro's automated diagramming features intelligently adjust as you expand your interconnected web, ensuring that clarity is maintained throughout the evolution of your visual narrative.
Get started with this template right now.
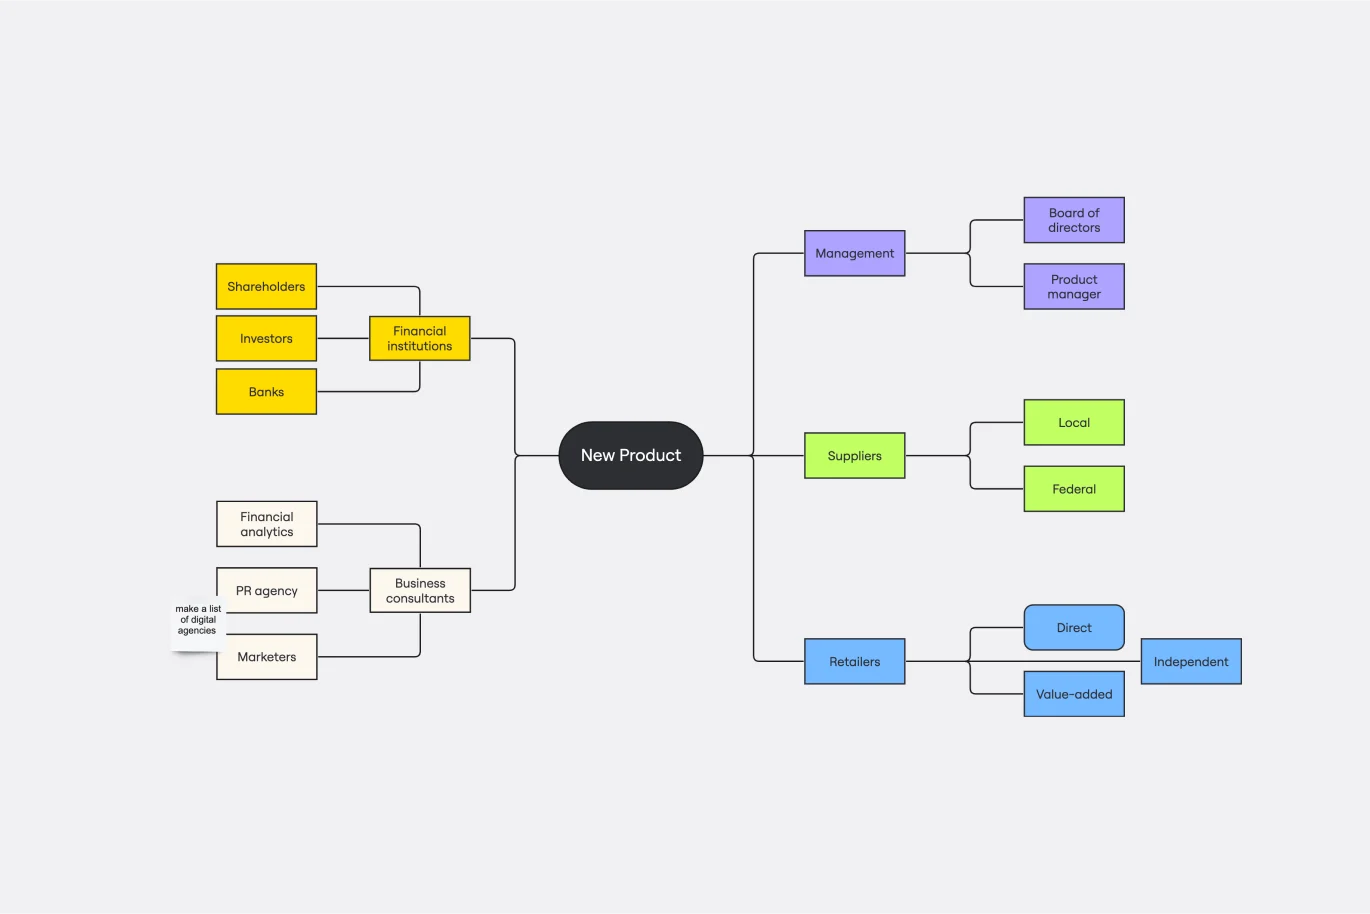
Stakeholder Mapping Template
Works best for:
Business Management, Mapping, Workflows
A stakeholder map is a type of analysis that allows you to group people by their power and interest. Use this template to organize all of the people who have an interest in your product, project, or idea in a single visual space. This allows you to easily see who can influence your project, and how each person is related to the other. Widely used in project management, stakeholder mapping is typically performed at the beginning of a project. Doing stakeholder mapping early on will help prevent miscommunication, ensure all groups are aligned on the objectives and set expectations about outcomes and results.
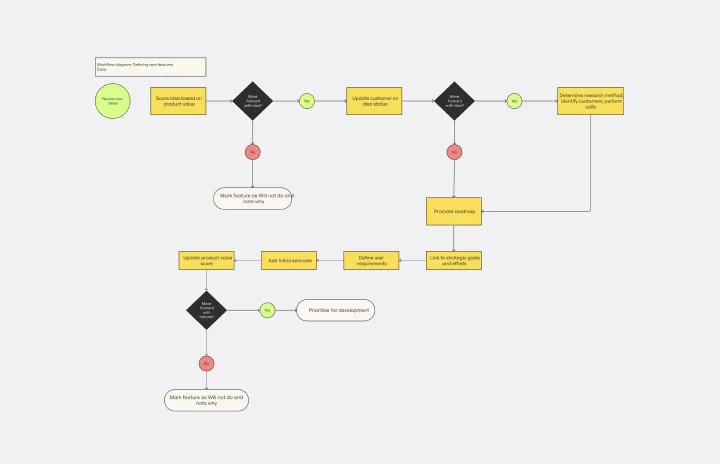
Workflow Diagram Template
Works best for:
Diagramming, Mapping, Process mapping
The Workflow Diagram Template maps out and represents processes or systems using standardized symbols and shapes. By delineating the various steps or stages in a process, it ensures that tasks flow seamlessly from initiation to completion. One of the standout benefits of using this template is its clarity. By translating processes into a visual format, all participants can gain a comprehensive understanding at a glance, eliminating confusion and ensuring everyone is on the same page. This clarity not only promotes efficient task execution but also fosters collaboration among team members.
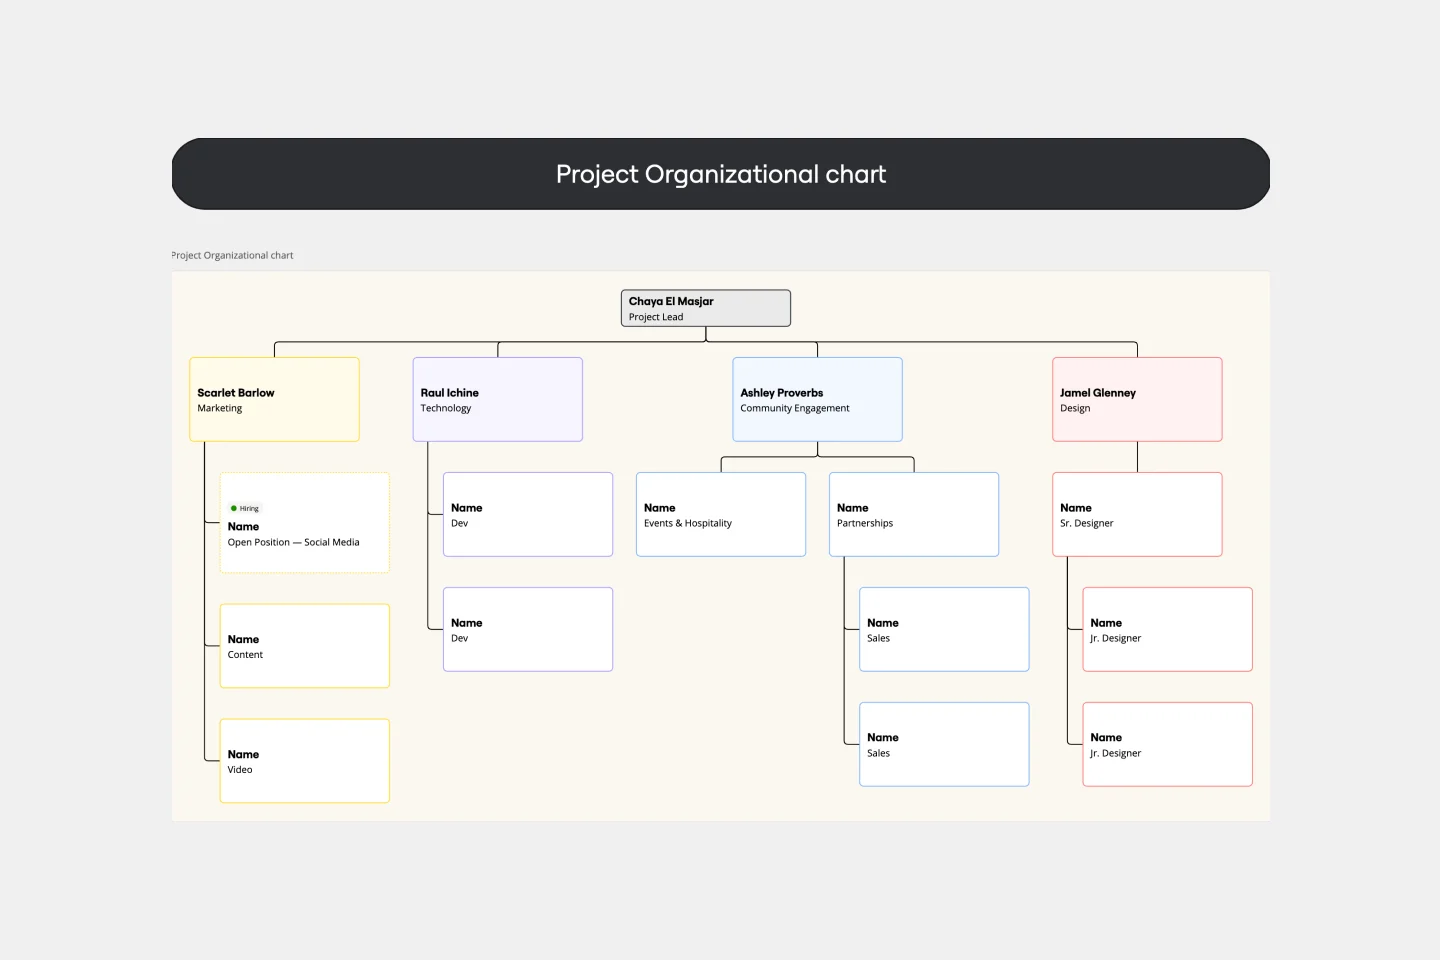
Project Organizational Chart Template
Works best for:
Project Management, Documentation, Org Charts
When you’re embarking on a long, complex project, you will inevitably hit roadblocks and obstacles. It’s important to have your project organizational chart on hand to overcome those challenges. A project organizational chart is a visual diagram that illustrates who is on your team and the role they play in a given project. It documents the structure of the project organization, the hierarchy between team members, and the relationships between employees. Project organizational charts are useful tools for clarifying who does what, securing buy-in, and setting expectations for the group.
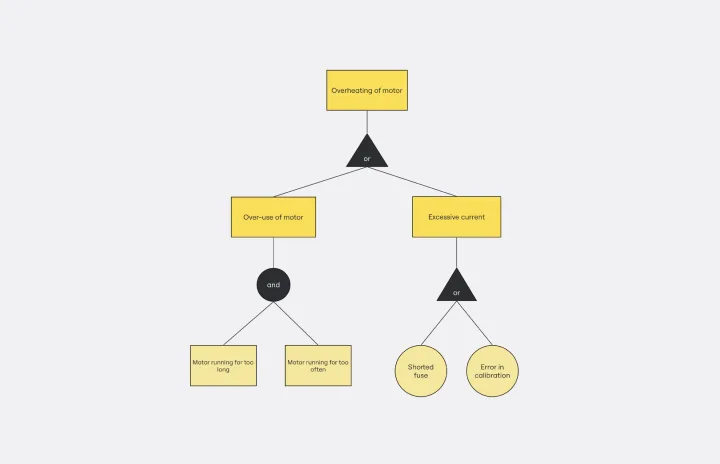
Fault Tree Analysis Template
Works best for:
Diagramming
The Fault Tree Analysis Template visually breaks down potential system malfunctions, highlighting complex causal relationships between faults. One of its standout benefits is its ability to enhance clarity in complex scenarios, allowing professionals to swiftly pinpoint root causes and prioritize interventions, ensuring a more streamlined approach to problem-solving.
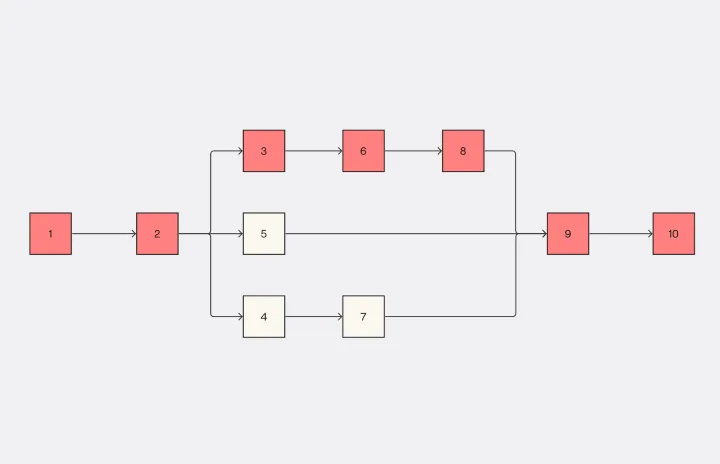
Critical Path Method Template
Works best for:
Diagramming, Project Management
Elevate your project management game with the Critical Path Method Template—an indispensable tool that brings clarity and precision to your project timelines. The template instantaneously adjusts as you edit tasks and dependencies, ensuring that your critical path is consistently up-to-date. This capability not only simplifies the complex process of project scheduling but also empowers your team to proactively respond to evolving project dynamics, fostering adaptability and efficiency throughout the project lifecycle.
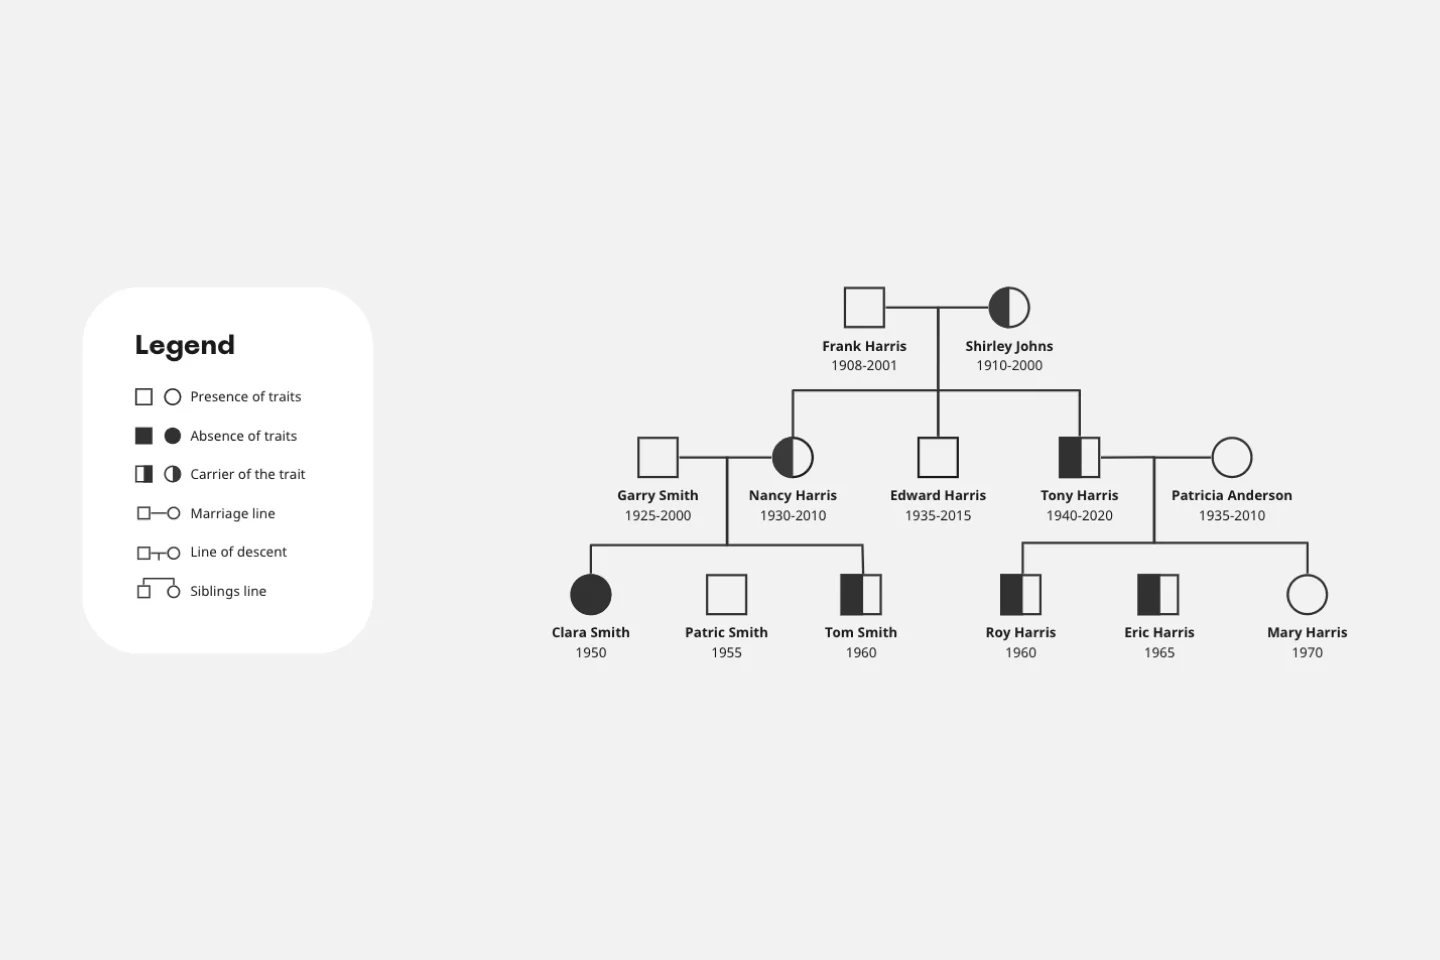
Pedigree Diagram Template
Works best for:
Diagrams, Education
Use our Pedigree Diagram Template to show how traits and diseases are passed from one generation to the next. Whether you’re a doctor, farmer, or just someone interested in genetics, a Pedigree Diagram can help you identify hereditary traits.