VRIO Analysis Template
Use the VRIO analysis template to evaluate your business's resources for a competitive edge.
Trusted by 65M+ users and leading companies


About the VRIO Analysis Template
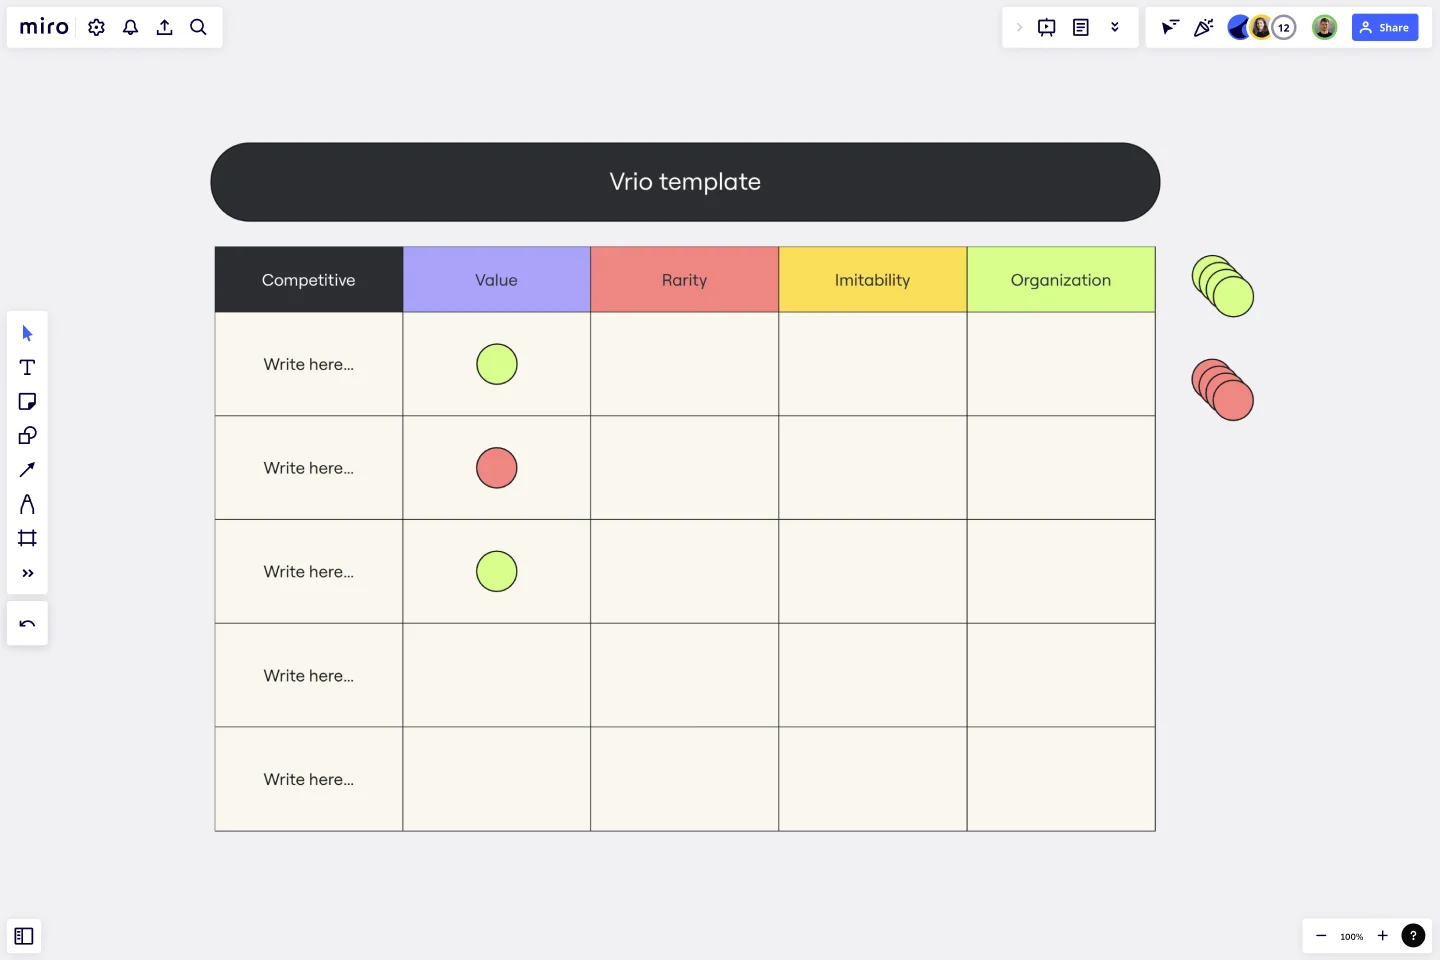
The VRIO analysis template is an intuitive tool that helps businesses and people determine their competitive potential. This analytical framework evaluates the capacity of organizational resources to provide a competitive advantage by focusing on four main components:
Value:
Meaning: Assesses if a resource or capability allows a firm to exploit an opportunity or neutralize a threat.
How to Use: List down all the firm's resources and capabilities and then determine which ones add real value regarding opportunities or threats.
Rarity:
Meaning: Measures the uniqueness or scarcity of a resource.
How to Use: Evaluate if the identified valuable resources are rare or common in the industry. If it's common, it might not provide a competitive edge.
Imitability:
Meaning: Determines how easily competitors can replicate or imitate the resource.
How to Use: Examine the resources that are both valuable and rare. For each, determine if competitors can easily imitate them. If they can't, it's a competitive advantage.
Organization:
Meaning: Evaluates if the firm is structured to capture value from its resources.
How to Use: Review the company's structure, culture, and processes to ensure that the resources that are valuable, rare, and inimitable are being utilized optimally.
By understanding and applying these areas in the template, businesses can ensure that their resources and capabilities are aligned to yield the maximum competitive advantage.
How to use the VRIO analysis template?
Edit with ease: With just a few clicks, one can easily change text, adjust components, or customize areas according to specific needs.
Expand and connect: Benefit from automated diagramming features. Add more sections, adjust sizes, or create connector lines effortlessly to expand the template's structure.
Add more context: Introduce any artifact to the board to provide additional context, be it images, documents, links, or any other relevant item.
Why should you use a VRIO analysis template?
Comprehensive analysis: It provides a structured way to evaluate resources and capabilities systematically.
Enhanced decision-making: By understanding strengths and weaknesses, businesses can make more informed strategic choices.
Quick visualization: Instead of a lengthy analysis, the chart provides a visual representation, making it easier to grasp and share.
Customization: The template can be tailored to fit the specific needs and nuances of any organization.
Consistent evaluation: Using the template ensures a uniform method of evaluating resources across various departments or periods.
What's the primary purpose of the VRIO analysis template?
The primary purpose is to help businesses and people determine their potential for a competitive advantage by analyzing their resources and capabilities.
Do I need any prior knowledge of VRIO to use the template?
No, the template is intuitive and designed to guide users through the analysis process, regardless of their familiarity with VRIO.
Can I customize the VRIO Analysis Template to suit my organization's branding?
Absolutely! The template is fully customizable, allowing you to adjust colors, fonts, and layouts to match your organization's branding.
Can other analytical tools be integrated with the VRIO analysis template?
Yes, the flexible nature of the template allows integration with other tools and analytical frameworks, enhancing its depth and applicability.
Get started with this template right now.
Fishbone Diagram Template
Works best for:
Operations, Diagrams, Workflows
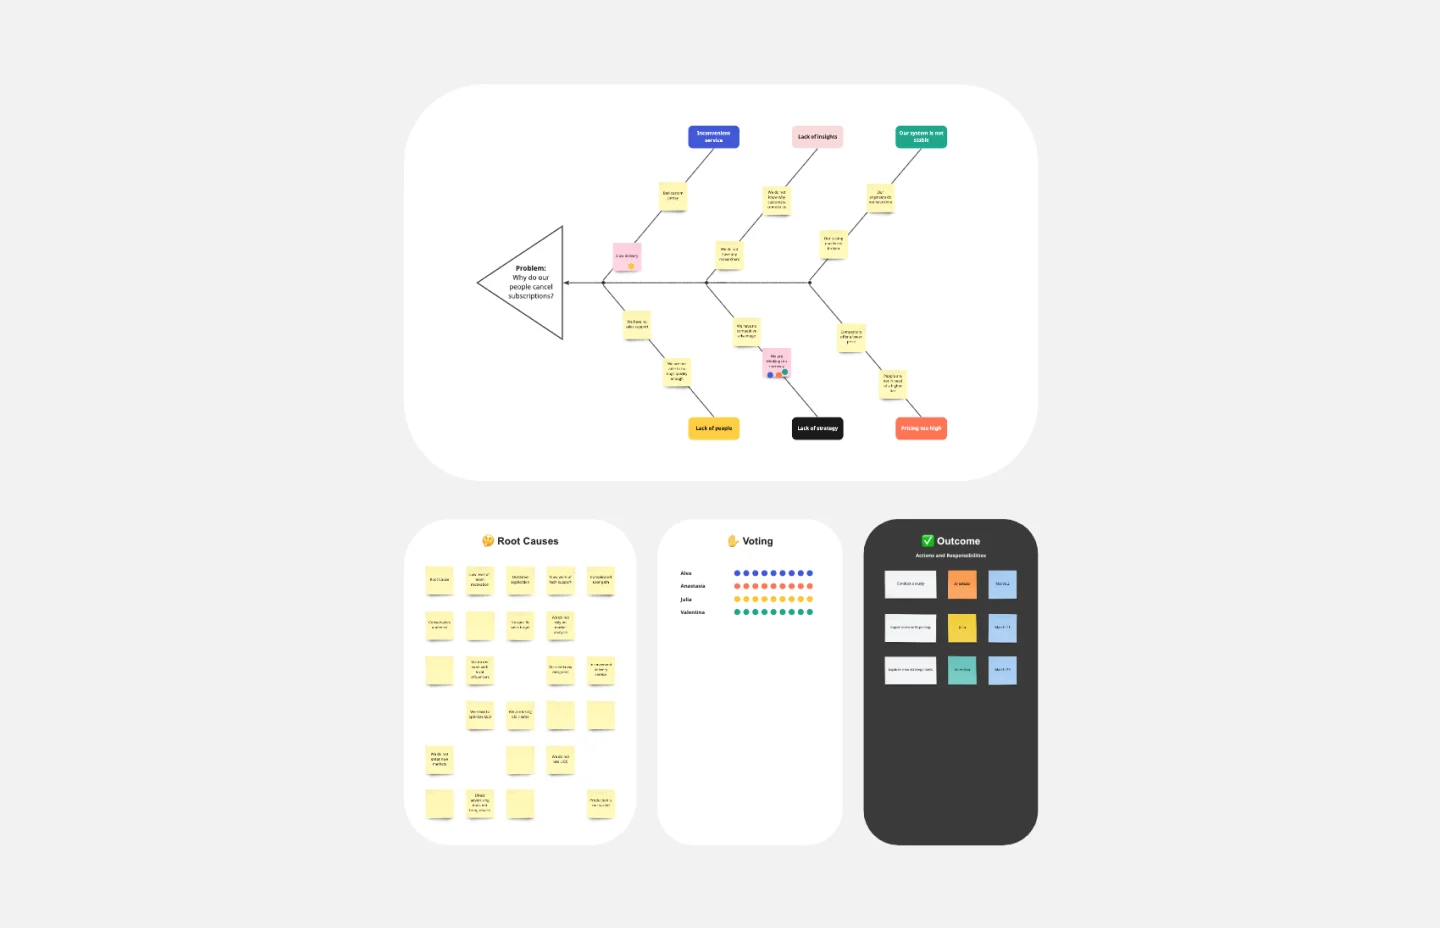
What is the best way to solve any problem your team faces? Go straight to the root. That means identifying the root causes of the problem, and fishbone diagrams are designed to help you do it best. Also known as the Ishikawa Diagram (named after Japanese quality control expert Kaoru Ishikawa), fishbone diagrams allow teams to visualize all possible causes of a problem, to explore and understand how they fit together holistically. Teams can also use fishbone diagrams as a starting point for thinking about what the root cause of a future problem might be.
Logic Model Template
Works best for:
Diagramming
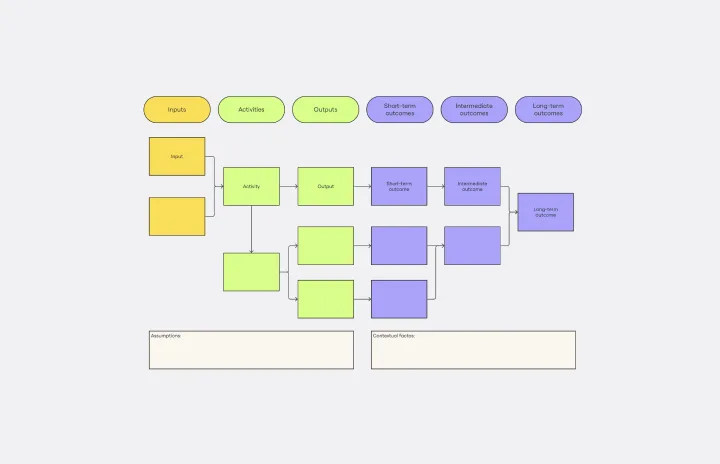
The logic model template is a strategic visual tool designed to delineate the relationship between a program's inputs, activities, outputs, and outcomes. By providing a clear and comprehensive map of the project lifecycle, stakeholders can swiftly grasp the intricate connections within a given initiative. One standout benefit of this template is its ability to enhance clarity: by visually representing the transformation of resources into anticipated results, teams can ensure more efficient and targeted use of their resources, thus maximizing the potential for success in their endeavors.
Sitemap Template
Works best for:
Mapping, Software Development, Diagrams
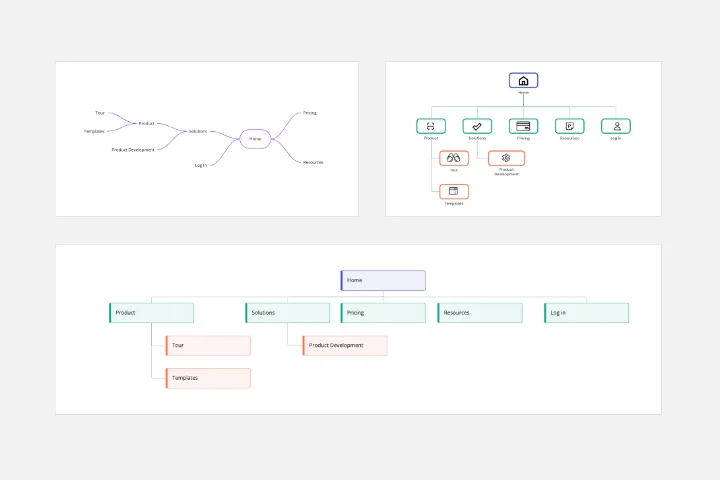
Building a website is a complex task. Numerous stakeholders come together to create pages, write content, design elements, and build a website architecture that serves a target audience. A sitemap is an effective tool for simplifying the website design process. It allows you to take stock of the content and design elements you plan to include on your site. By visualizing your site, you can structure and build each component in a way that makes sense for your audience.

Driver Diagram Template
Works best for:
Diagramming
The driver diagram template is a strategic visual tool that helps teams map out their primary objectives and break them down into actionable components. It presents goals, drivers, and specific change ideas in a coherent and interconnected format, ensuring clarity of objective. By doing so, every team member is aligned towards a common endpoint, fostering unified efforts. The visual nature of the template simplifies complex objectives, making it easier for teams to stay on track and measure their progress effectively.
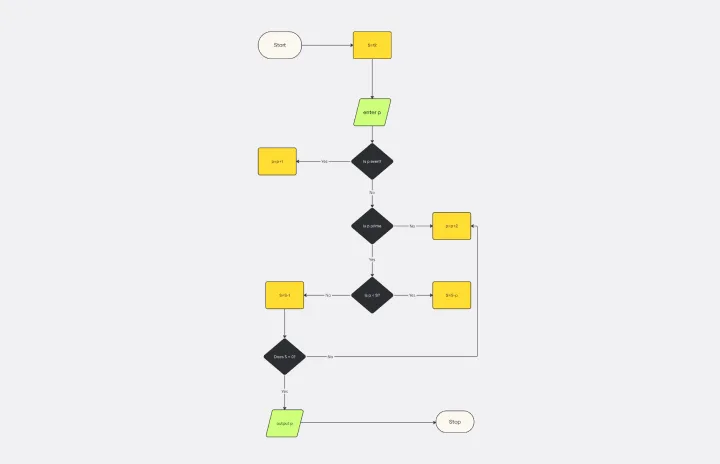
Algorithm Flowchart Template
Works best for:
Diagramming, Flowcharts
The Algorithm Flowchart Template is a useful tool for simplifying the process of creating and understanding complex algorithms. Its pre-structured format makes it easy to lay out each operation and decision point in a clear and easily understandable visual format. This is particularly helpful for explaining intricate processes to team members who may not be as technically proficient in the subject matter. With each step clearly defined within its designated shape, the flowchart promotes clarity and makes it easy to identify the logical flow at a glance. This clarity is the template's most significant advantage, reducing cognitive load and enabling a more inclusive and straightforward approach to discussing and refining algorithmic solutions.
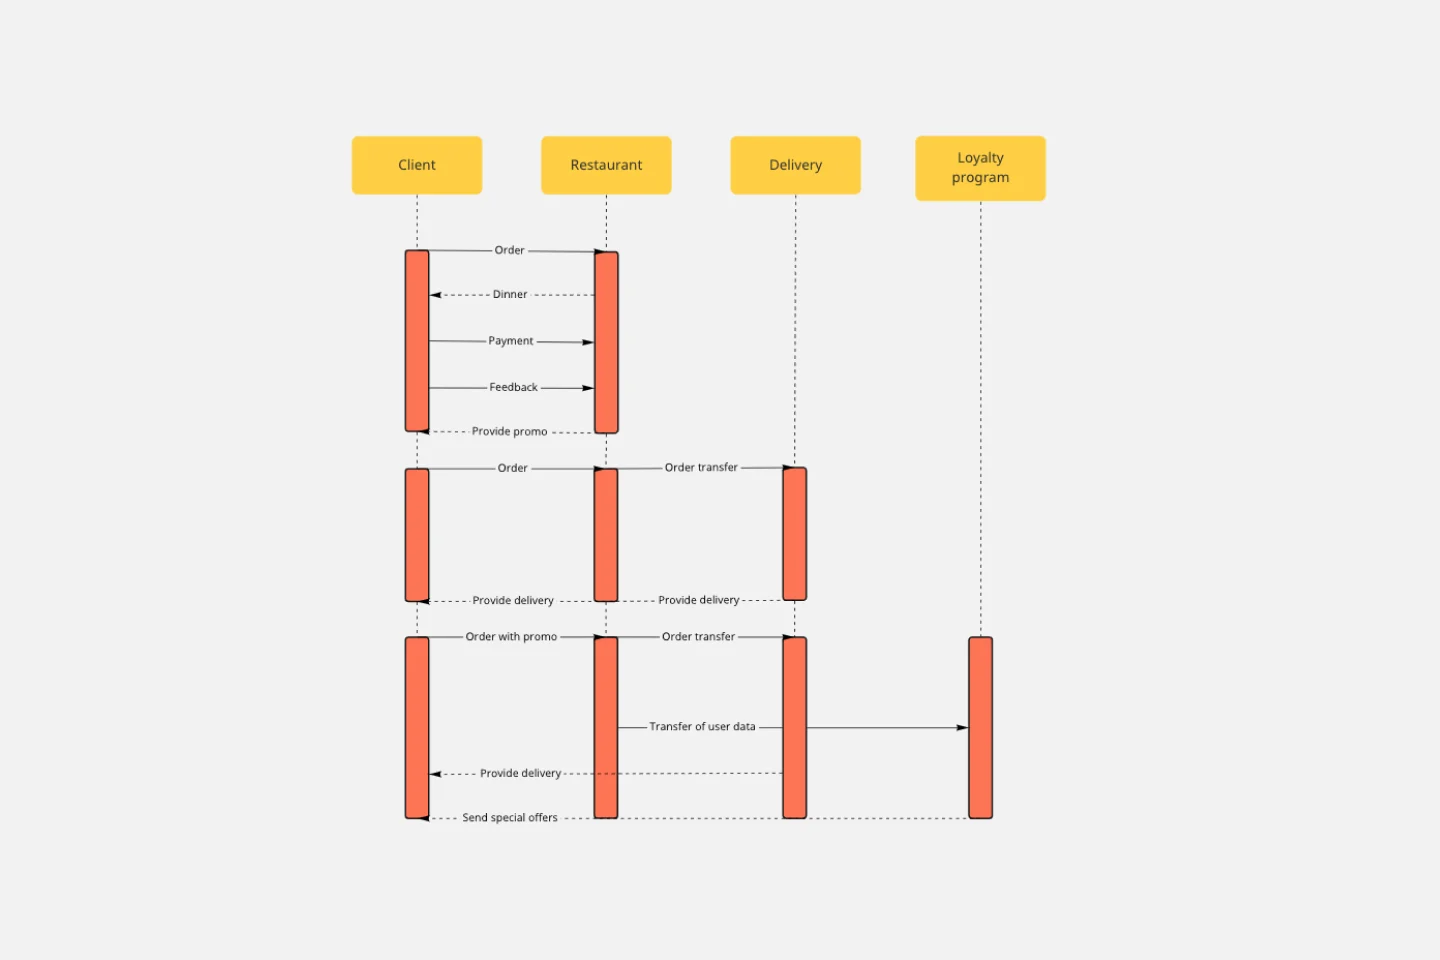
UML Sequence Diagram Template
Works best for:
Software Development, Mapping, Diagrams
Analyze and showcase how external entities interact with your system using a sequence diagram. Get a bird’s-eye view of your work processes, business functions, and customer interactions using this diagram. Also, identify any potential problems early and solve them before implementation.