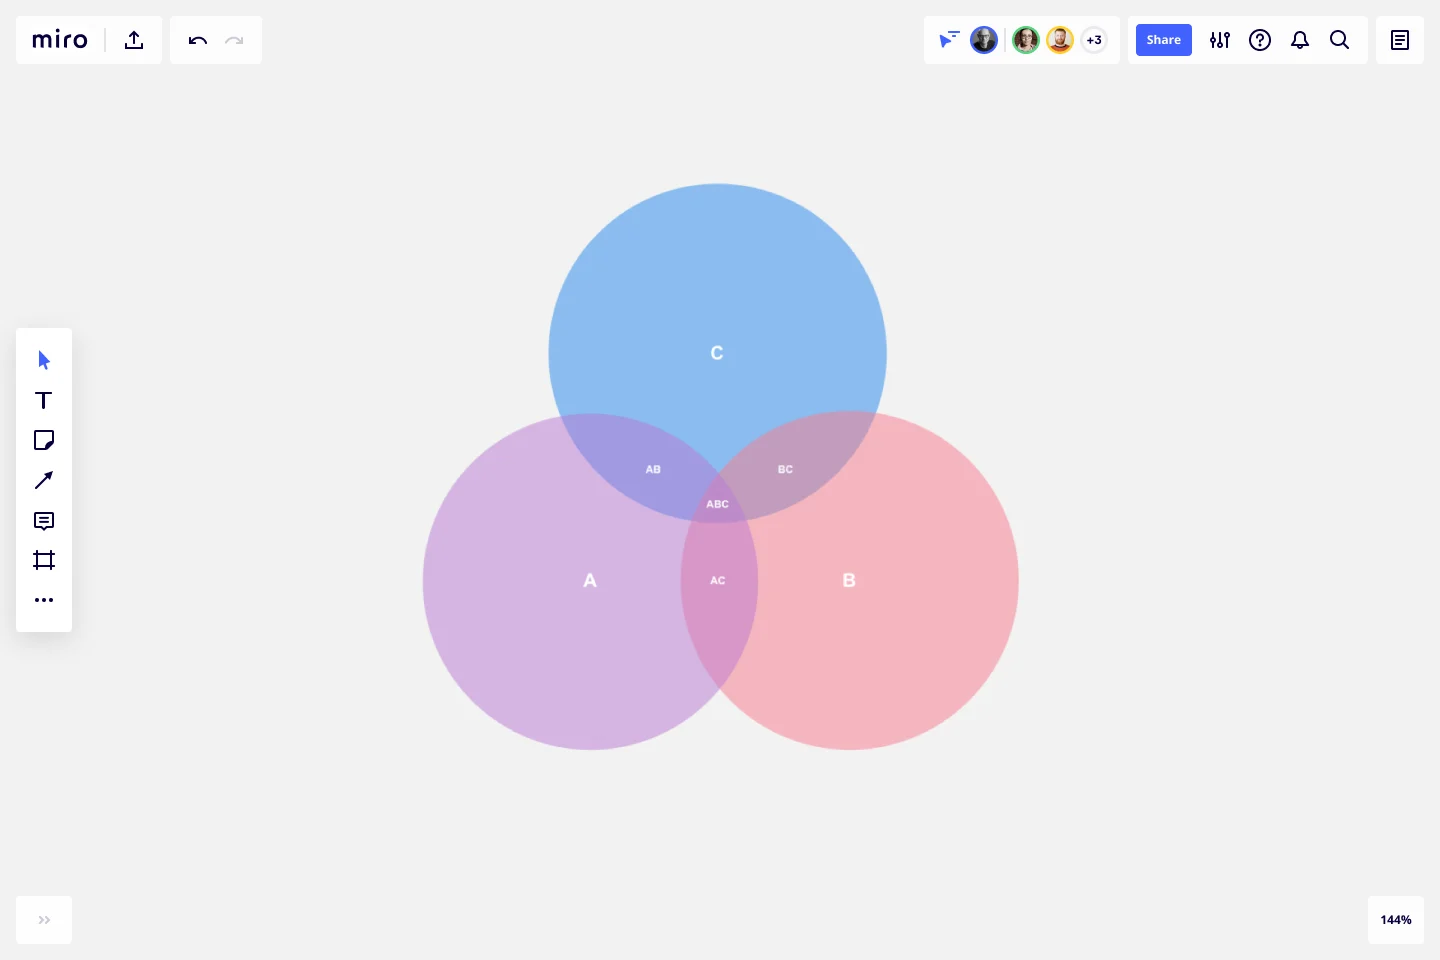
3-Circle Venn Diagram
Visually understand the relationships, similarities, and differences between three different groups using our fully customizable 3-circle Venn diagram template.
Trusted by 65M+ users and leading companies


About the 3-Circle Venn Diagram Template
Miro’s 3-circle Venn diagram template is a visual tool for providing a clear and effective way to showcase relationships between datasets. By overlapping two or more circles, Venn diagrams are great for visualizing the differences and similarities between multiple datasets.
It’s therefore no surprise that they’re useful for assessing probability in statistics, mathematics, and engineering. Because they can help break down complex ideas into visually appealing and digestible ways, Venn diagrams are especially useful for brainstorming and problem-solving.
Using the 3-circle Venn diagram template saves you time from having to build one from scratch. We’ll walk you through how to make the most of it.
How to use the 3-circle Venn diagram template
To get started, click on the blue “use template” button to open the 3-circle Venn diagram template in Miro. When you’re ready, follow these steps:
1. Add data to each circle
As its name implies, the 3-circle Venn diagram template comes with three circles ready for you to fill in. Identify what groups you want to compare in your Venn diagram and assign them to each circle: A, B, and C. In each circle, list the items that belong to that group.
For example, let’s say you’re comparing the qualities of an apple, a pear, and an orange. You could use circle A to list an apple’s qualities, circle B to list a pear’s qualities, and circle C to list an orange’s.
2. Identify the differences
Let’s say you’re comparing apples, pears, and oranges based on their color. You could write “red” in circle A, “green” in circle B, and “orange” in circle C. Since each fruit has a unique color, you’ll notice that none of them are part of overlapping circles. These are your differences. Double-click the text boxes in each circle to replace the pre-written text with your own.
3. Identify the similarities
Identify what all three fruits have in common and make sure that you’ve placed those qualities in the overlapping section of the circle. For example, you might write “contains seeds” as a similarity. Double-click on the text box in the overlapping section to edit the pre-written text.
4. Customize the template
Once you’ve added all the information you need to compare your three objects or concepts, it’s time to customize the look and feel. It’s easy to change up shapes, sizes, and font types in the 3-circle Venn diagram template — whether you want to align your diagram with brand colors, present your information more clearly, or simply make it more visually appealing.
Want to try creating your Venn diagram from scratch? Explore our Venn diagram tool to learn more.
Benefits of using Miro’s 3-circle Venn diagram template
Miro makes it easy to create Venn diagrams online with your team and discuss them in real time or asynchronously. It only takes seconds to add the 3-circle Venn diagram template, saving you time from having to create one from scratch while allowing you to dive straight into the customization process. Easily edit text, drag and drop your own images, and tag your teammates in comments.
With an infinite canvas, you can also add as many sticky notes, shapes, and images as you need to add context to your Venn diagram. On top of that, Miro integrates with over 130 apps, including project management tools like Jira and Trello and entire suites like Microsoft 365 and Google Workspace. That means you get to use the 3-circle Venn diagram template alongside other tools you already love.
Is Miro’s 3-circle Venn diagram template free?
Yes, Miro’s 3-circle Venn diagram template is free and customizable. Simply click on “use template” to open the template in Miro and start filling it in, editing the look and feel, and sharing it with teammates when you’re ready.
When should I use Miro’s 3-circle Venn diagram template?
One of Venn diagrams' most well-known use cases is determining probability — which is especially common in fields like data analytics, engineering, and other scientific fields. Speaking of science, they’re helpful for visual problem-solving complex algorithms in the world of software and computer science. That said, Venn diagrams are also popular in the arts, such as studying the similarities and differences between various languages and language groups. In other words, you can use Venn diagrams anytime you have to compare two or more groups.
What are the key components of a Venn diagram?
There are six key components: sets, union, intersection, symmetric difference, complement, and relative complement. Sets refer to the data you’re comparing, such as numbers, ideas, or even objects. Union refers to everything that we’re considering in the Venn diagram — also known as the universal set. The intersection refers to what the datasets have in common — where the circles overlap. The symmetric difference includes everything except the intersection. The complement refers to everything that doesn’t belong to a particular set, while the relative complement refers to everything that’s in one set but not another.
Get started with this template right now.
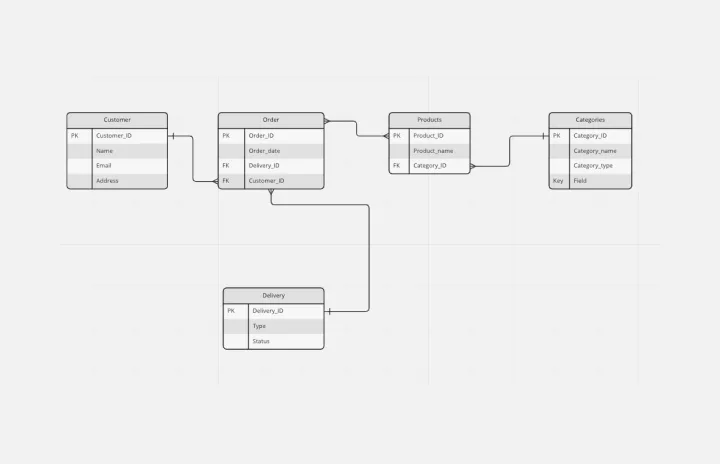
Entity Relationship Diagram Template
Works best for:
Flowcharts, Strategic Planning, Diagrams
Sometimes the most important relationships in business are the internal ones—between the teams, entities, and actors within a system. An entity relationship diagram (ERD) is a structural diagram that will help you visualize and understand the many complex connections between different roles. When will an ERD come in handy? It’s a great tool to have for educating and onboarding new employees or members of a team, and our template makes it so easy to customize according to your unique needs.
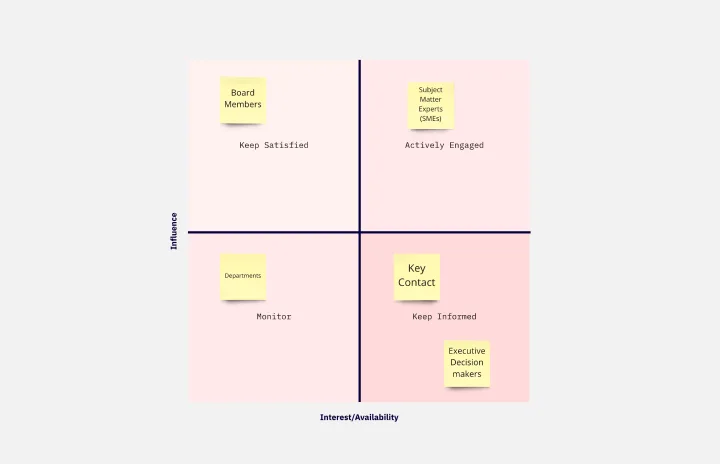
Stakeholder Analysis Template
Works best for:
Project Management, Strategic Planning, Project Planning
Managing stakeholders is integral to completing a project on time and meeting expectations, so here’s how to use a stakeholder analysis to help. A stakeholder analysis empowers you to meet expectations and complete projects on time by identifying individuals, groups, and organizations with a vested interest in a program or process. In a typical stakeholder analysis, you’ll prioritize stakeholders based on their influence on a project and seek to understand how best to interface with them throughout the course of the project.
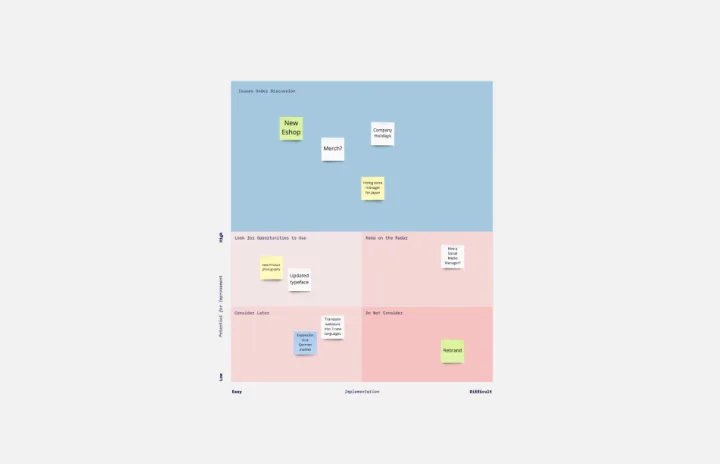
Parking Lot Matrix Template
Works best for:
Project Management, Ideation, Meetings
When the creative energy is flowing, a workshop or meeting will yield a lot of new ideas — but not all are on-topic or currently feasible. Roll them right onto a parking lot matrix, a simple, effective tool for separating the best ideas from those that are promising but could use more research or discussion. This template will let you easily make your own parking lot matrix, which will come in especially handy during long meetings (and when you have teammates who tend to go off-topic).
Job Map Template
Works best for:
Design, Desk Research, Mapping
Want to truly understand your consumers’ mindset? Take a look at things from their perspective — by identifying the “jobs” they need to accomplish and exploring what would make them “hire” or “fire” a product or service like yours. Ideal for UX researchers, job mapping is a staged process that gives you that POV by breaking the “jobs” down step by step, so you can ultimately offer something unique, useful, and different from your competitors. This template makes it easy to create a detailed, comprehensive job map.

Azure Architecture Diagram Template
Works best for:
Software Development, Diagrams
The Azure Architecture Diagram Template is a diagram that will help you visualize the combination of any data and build and deploy custom machine learning models at scale. Azure is Microsoft’s cloud computing platform, designed to provide cloud-based services such as remote storage, database hosting, and centralized account management. Use Azure Architecture Diagram template to build sophisticated, transformational apps.