UML State Machine Diagram Template
Visualize the different stages of an object or system using a UML state machine diagram template.
Trusted by 65M+ users and leading companies


About the UML State Machine Diagram Template
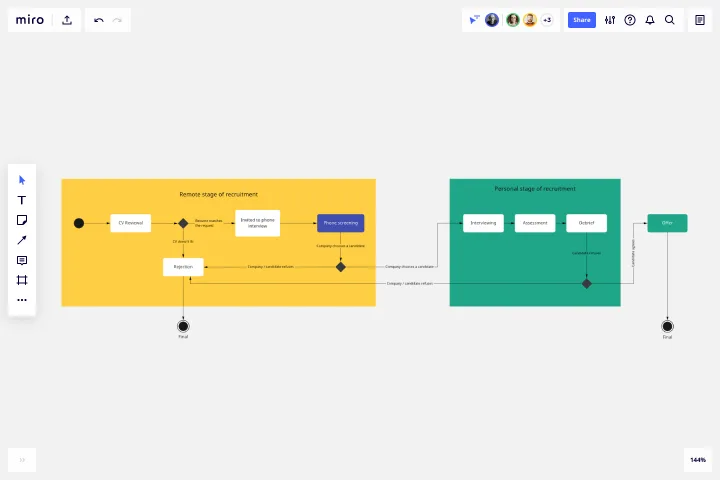
Miro’s UML state machine diagram template is a visual tool you can use to illustrate an object or system’s various states and how it transitions from one to another. State machine diagrams are especially useful for software engineers and system architects looking to understand, design, and communicate complex state transitions and interactions — such as seeing how a web service responds to different requests.
In the next section, we’ll walk you through how to use the UML state machine diagram template.
How to use the UML state machine diagram template
To get started, click on the “use template” button to open the UML state machine diagram template in Miro. Once you’re in, follow these steps to start filling it in:
1. Define states and objects
Define your possible states and the objects that belong to them. Use the shapes in the template to represent each state by double-clicking on the text boxes to edit them.
For example, if you’re creating a behavioral state machine diagram for an elevator system, you could define the states as 'Not activated,' 'Waiting for user input,' and 'Moving up' or ‘Moving down.’
2. Connect states to objects
Once you’ve defined your states, connect them with the correct objects. For example, for a UML state machine diagram representing an elevator system, you’d connect the ‘Move Up’ object to the 'moving up' state and the ‘Move Down’ object to the 'moving down' state.
Use the arrows in the state machine diagram template to link states and objects. Rearrange, duplicate, and remove them as needed.
3. Add transition actions and conditions
Once you connect the states with the objects, fill in the appropriate actions for each state. For example, if your elevator diagram has a state called 'waiting for user input,’ instruct the user on what they should do next. Double-click on the text boxes you want to edit to replace them with your own actions and outcomes.
4. Define guard conditions
Finally, add guard conditions or actions that would trigger your transitions. For example, if an elevator is moving upward and the user presses the 'down' button, this action would trigger the elevator to move back to its 'waiting for user input' state.
In the state machine diagram template, double-click on a textbox along an arrow connecting two states and add the appropriate guard condition.
Miro is also the perfect state diagram maker if you'd prefer to diagram from scratch. Simply use Miro's diagramming tool and UML shape pack.
What is the state machine diagram template for?
A state machine diagram template helps you visualize a software’s different states and how it transitions between them. Take video games, for example. If you’re designing a video game, a state machine diagram will help show how the user will move through the different stages of playing.
Can I build a state machine diagram from scratch?
Absolutely. Miro makes it easy to build a state machine diagram from scratch using our automated diagramming and mapping tools and user-friendly interface. Drag and drop the shapes you need onto your canvas, add connection lines to depict transitions, and use text boxes to add labels.
Does Miro have a free UML diagramming shape pack?
Miro offers plenty of free shape packs to equip you with all the diagramming tools you need — though you’ll need a Business, Enterprise, or Education plan to access our UML shape pack.
Get started with this template right now.
Kano Model Template
Works best for:
Desk Research, Product Management, Prioritization
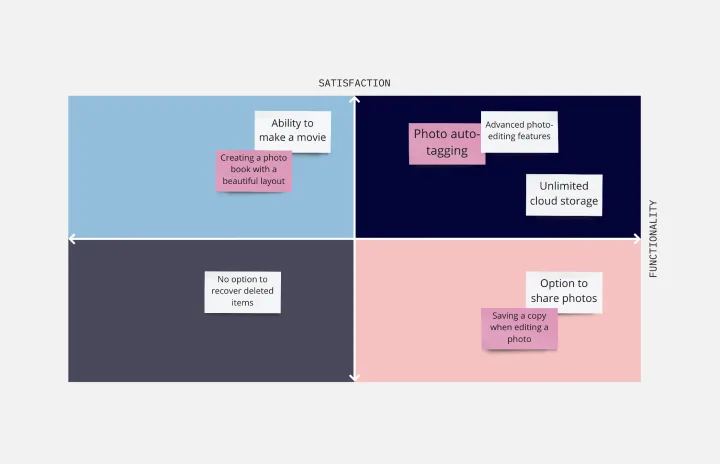
When it comes down to it, a product’s success is determined by the features it offers and the satisfaction it gives to customers. So which features matter most? The Kano model will help you decide. It’s a simple, powerful method for helping you prioritize all your features — by comparing how much satisfaction a feature will deliver to what it will cost to implement. This template lets you easily create a standard Kano model, with two axes (satisfaction and functionality) creating a quadrant with four values: attractive, performance, indifferent, and must-be.
Kinship Diagram Template
Works best for:
Mapping, Diagrams
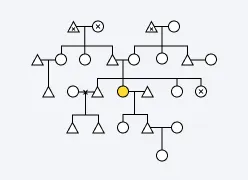
Use a Kinship Diagram Template to map out a clear picture of your family relationships. With clear guidelines for kinship notation, you can navigate everything from your closest uncle to your third cousin twice removed. Try the Kinship Diagram Template to understand your family relationships.
Low-fidelity Wireframes Template
Works best for:
Desk Research, Product Management, Wireframes
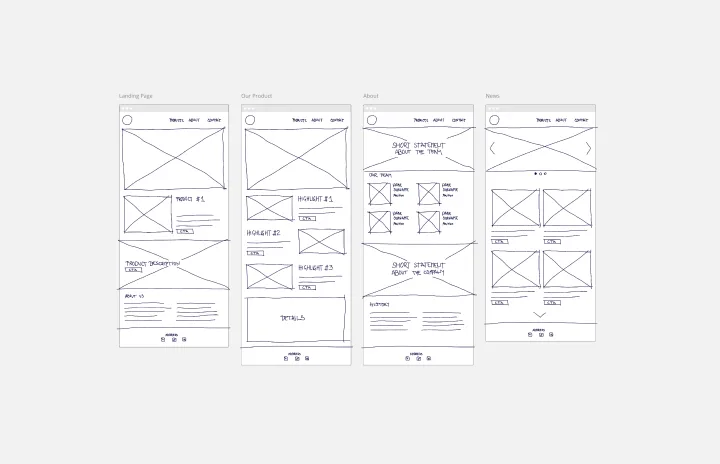
When you’re designing a site or building an app, the early stages should be BIG — seeing the big picture and communicating the big idea. Low fidelity wireframes empower you to see it and do it. These rough layouts (think of them as the digital version of a sketch on a napkin) help your teams and project stakeholders quickly determine if a design meeting meets your users’ needs. Our template lets you easily use wireframes during meetings or workshops, presentations, and critique sessions.
Bracket Template
Works best for:
Diagramming
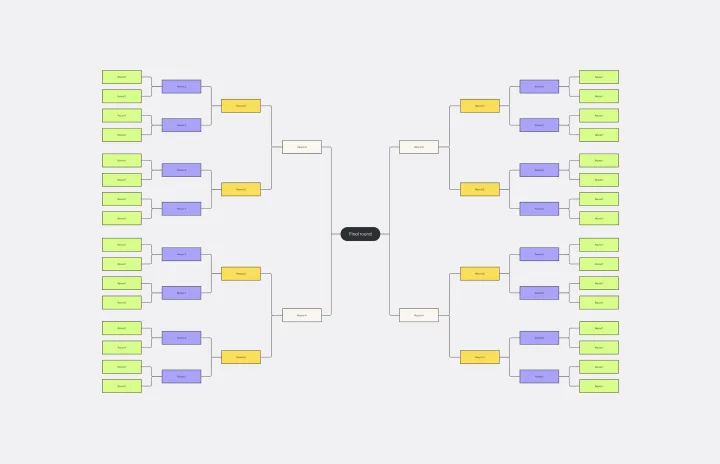
The Bracket Template is a dynamic visualization tool that helps to organize and rank ideas, entities, or teams in a sequential and competitive manner. It is structured like a tree, starting with multiple entries on either side, which then face off in successive rounds, leading to a single winner or conclusion. One of its standout benefits is its ability to simplify complex decision-making processes. Breaking down choices into smaller, head-to-head comparisons, makes the path to a final decision clearer, ensuring clarity and fostering engagement among participants. Moreover, the Bracket Template is particularly useful when there are multiple options to consider and when there is a need to compare and contrast those options. It is an effective way to streamline decision-making, making it easier and more efficient.
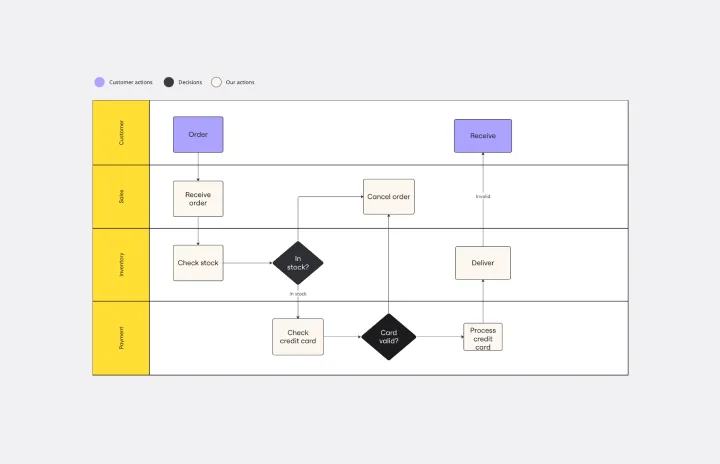
Swimlane Diagram Template
Works best for:
Flowcharts, Diagrams, Workflows
A swimlane diagram shows you which stakeholders are responsible for each area of your critical processes. You can use it to understand current processes or plan new ones.
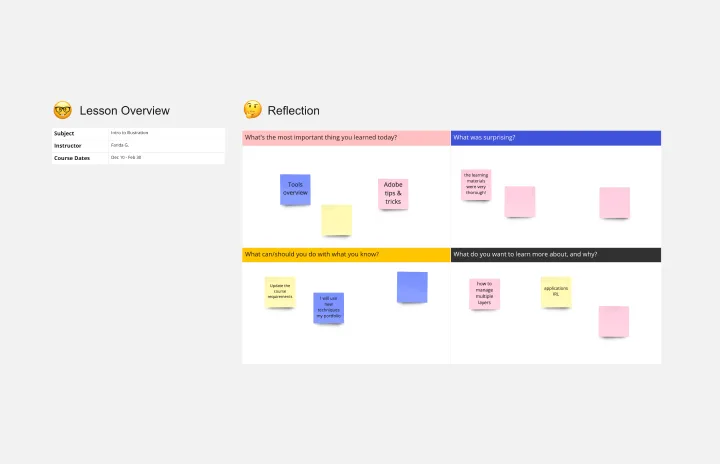
Lesson Reflection Template
Works best for:
Education, Meetings
The Lesson Reflection template is a tool to create space for self-reflection and improvement. Students can evaluate the key takeaways from a lesson and what are the topics they find most interesting. As teachers receive the student’s Lesson Reflection, they can look for opportunities to improve learning and teaching methodologies. The Lesson Reflection template can help you facilitate the educational process, and it’s easy to use and straightforward.