UML Sequence Diagram Template
Understand the order in which the events within a sequence interact with each other using Miro's UML sequence diagram template.
Trusted by 65M+ users and leading companies


About the UML Sequence Diagram Template
A sequence diagram template is a tool that helps teams get a better overview of their work process, depicting object interaction in a system in sequential order. Many use a system sequence diagram to map the customer journey through an eCommerce store or to get a high-level overview of specific business functions. In the first scenario, the customer is the "actor" or external entity interacting with the diagram elements. The diagram for the second example does not necessarily need to have an "actor."
Teams also use the sequence diagram to analyze existing work systems. However, one of its primary use cases is in requirements documents for future systems implementation, so when staff or analysts design a new system, one or more sequence diagrams are used to showcase how this system will behave.
How to use the UML sequence diagram template
Miro is the perfect online sequence diagram tool to create your diagram from scratch and share it with your team. Miro also has its own template that you can customize to suit your needs. Simply select the UML sequence diagram template and then follow these steps:
1. Identify your lifelines
Lifelines represent the roles or object instances that are interacting. There can be two or more lifelines in a sequence. Each lifeline is placed in a box at the top of the diagram with a vertical dashed line below it.
2. Create messages
A message is an interaction between the lifelines. It is represented using a horizontal arrow. Seven different types of messages can be used in a sequence diagram.
3. Define your actor
An actor is an external entity that interacts with the sequence but is not a part of that sequence. In online shopping, for example, the "actor" is the customer, while the shopping system (e.g. "Add to cart"-"Total"-"Confirm order") is the sequence.
4. Add action bars
An activation bar is a thin rectangle that is placed under a lifeline to represent the time it takes to complete a task. You can add multiple activation bars on the lifelines.
5. Include any other important features
In complex sequence diagrams, you can add Alternatives, Options, and Loops to represent different sequences.
Examples of a UML sequence diagram
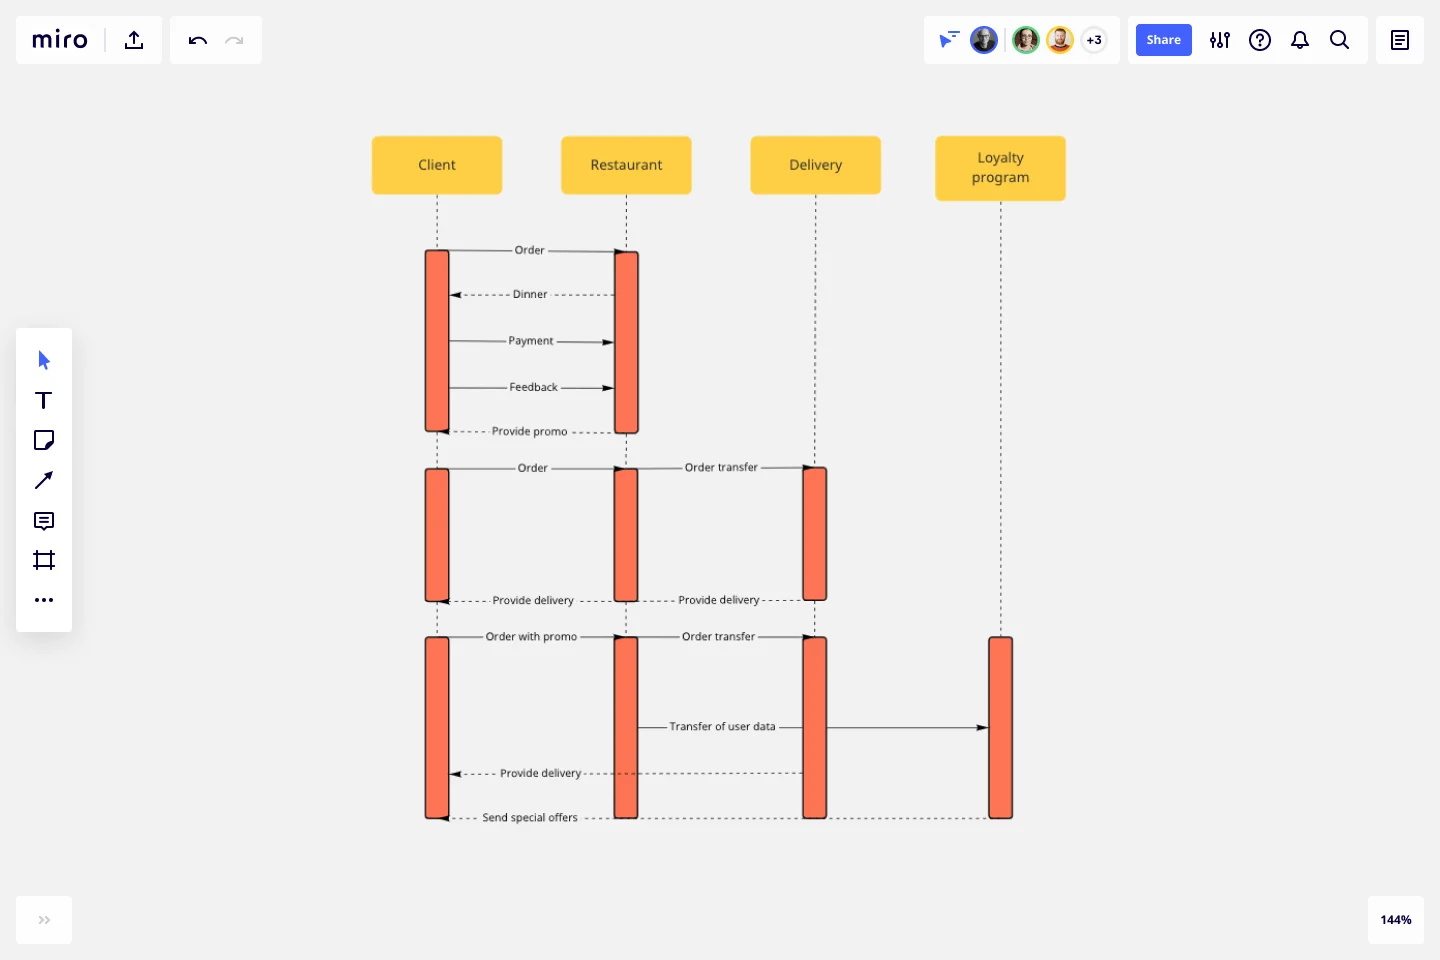
Let's use the example of a fast-food restaurant's ordering system to understand how a sequence diagram works.
The following interactions take place during this sequence when a customer wants to place an order:
They go to the cash counter and place an order
The cashier confirms the order and gives order details to the kitchen
The kitchen staff prepare the food and deliver it back to the counter
The cashier hands the order to the customer.
A sequence diagram example for this scenario will have the customer, the cashier, and the kitchen as the three lifelines. They deliver messages back and forth.
The actions that take place during this sequence are the messages. Such as "Place an order," "Order confirmation," "Order details for preparation," and "Order delivery."
Benefits of using the UML sequence diagram template
Let’s walk through the four benefits of using a sequence diagram template.
1. Discover interface and logical problems early
Since creating a sequence diagram requires teams to flesh out all the details of a system, it helps them find problems well before the implementation phase.
2. Collaborate with teammates
A sequence diagram is an excellent option when you want to clearly depict how a system works or should work during team meetings or projects. Because of this, you can use it as a collaboration diagram.
3. Get a bird’s-eye view
With a sequence diagram, analysts can examine a system, whether that's a shopping kiosk or a new app, at various levels of abstraction. You can start with a high-level view of the system and then delve into the details as required.
4. Update it easily
Teams can update every element within a sequence diagram to match changing events or circumstances without overhauling the entire diagram.
What are the basic elements of a sequence diagram?
The most crucial elements of a sequence diagram are lifelines, messages, actors, and activations. There are more complex elements that can help depict complicated or recurring systems.
What does a sequence diagram show?
A sequence diagram shows how two or more elements within a system interact in the sequential order of their interaction. It is a UML diagram that highlights the sequence of messages passed between objects within an application.
What is the format of a sequence diagram?
A sequence diagram is a visual representation of how different components or objects interact with each other over time in a system. It typically includes vertical lifelines representing participants, horizontal arrows showing messages exchanged between them, and activation boxes indicating the time period for each participant's activity. The order of messages reflects the chronological sequence of interactions, and activation arrows show the focus of control during each step. Additional elements like loops, conditions, and parallel interactions can be represented using combined fragments. Although the format may vary depending on the modeling language or tool, these fundamental elements provide a clear understanding of the dynamic behavior within a system.
Get started with this template right now.
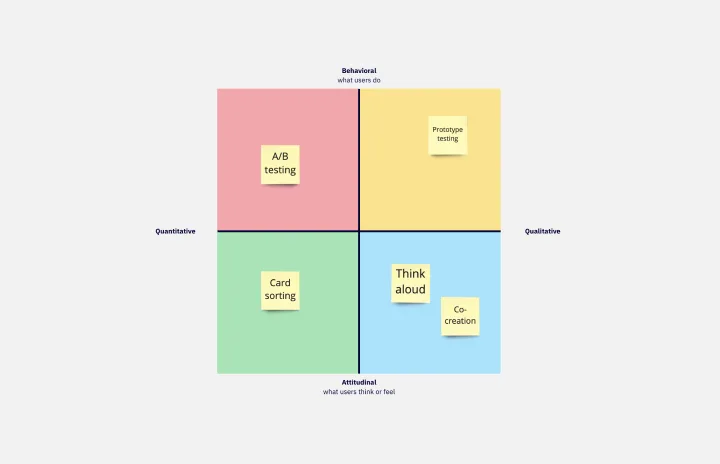
Design Research Template
Works best for:
UX Design, Design Thinking, Desk Research
A design research map is a grid framework showing the relationship between two key intersections in research methodologies: mindset and approach. Design research maps encourage your team or clients to develop new business strategies using generative design thinking. Originally designed by academic Liz Sanders, the framework is meant to resolve confusion or overlap between research and design methods. Whether your team is in problem-solving or problem space definition mode, using a research design template can help you consider the collective value of many unrelated practices.
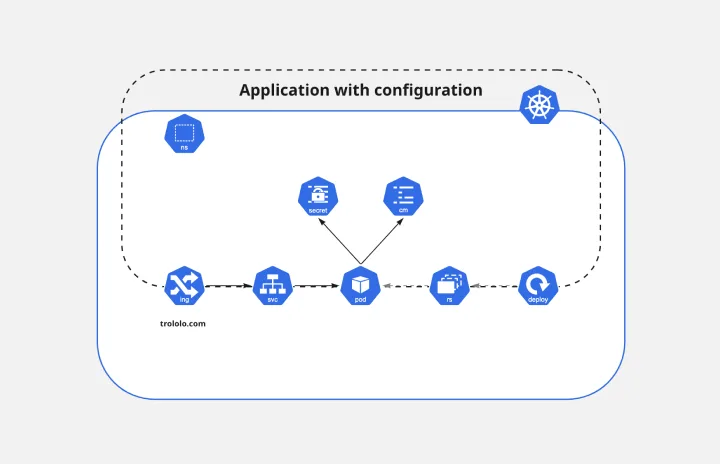
Kubernetes Application Template
Works best for:
Software Development, Diagrams
Use the Kubernetes Application template to manage enterprise-ready containerized applications better. You can now get your team more agile when dealing with portability, licensing, and consolidated billing. The Kubernetes Application template allows you to run deployments anywhere, facilitating the management of your applications. Try it out and see if it’s the best fit for you and your team.

Azure Architecture Diagram Template
Works best for:
Software Development, Diagrams
The Azure Architecture Diagram Template is a diagram that will help you visualize the combination of any data and build and deploy custom machine learning models at scale. Azure is Microsoft’s cloud computing platform, designed to provide cloud-based services such as remote storage, database hosting, and centralized account management. Use Azure Architecture Diagram template to build sophisticated, transformational apps.
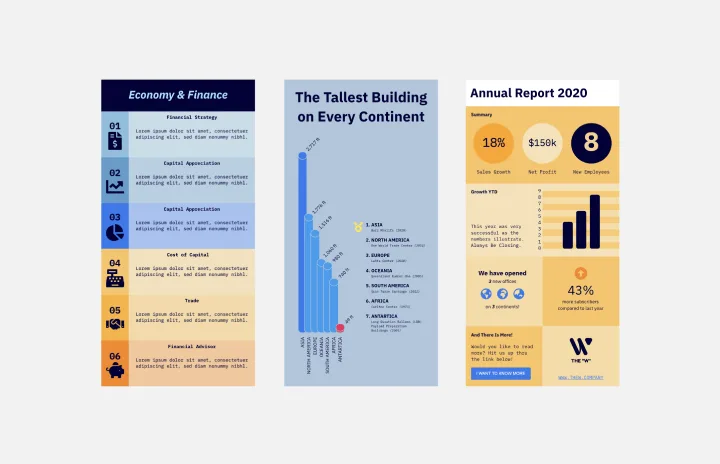
Infographic Template
Works best for:
Marketing, Desk Research, Documentation
As we bet you’ve experienced, data can get pretty dense and dry. But you need it to be compelling, memorable, and understandable. The solution? Infographics. These are tools that let you present information in a visually striking way and turn quantitative or qualitative data into stories that engage and resonate. Whoever you’ll be presenting to — customers, donors, or your own internal teams — our template will let you design an infographic that combines text and visuals to break down even the most complicated data.
Cisco Data Network Diagram Template
Works best for:
Software Development, Diagrams
Cisco offers data center and access networking solutions built for scale with industry-leading automation, programmability, and real-time visibility. The Cisco Data Network Diagram uses Cisco elements to show the network design of Cisco Data Networks visually.
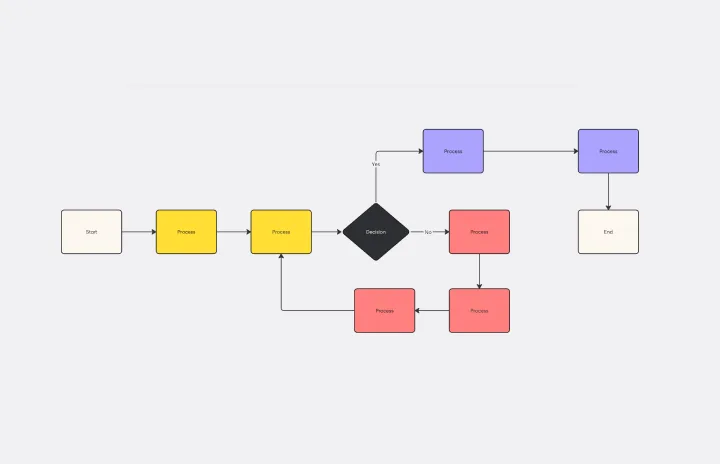
Flowchart Template
Works best for:
Flowcharts, Mapping, Diagrams
Trying to explain a process or workflow to your team — or just wrap your head around it yourself? Sometimes the best way is to see it, and that’s when you create a flowchart. Using common shapes (generally just ovals, rectangles, diamonds, and arrows), a flowchart shows you the direction a process or workflow goes and the order of steps. Beyond giving you a clear understanding, you’ll also be able to see potential flaws and bottlenecks, which helps you refine and improve your process and create a better product more efficiently.