UML Component Diagram Template
Plan, draw, and share an object-oriented system’s elements and components using our UML component diagram template.
Trusted by 65M+ users and leading companies


About the Component Diagram Template
Easily map out complex software systems using Miro’s fully customizable UML component diagram template. With pre-made component and interface symbols from our extensive UML shape pack, adjustable connection lines, and text boxes, you’re all set to create high-level visual overviews of anything from e-commerce systems to banking systems.
Using Miro’s component diagram template also gets you access to our powerful visual workspace — allowing you to quickly expand on the template with our automated diagramming tools and seamlessly collaborate with your team online.
We’ll walk you through how to make the most of our UML component diagram template.
How to use the component diagram template
To get started, click on the blue “Use template” button to open the component diagram template in Miro. Once you’re in, set your board up by inviting any collaborators you’d like to work on the template with. When you’re ready, follow the steps below to start filling the component diagram template out:
1. Pick a system
Decide on the system you’d like to visualize using the component diagram template — whether it’s an e-commerce system, banking system, or something else. It’s also worth aligning with your team to gather any input you might need from them to build the diagram.
2. Plot components
Once you’ve picked a system, start by visualizing its various components. The template comes with pre-made component symbols from our UML shape pack. To edit them, double-click on the pre-written text and add your own labels. For example, if you’re visualizing an e-commerce system, you might have components like “user interface,” “payment gateway,” and “product catalog.”
Need more components? Click on any component symbol to reveal blue dots on its side. Any blue dot you click on with automatically generate a connection line from that point with a matching component symbol on the other end — allowing you to quickly expand on the template.
3. Plot interfaces
The template also comes with pre-made interface symbols from our UML shape pack, with text boxes below each one. Double-click on the text boxes to replace the pre-written content with your own, allowing you to represent your system’s interfaces on the component diagram template. Going back to our e-commerce example, you might have interfaces labeled “customer interface” and “admin interface.”
4. Adjust connection lines
Use the template’s pre-made connection lines to visualize dependencies and wiring within your system. To adjust the lines, click on one to reveal two white dots on each end, and drag them until you’re happy with the position. You can use the blue dot in the middle to adjust your line’s curve.
You can also grab sticky notes or text boxes from the toolbar to give the connections some context. For example, you could add more information to the “payment gateway” component by adding a text box below it that says “handles payment processing and transactions.”
5. Customize the template
Now that you’ve visualized the key components, interfaces, and connections, it’s time to customize the component diagram template. Change colors, play with font types, and adjust the sizes of your elements — anything that might make your diagram easier to understand, or simply make it your own.
You could even change the styles of your connection lines for some visual differentiation between them. Just click on a connection line to reveal the pop-up menu, then click on “Type” to edit your line style.
6. Share the diagram
Get feedback on your completed component diagram template by inviting your team to view and comment on your Miro board. You can also export it as a PDF or image, generate a shareable link, or embed your Miro board on other sites.
Prefer to build your component diagram from scratch? Use Miro's UML component diagram tool and get access to our extensive UML shape pack.
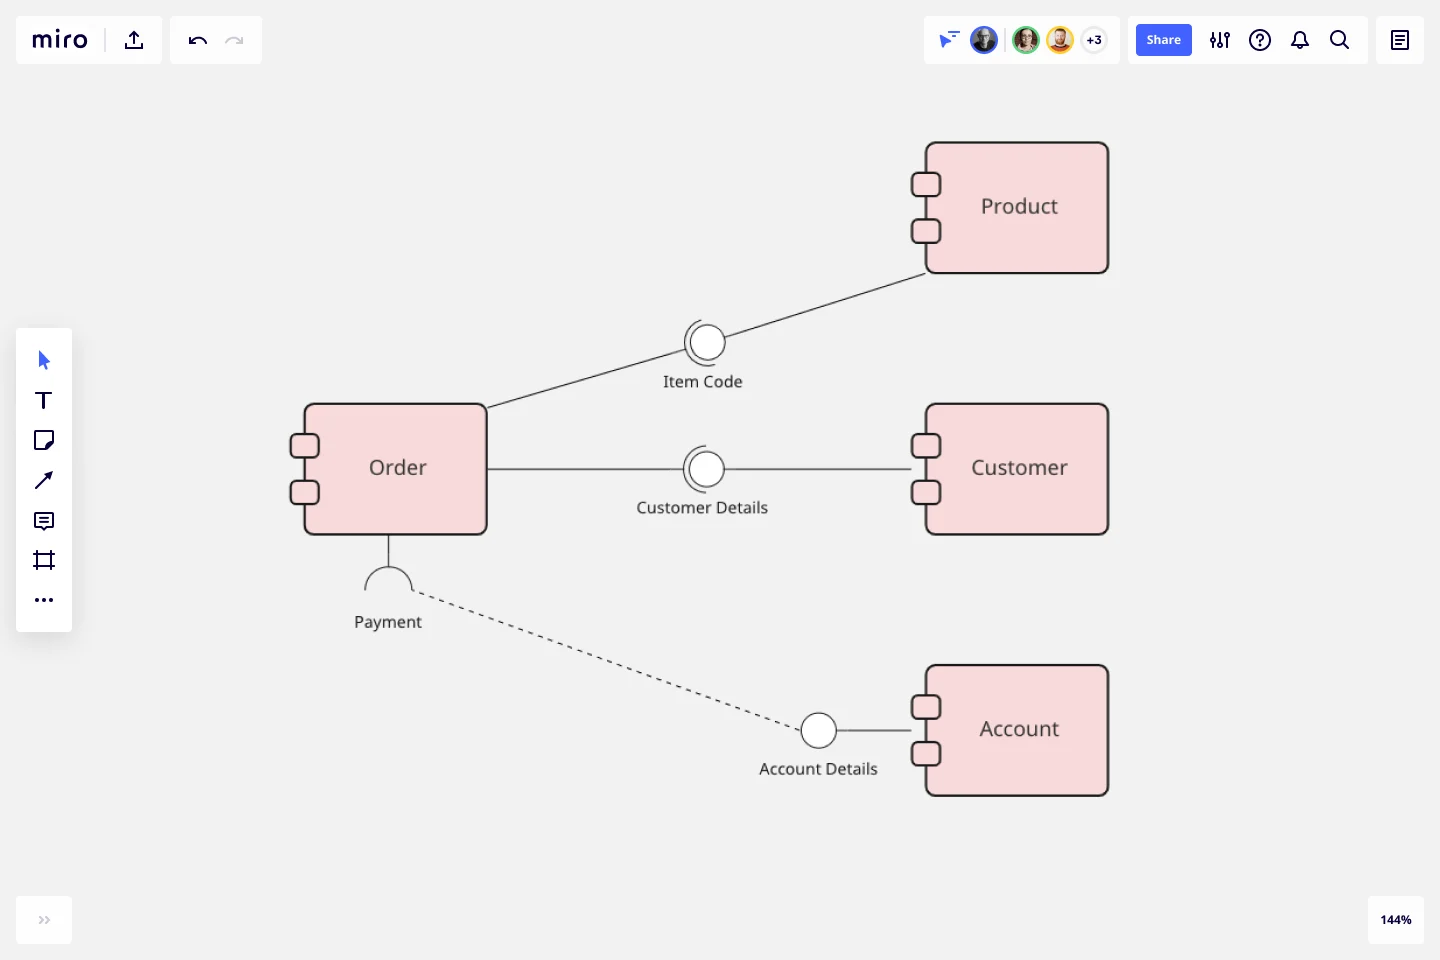
Component diagram example: e-commerce website
Let’s take a look at an example of a component diagram depicting an e-commerce website. In this case, you’d make sure the component diagram template illustrates all the physical components and artifacts that make up an e-commerce system. Here are some components you’d include:
Suppliers
Components labeled “suppliers” might refer to warehouses that stock and re-sell goods or fulfill physical orders. It could also include production facilities, like factories and workshops. Supplier components typically connect to transportation, logistics, manufacturing, and other adjacent components.
Goods
Physical goods are another common component of a diagram representing an e-commerce website. You could visualize them independently of other components, or visualize them as part of a factory, a store, or a warehouse.
The receiving customer
Since the receiving customer is a physical entity too, it’s worth representing them on the component diagram template. Though you’d likely separate them from the rest of your components since they only interact with the system and aren’t actually part of it.
When should I use a UML component diagram?
A UML component diagram shows the components and artifacts in a system and the structural relationship between these components and artifacts. You can use component diagrams to plan, create, and optimize system components at a high level — in software development, business process planning, and other complex processes across digital and business.
Can I collaborate with others on the UML component diagram template?
Yes, Miro brings teams together — whether you’re working remotely or in person. Invite your team to edit your Miro board with you in real-time or async — or get instant feedback by inviting them to view and comment on the component diagram template. You can also run live and interactive presentations right from your Miro board using Use Presentation Mode, or use TalkTrack to record immersive audio and video walkthroughs your team can watch in their own time.
Does Miro offer a shape pack for UML diagramming?
Yes, Miro offers plenty of specialized shape packs, including a UML shape pack — allowing you to fill out the component diagram template with industry-standard symbols. Get access to our UML shape pack with a Business, Enterprise, or Education plan.
Get started with this template right now.
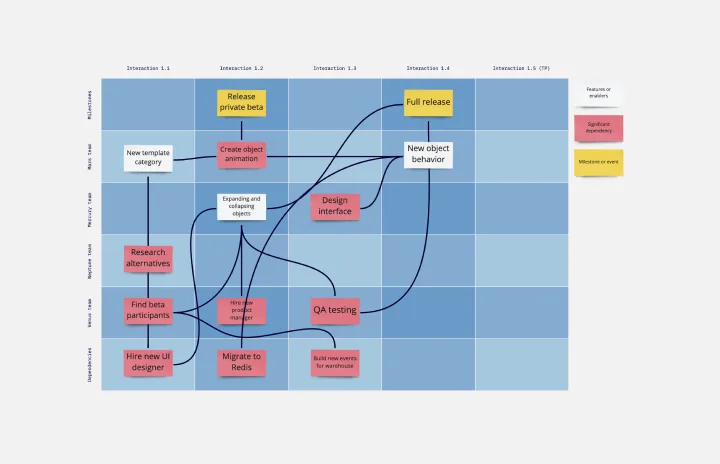
SAFe Program Template
Works best for:
Agile Methodology, Diagrams, Agile Workflows
Many organizations use the Agile model, but even companies that don’t rigorously adhere to all Agile standards have adopted Agile tools and methods like Program Increment (PI) Planning. Even if you’re not participating in a formal PI session, a program board can be a great way to establish communication across teams and stakeholders, align development objectives with business goals, clarify dependencies, and foster cross-functional collaboration. The board provides much-needed structure to planning sessions, yet is adaptable enough to accommodate brainstorming and alignment meetings.
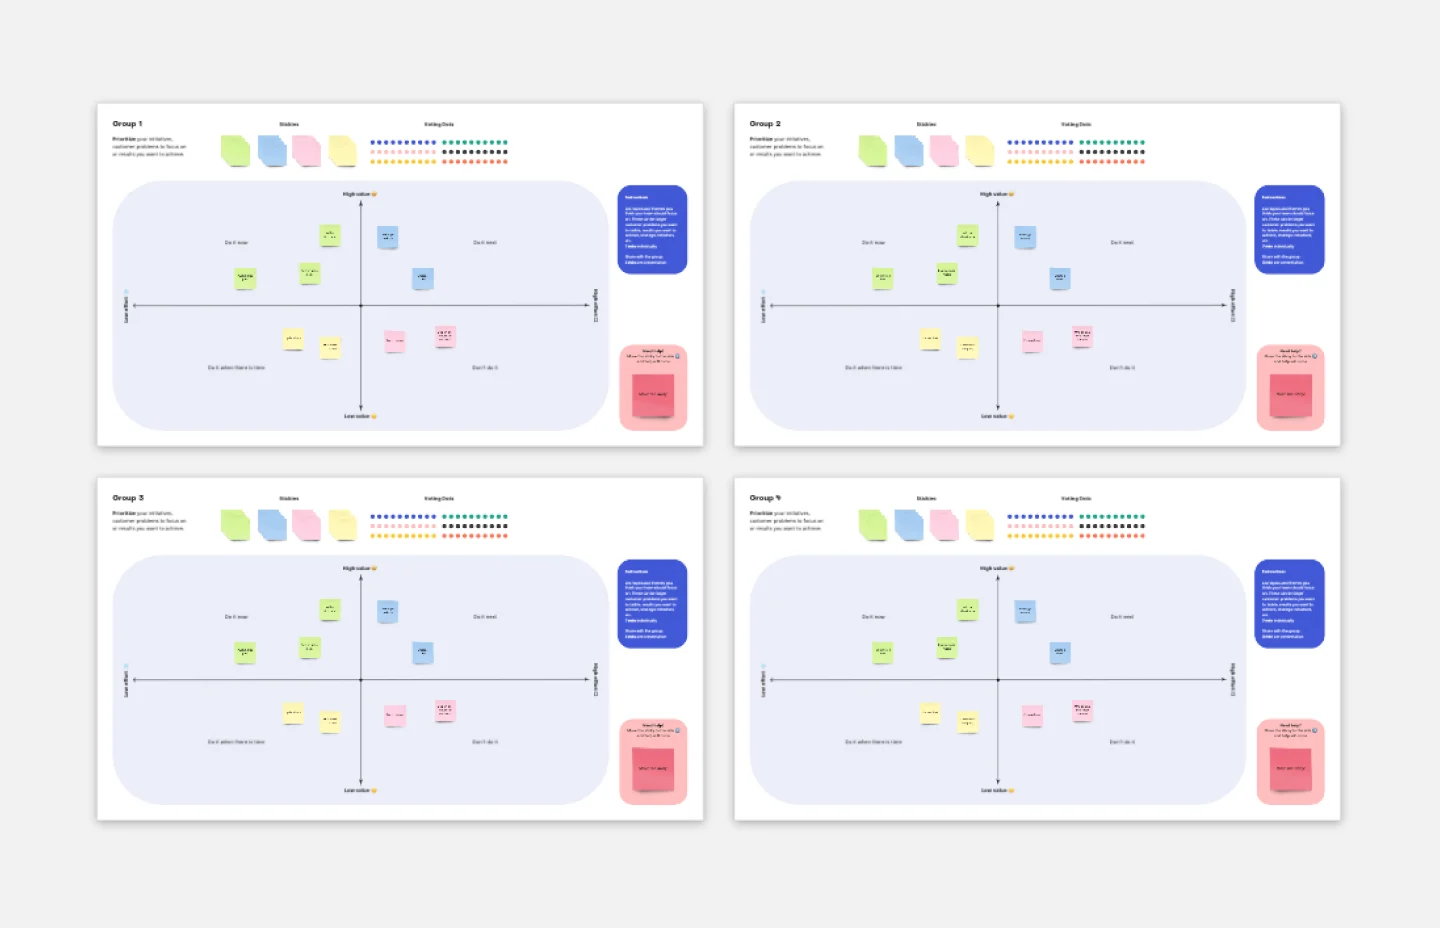
Breakout Group Template
Works best for:
Education, Team Meetings, Workshops
Breakout groups provide an excellent opportunity for teammates to have candid conversations and connect on a more intimate level than is possible during a broader meeting. When you’re in a large group setting, it can be difficult for people to feel safe or comfortable speaking up. In a smaller group, participants can feel safer sharing their ideas. Since the group is more intimate, teams are empowered to participate rather than observe.

UML State Machine Diagram Template
Works best for:
Software Development, Mapping, Diagrams
Visualize the workflow of a process and how objects perform actions based on different stimuli. State machine diagrams are valuable for understanding how an object responds to events at the different stages of its life cycle. They are also helpful for visualizing event sequences in a system.
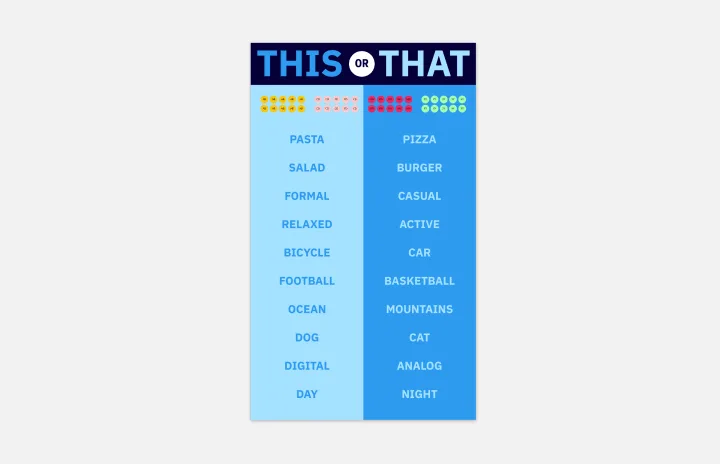
This or That Template
Works best for:
Marketing, Meetings, Workshops
If you’re a social media manager, a designer, or just someone who loves photography, then you’ve probably seen the “This or That” game on Instagram. The premise is simple: You make two parallel lists that pit a series of choices against each other, like “apples or oranges” or “pizza or hot dogs”. The Instagram user chooses between the various options by circling the one that they prefer. Then they share the completed game with their followers. Although it was popularized on Instagram, you can use This or That on other social media platforms too, or even your website or blog.
Reverse Brainstorming Template
Works best for:
Ideation, Brainstorming, Team Meetings
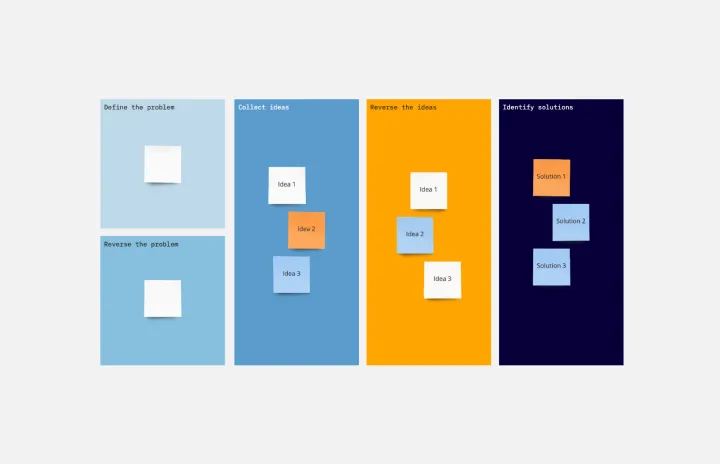
Reverse brainstorming is a technique that prompts a group to think of problems, rather than solutions. Because we naturally think of problems, it’s a great way to get a group to anticipate problems that may occur during a project. To engage in reverse brainstorming, start by identifying the problem, and then think of things that might exacerbate it. Ask your team to generate ideas around ways in which the problem could get worse. Reverse the problems into solutions again, and then evaluate your ideas.
Azure Data Flow Template
Works best for:
Software Development, Diagrams
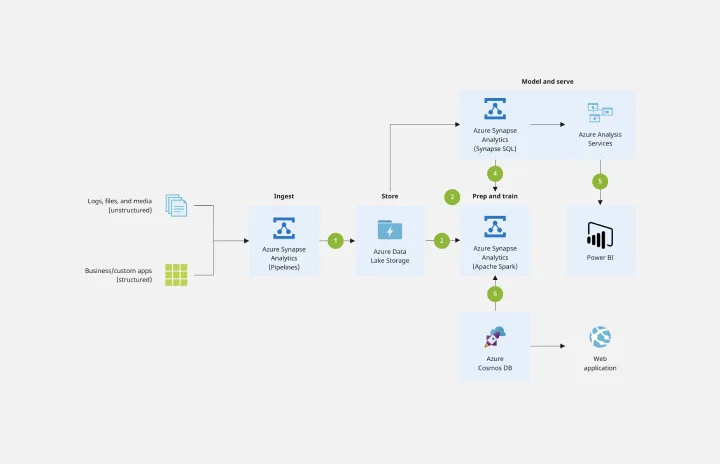
The Azure Data Flow is a diagram that will allow you to combine data and build and deploy custom machine learning models at scale. Azure is Microsoft’s cloud computing platform, designed to provide many cloud-based services like remote storage, database hosting, and centralized account management. Azure also offers new capabilities like AI and the Internet of Things (IoT).